What is the Hull Moving Average Indicator?
The Hull Moving Average (HMA) is a technical indicator used in financial markets to identify trends and generate trading signals. It combines weighted moving averages in a unique way to reduce lag while maintaining smoothness. This indicator is particularly valuable for traders who need to make quick decisions based on price movements while filtering out market noise.
What is the Hull Moving Average?
The Hull Moving Average (HMA) is a sophisticated technical analysis tool designed to enhance the accuracy and responsiveness of traditional moving averages. Developed by Alan Hull in 2005, the HMA seeks to address common issues associated with conventional moving averages, such as lag and noise, making it particularly valuable for traders aiming to identify trends and make informed decisions in dynamic market conditions.
At its core, the HMA operates by combining elements of weighted moving averages (WMAs) and smoothing techniques. This unique approach allows the HMA to prioritize recent price data more heavily than older data, resulting in a smoother curve that reflects current market conditions more accurately. Unlike traditional moving averages, which can be slow to react to price changes, the HMA is designed to provide quicker signals, helping traders capitalize on potential opportunities without delay.
The primary function of the Hull Moving Average is to offer a clearer view of market trends. By minimizing lag and filtering out market noise, it enables traders to identify potential entry and exit points with greater precision. This makes the HMA an essential tool for both short-term and long-term trading strategies.
How to Use Hull Moving Average Indicator

Using the Hull Moving Average effectively involves understanding its signals and how it can fit into your overall trading strategy. Here are some key applications:
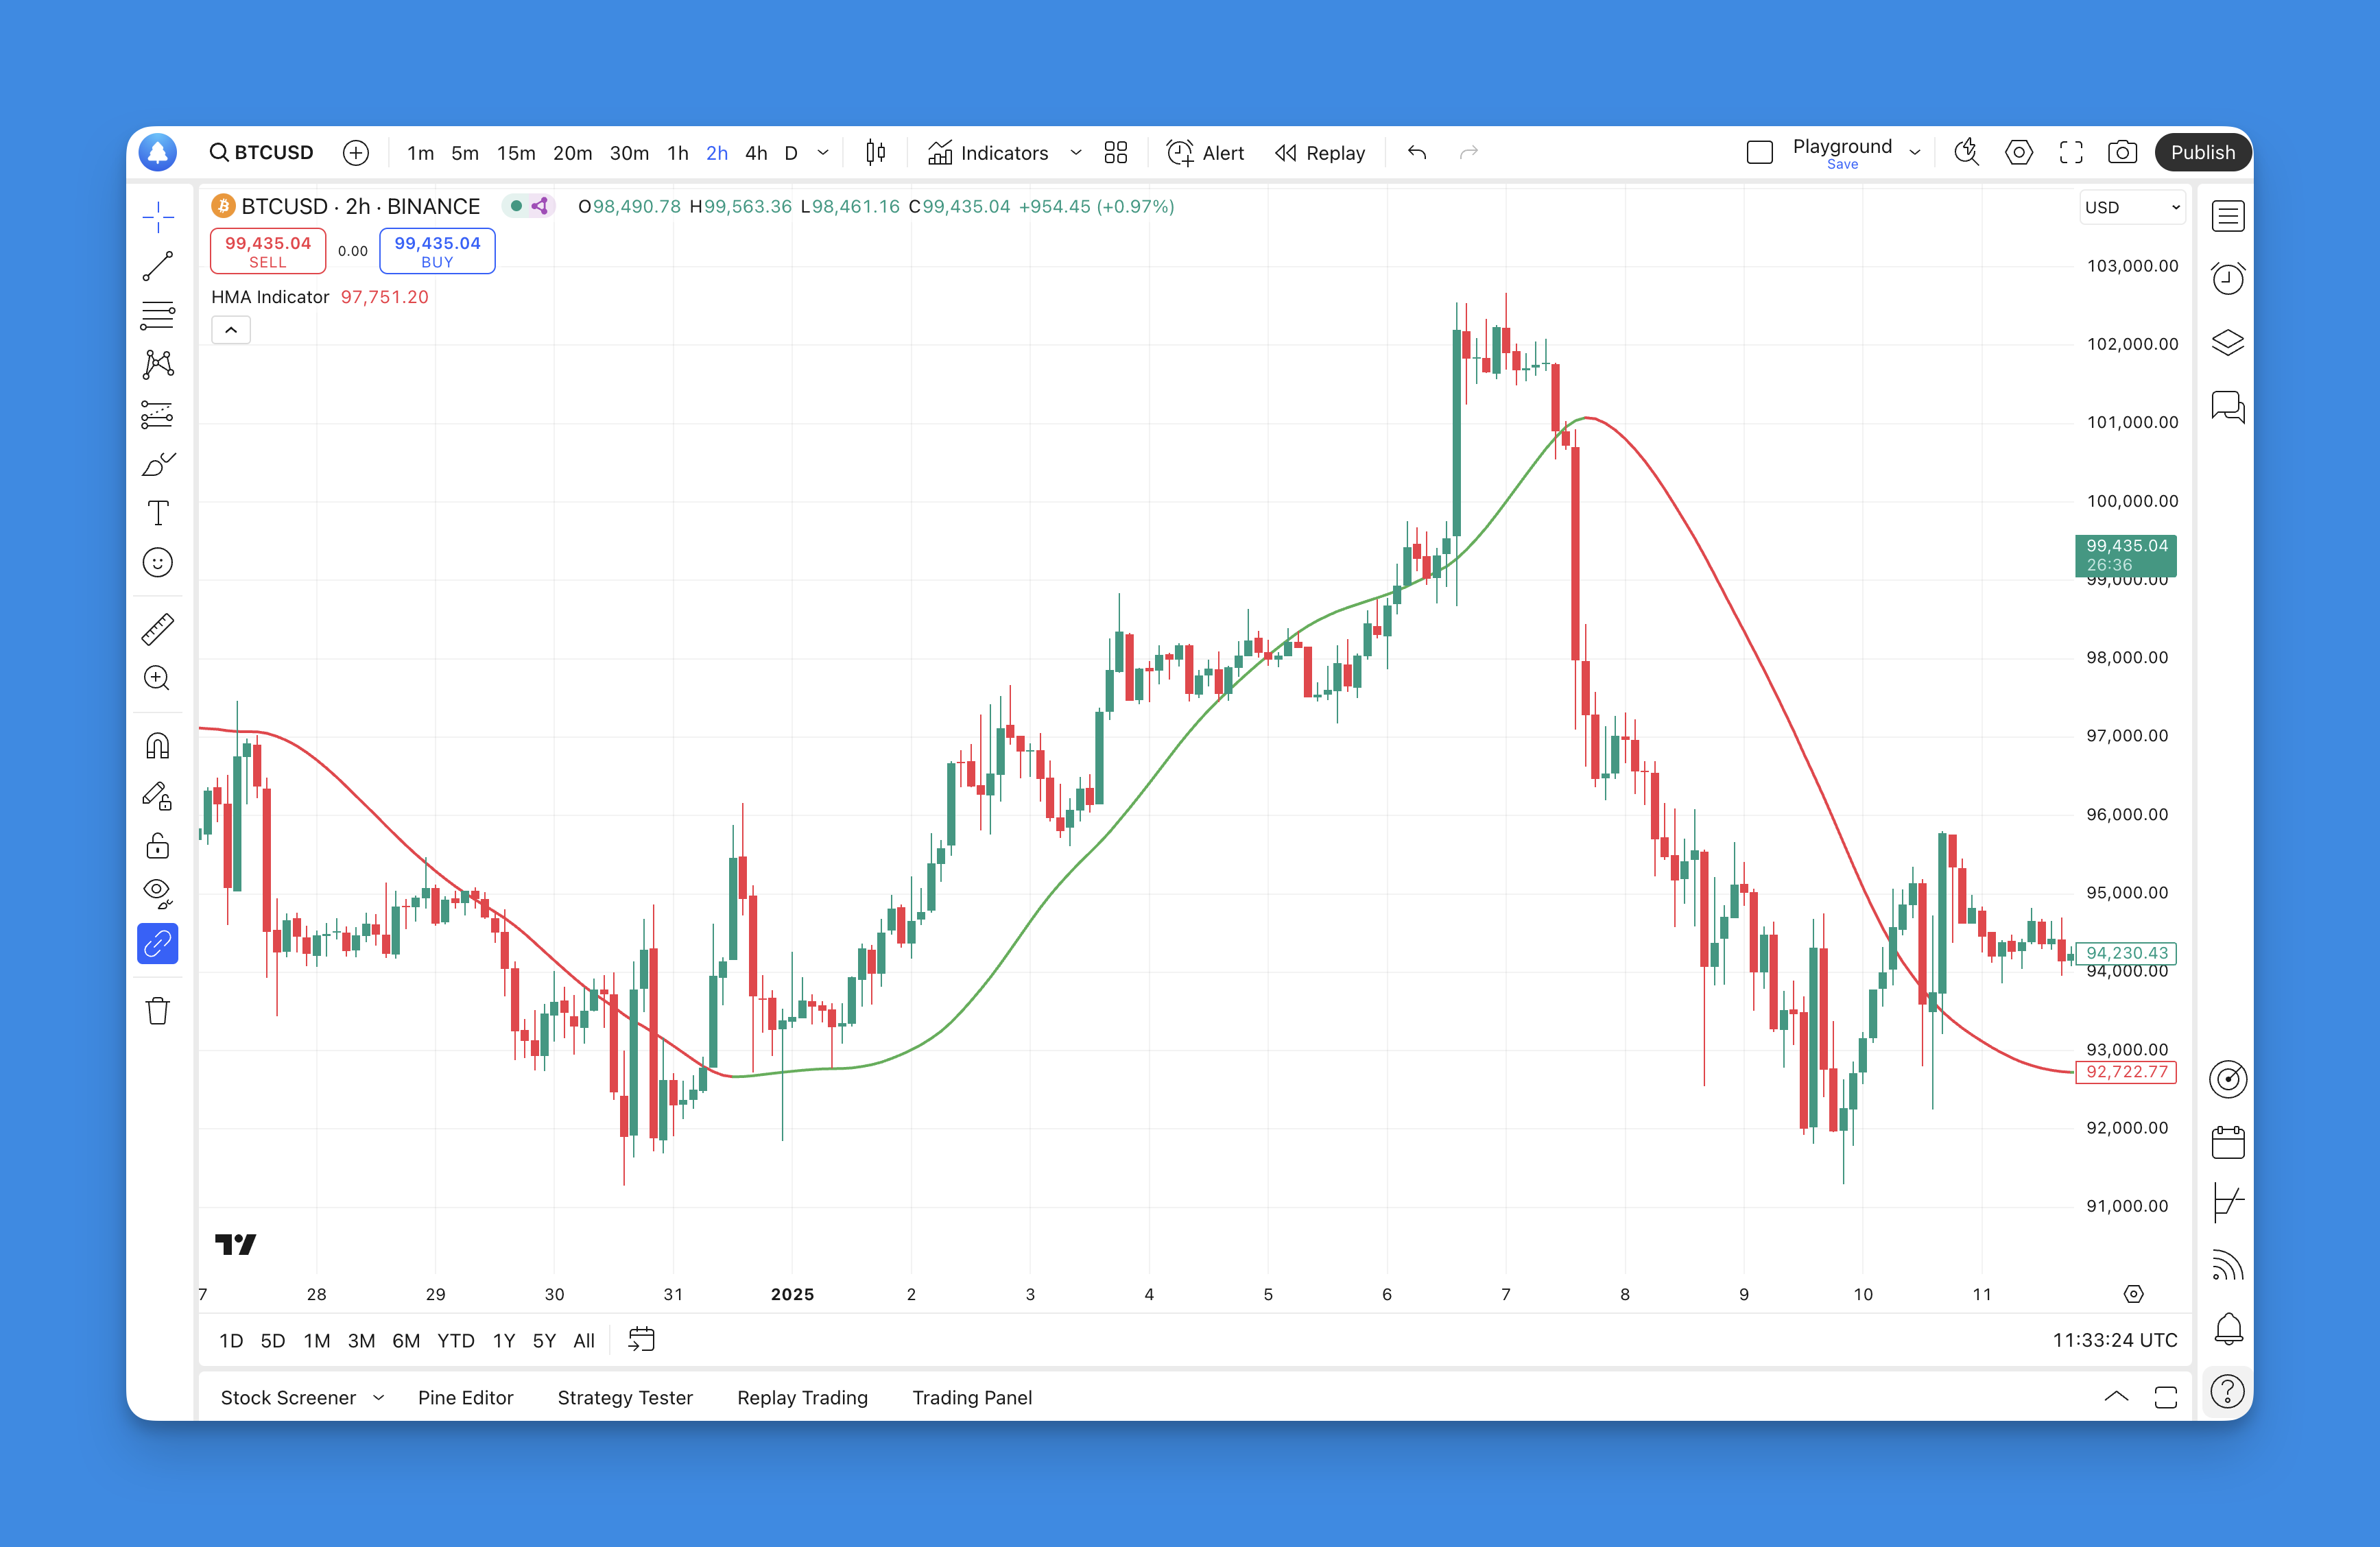
- Trend Identification: The slope of the HMA line indicates the direction of the market trend. A rising HMA suggests an uptrend, while a falling HMA indicates a downtrend. Traders can use this information to align their positions with prevailing market movements.
- Buy and Sell Signals: One of the most straightforward methods for utilizing the HMA is through crossover signals. When the price crosses above the HMA line, it may signal a buying opportunity. Conversely, a price drop below the HMA could indicate a selling opportunity.
- Dynamic Support and Resistance: The HMA can also act as a dynamic support or resistance level. In an uptrend, it may serve as support; in a downtrend, it can act as resistance. Traders often look for price reactions around the HMA line for additional confirmation of their trade setups.
- Combining with Other Indicators: To enhance decision-making, many traders combine the HMA with other technical indicators such as Relative Strength Index (RSI) or Moving Average Convergence Divergence (MACD). This multi-faceted approach helps confirm signals and reduce false positives.
What is TradingView and Pineify?
TradingView is a powerful online platform that allows traders and investors to analyze financial markets using advanced charting tools and a wide range of technical indicators. It is popular among traders for its user-friendly interface and social features that enable sharing insights and strategies.
Within this ecosystem, Pineify emerges as a revolutionary tool designed specifically for TradingView users. Pineify simplifies the process of creating and managing trading indicators and strategies without requiring any coding skills. Users can leverage visual tools to build complex indicators quickly, making it accessible to both novice and experienced traders alike.

Website: Pineify
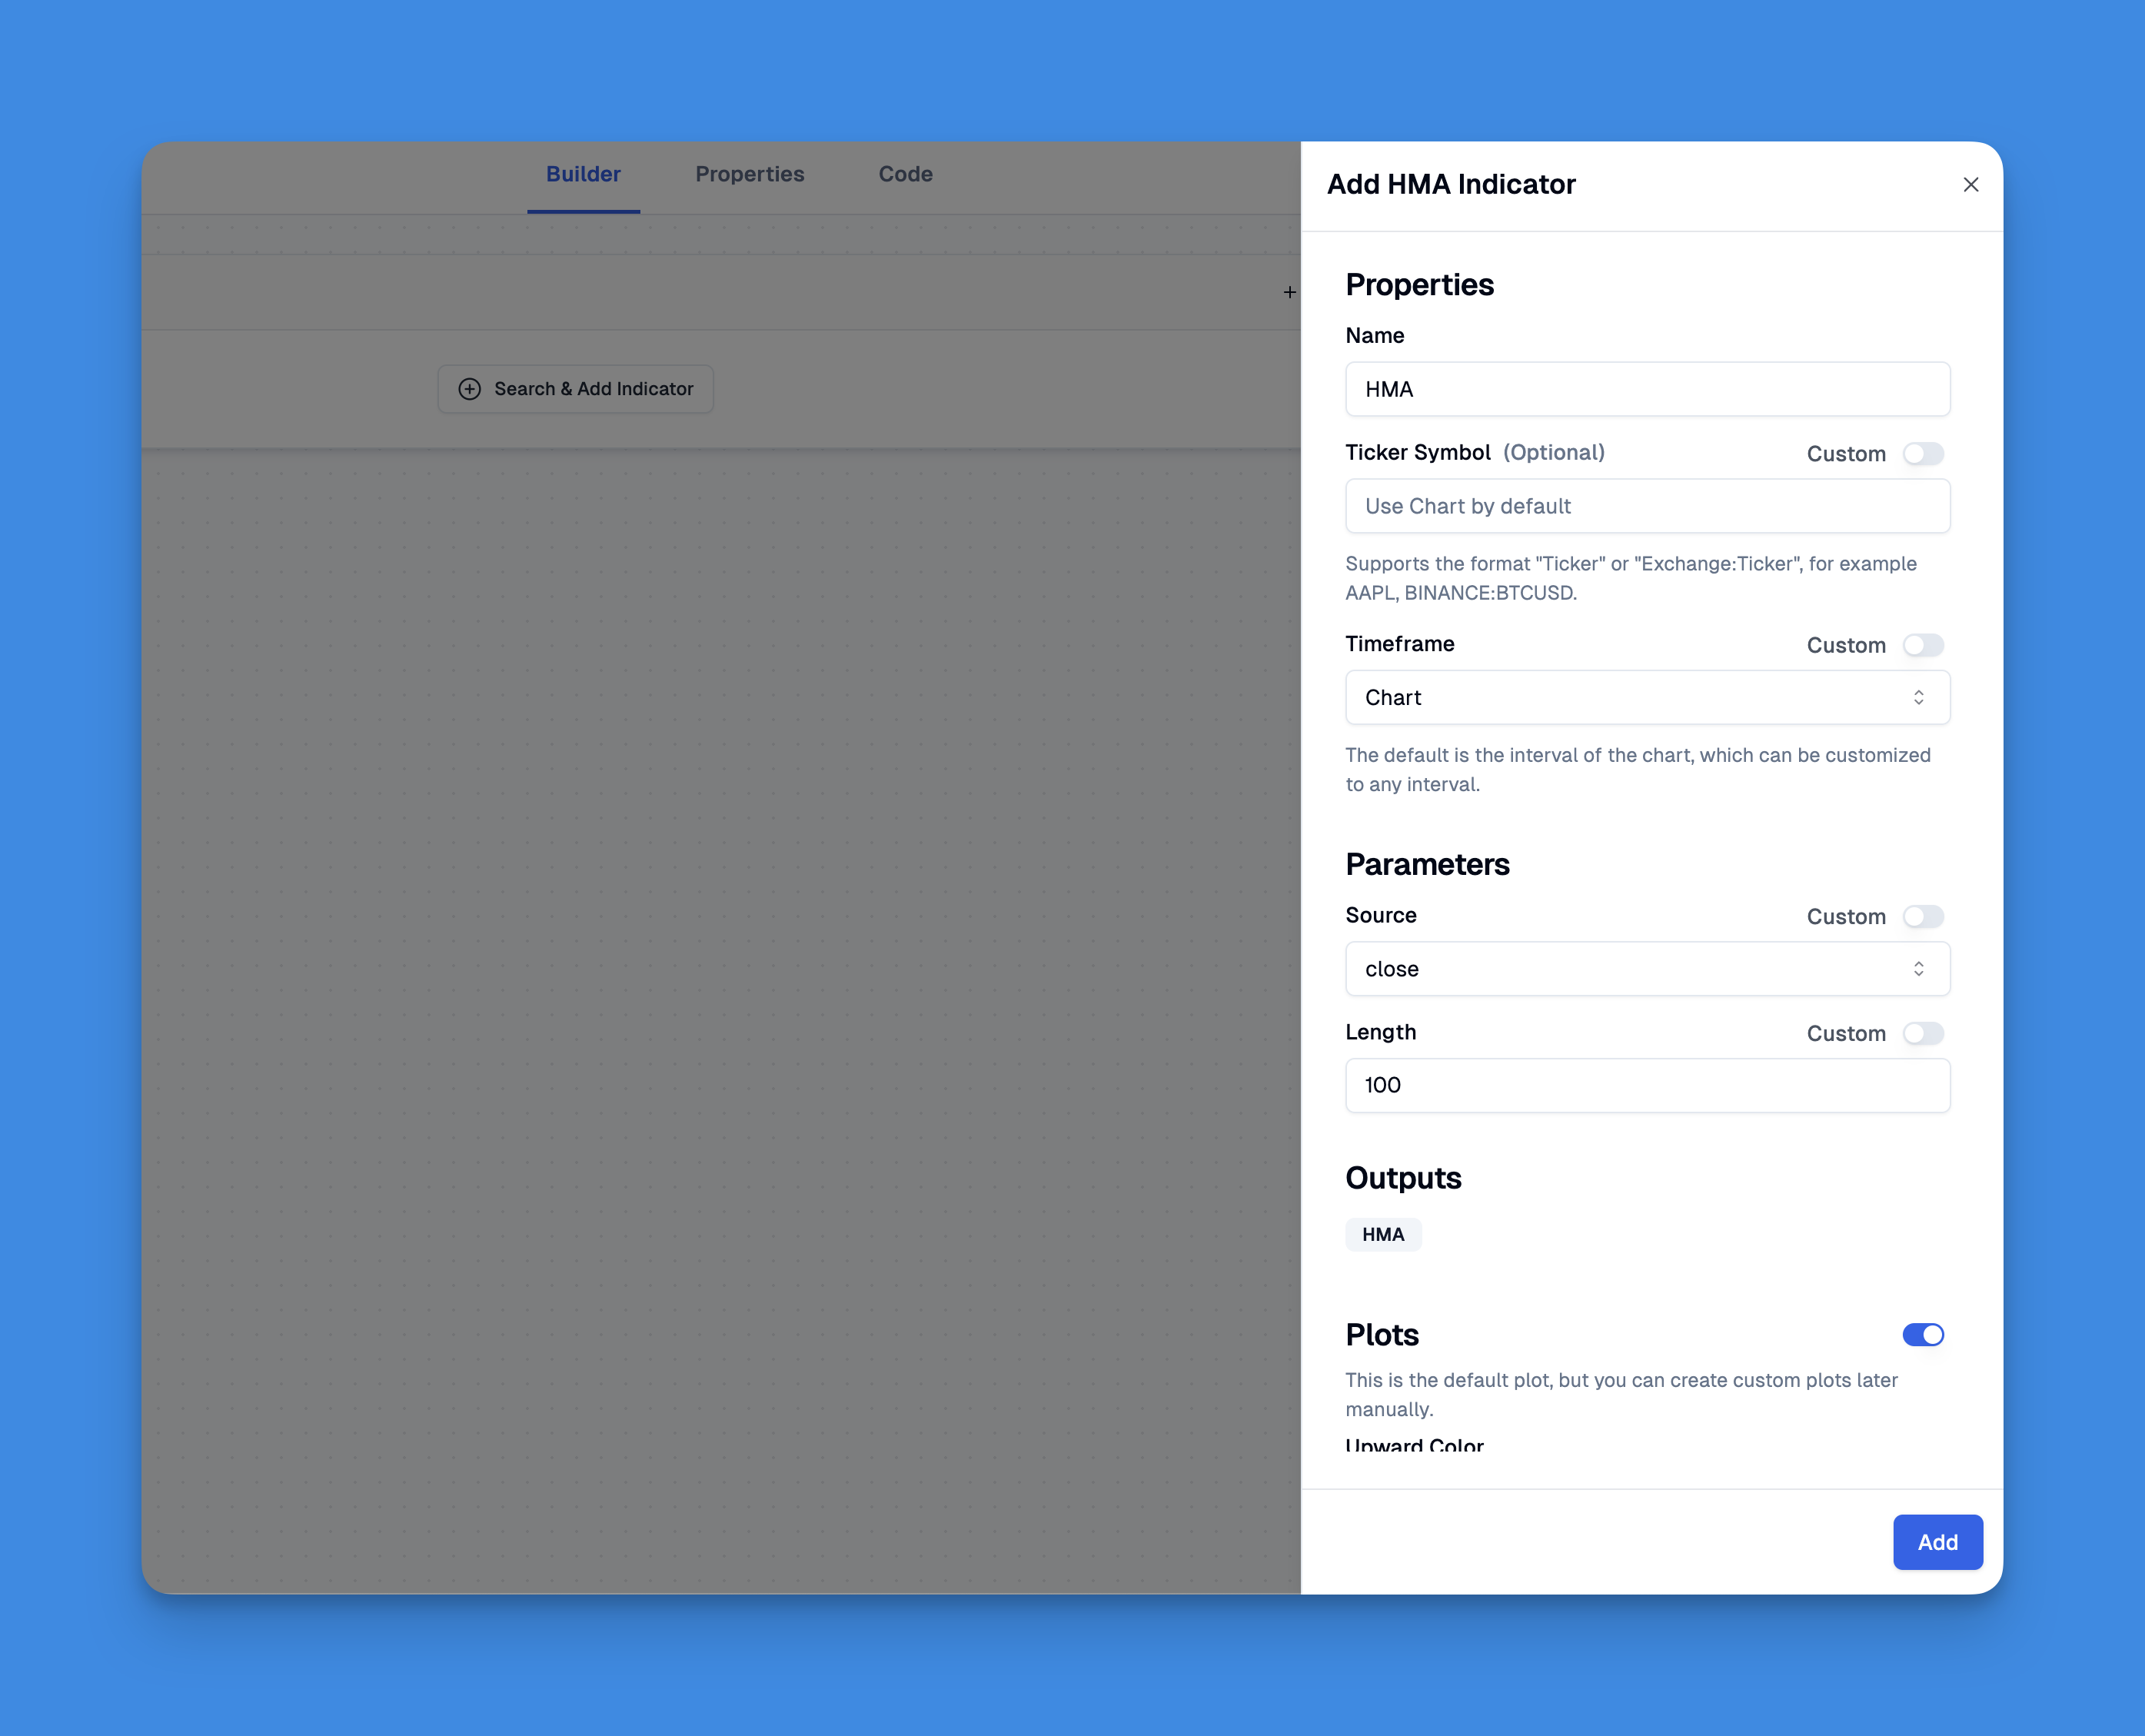
Click here to view all the features of Pineify.Adding the Hull Moving Average to TradingView Chart Without Coding
Integrating the Hull Moving Average (HMA) into your TradingView charts has never been easier, especially with the capabilities provided by Pineify. This tool allows you to bypass the typical limitations of TradingView, such as the restriction on the number of indicators you can add.
Hull Moving Average Pine script
// This source code is subject to the terms of the Mozilla Public License 2.0 at https://mozilla.org/MPL/2.0/
// © Pineify
//======================================================================//
// ____ _ _ __ //
// | _ \(_)_ __ ___(_)/ _|_ _ //
// | |_) | | '_ \ / _ \ | |_| | | | //
// | __/| | | | | __/ | _| |_| | //
// |_| |_|_| |_|\___|_|_| \__, | //
// |___/ //
//======================================================================//
//@version=6
indicator(title="HMA Indicator", overlay=true, max_labels_count=500)
//#region —————————————————————————————————————————————————— Custom Code
//#endregion ————————————————————————————————————————————————————————————
//#region —————————————————————————————————————————————————— Common Dependence
p_comm_time_range_to_unix_time(string time_range, int date_time = time, string timezone = syminfo.timezone) =>
int start_unix_time = na
int end_unix_time = na
int start_time_hour = na
int start_time_minute = na
int end_time_hour = na
int end_time_minute = na
if str.length(time_range) == 11
// Format: hh:mm-hh:mm
start_time_hour := math.floor(str.tonumber(str.substring(time_range, 0, 2)))
start_time_minute := math.floor(str.tonumber(str.substring(time_range, 3, 5)))
end_time_hour := math.floor(str.tonumber(str.substring(time_range, 6, 8)))
end_time_minute := math.floor(str.tonumber(str.substring(time_range, 9, 11)))
else if str.length(time_range) == 9
// Format: hhmm-hhmm
start_time_hour := math.floor(str.tonumber(str.substring(time_range, 0, 2)))
start_time_minute := math.floor(str.tonumber(str.substring(time_range, 2, 4)))
end_time_hour := math.floor(str.tonumber(str.substring(time_range, 5, 7)))
end_time_minute := math.floor(str.tonumber(str.substring(time_range, 7, 9)))
start_unix_time := timestamp(timezone, year(date_time, timezone), month(date_time, timezone), dayofmonth(date_time, timezone), start_time_hour, start_time_minute, 0)
end_unix_time := timestamp(timezone, year(date_time, timezone), month(date_time, timezone), dayofmonth(date_time, timezone), end_time_hour, end_time_minute, 0)
[start_unix_time, end_unix_time]
p_comm_time_range_to_start_unix_time(string time_range, int date_time = time, string timezone = syminfo.timezone) =>
int start_time_hour = na
int start_time_minute = na
if str.length(time_range) == 11
// Format: hh:mm-hh:mm
start_time_hour := math.floor(str.tonumber(str.substring(time_range, 0, 2)))
start_time_minute := math.floor(str.tonumber(str.substring(time_range, 3, 5)))
else if str.length(time_range) == 9
// Format: hhmm-hhmm
start_time_hour := math.floor(str.tonumber(str.substring(time_range, 0, 2)))
start_time_minute := math.floor(str.tonumber(str.substring(time_range, 2, 4)))
timestamp(timezone, year(date_time, timezone), month(date_time, timezone), dayofmonth(date_time, timezone), start_time_hour, start_time_minute, 0)
p_comm_time_range_to_end_unix_time(string time_range, int date_time = time, string timezone = syminfo.timezone) =>
int end_time_hour = na
int end_time_minute = na
if str.length(time_range) == 11
end_time_hour := math.floor(str.tonumber(str.substring(time_range, 6, 8)))
end_time_minute := math.floor(str.tonumber(str.substring(time_range, 9, 11)))
else if str.length(time_range) == 9
end_time_hour := math.floor(str.tonumber(str.substring(time_range, 5, 7)))
end_time_minute := math.floor(str.tonumber(str.substring(time_range, 7, 9)))
timestamp(timezone, year(date_time, timezone), month(date_time, timezone), dayofmonth(date_time, timezone), end_time_hour, end_time_minute, 0)
p_comm_timeframe_to_seconds(simple string tf) =>
float seconds = 0
tf_lower = str.lower(tf)
value = str.tonumber(str.substring(tf_lower, 0, str.length(tf_lower) - 1))
if str.endswith(tf_lower, 's')
seconds := value
else if str.endswith(tf_lower, 'd')
seconds := value * 86400
else if str.endswith(tf_lower, 'w')
seconds := value * 604800
else if str.endswith(tf_lower, 'm')
seconds := value * 2592000
else
seconds := str.tonumber(tf_lower) * 60
seconds
p_custom_sources() =>
[open, high, low, close, volume]
//#endregion —————————————————————————————————————————————————————————————————
//#region —————————————————————————————————————————————————— Ta Dependence
//#endregion —————————————————————————————————————————————————————————————
//#region —————————————————————————————————————————————————— Constants
// Input Groups
string P_GP_1 = ""
//#endregion —————————————————————————————————————————————————————————
//#region —————————————————————————————————————————————————— Inputs
//#endregion ———————————————————————————————————————————————————————
//#region —————————————————————————————————————————————————— Price Data
//#endregion ———————————————————————————————————————————————————————————
//#region —————————————————————————————————————————————————— Indicators
p_ind_1 = ta.hma(close, 100) // HMA
//#endregion ———————————————————————————————————————————————————————————
//#region —————————————————————————————————————————————————— Conditions
//#endregion ———————————————————————————————————————————————————————————
//#region —————————————————————————————————————————————————— Indicator Plots
// HMA
p_ind_1_is_up = p_ind_1 > p_ind_1[1]
plot(p_ind_1, "HMA", p_ind_1_is_up ? color.rgb(76, 175, 80, 0) : color.rgb(242, 54, 69, 0), 2)
//#endregion ————————————————————————————————————————————————————————————————
//#region —————————————————————————————————————————————————— Custom Plots
//#endregion ————��—————————————————————————————————————————————————————————
//#region —————————————————————————————————————————————————— Alert
//#endregion ——————————————————————————————————————————————————————
Advantages of the Hull Moving Average
The Hull Moving Average offers several advantages over traditional moving averages:
- Reduced Lag: The primary benefit of the HMA is its ability to significantly reduce lag compared to Simple Moving Averages (SMA) and Exponential Moving Averages (EMA). This responsiveness allows traders to react more swiftly to price changes.
- Smoother Trends: The HMA provides a smoother representation of price trends, making it easier for traders to identify market direction without being misled by short-term fluctuations.
- Flexibility: The indicator can be adjusted for different time frames and trading styles. This adaptability allows traders to customize their approach based on their individual strategies and market conditions.
- Noise Reduction: By filtering out market noise, the HMA helps traders focus on genuine price movements rather than erratic fluctuations that could lead to poor trading decisions.
Hull Moving Average in Trading Strategies
Incorporating the Hull Moving Average into trading strategies can enhance performance by providing clearer insights into market trends. Here are some common strategies:
- Trend-Following Strategy: Traders can use the HMA to confirm existing trends. For instance, they might enter long positions when the price is above a rising HMA and short positions when below a falling HMA.
- Crossover Strategy: Although Alan Hull himself cautioned against relying solely on crossovers due to potential lag issues, some traders still utilize multiple HMAs (e.g., a short-term and long-term) for crossover signals as part of their strategy.
- Breakout Trading: The HMA can help identify breakout points in volatile markets. When prices break above or below significant levels relative to the HMA, it may indicate strong momentum in that direction.
- Mean Reversion Strategy: In certain contexts, traders may use the HMA to identify overbought or oversold conditions by observing deviations from the average trend line.
Limitations of the Hull Moving Average
Despite its advantages, there are limitations associated with using the Hull Moving Average:
- Complexity: The calculation of the HMA is more complex than that of traditional moving averages. This complexity can be daunting for novice traders who may prefer simpler indicators.
- False Signals in Ranging Markets: Like most trend-following indicators, the HMA may generate false signals during sideways or choppy market conditions where no clear trend exists.
- Sensitivity to Market Noise: While designed to reduce noise, in highly volatile markets, the rapid responsiveness of the HMA can sometimes lead to whipsaws—false breakouts that result in losses.
- Not Foolproof: As with any technical indicator, relying solely on the HMA without considering other factors or indicators can lead to poor trading decisions.
Conclusion
The Hull Moving Average stands out as a powerful tool for traders seeking timely insights into market trends while reducing lag associated with traditional moving averages. By understanding how to effectively use this indicator within various trading strategies—such as trend identification, crossovers, breakout trading, and mean reversion—traders can enhance their decision-making processes.
However, it is crucial for traders to remain aware of its limitations and not rely solely on any single indicator for trading decisions. Instead, integrating multiple tools and conducting thorough analysis will yield better results in navigating complex financial markets.
If you're looking to improve your trading strategy or explore new opportunities in technical analysis, consider incorporating the Hull Moving Average into your toolkit today!