Parabolic SAR (SAR) Pine Script Guide
The Parabolic SAR (Stop and Reverse) indicator is a widely used technical analysis tool that helps traders identify potential trend reversals and manage stop-loss levels. This guide provides a comprehensive overview of the Parabolic SAR, including its implementation in Pine Script, practical applications, and trading strategies.
Key topics covered:
- Understanding the Parabolic SAR indicator
- Implementing SAR in Pine Script
- Trading strategies and best practices
- Advantages and limitations
- Integration with TradingView
What is the Parabolic SAR?
The Parabolic SAR (Stop and Reverse) is a technical analysis indicator developed by J. Welles Wilder to identify potential reversals in price movements of traded assets. It is primarily used in trending markets to determine the direction of an asset's momentum and provide signals for entry and exit points.
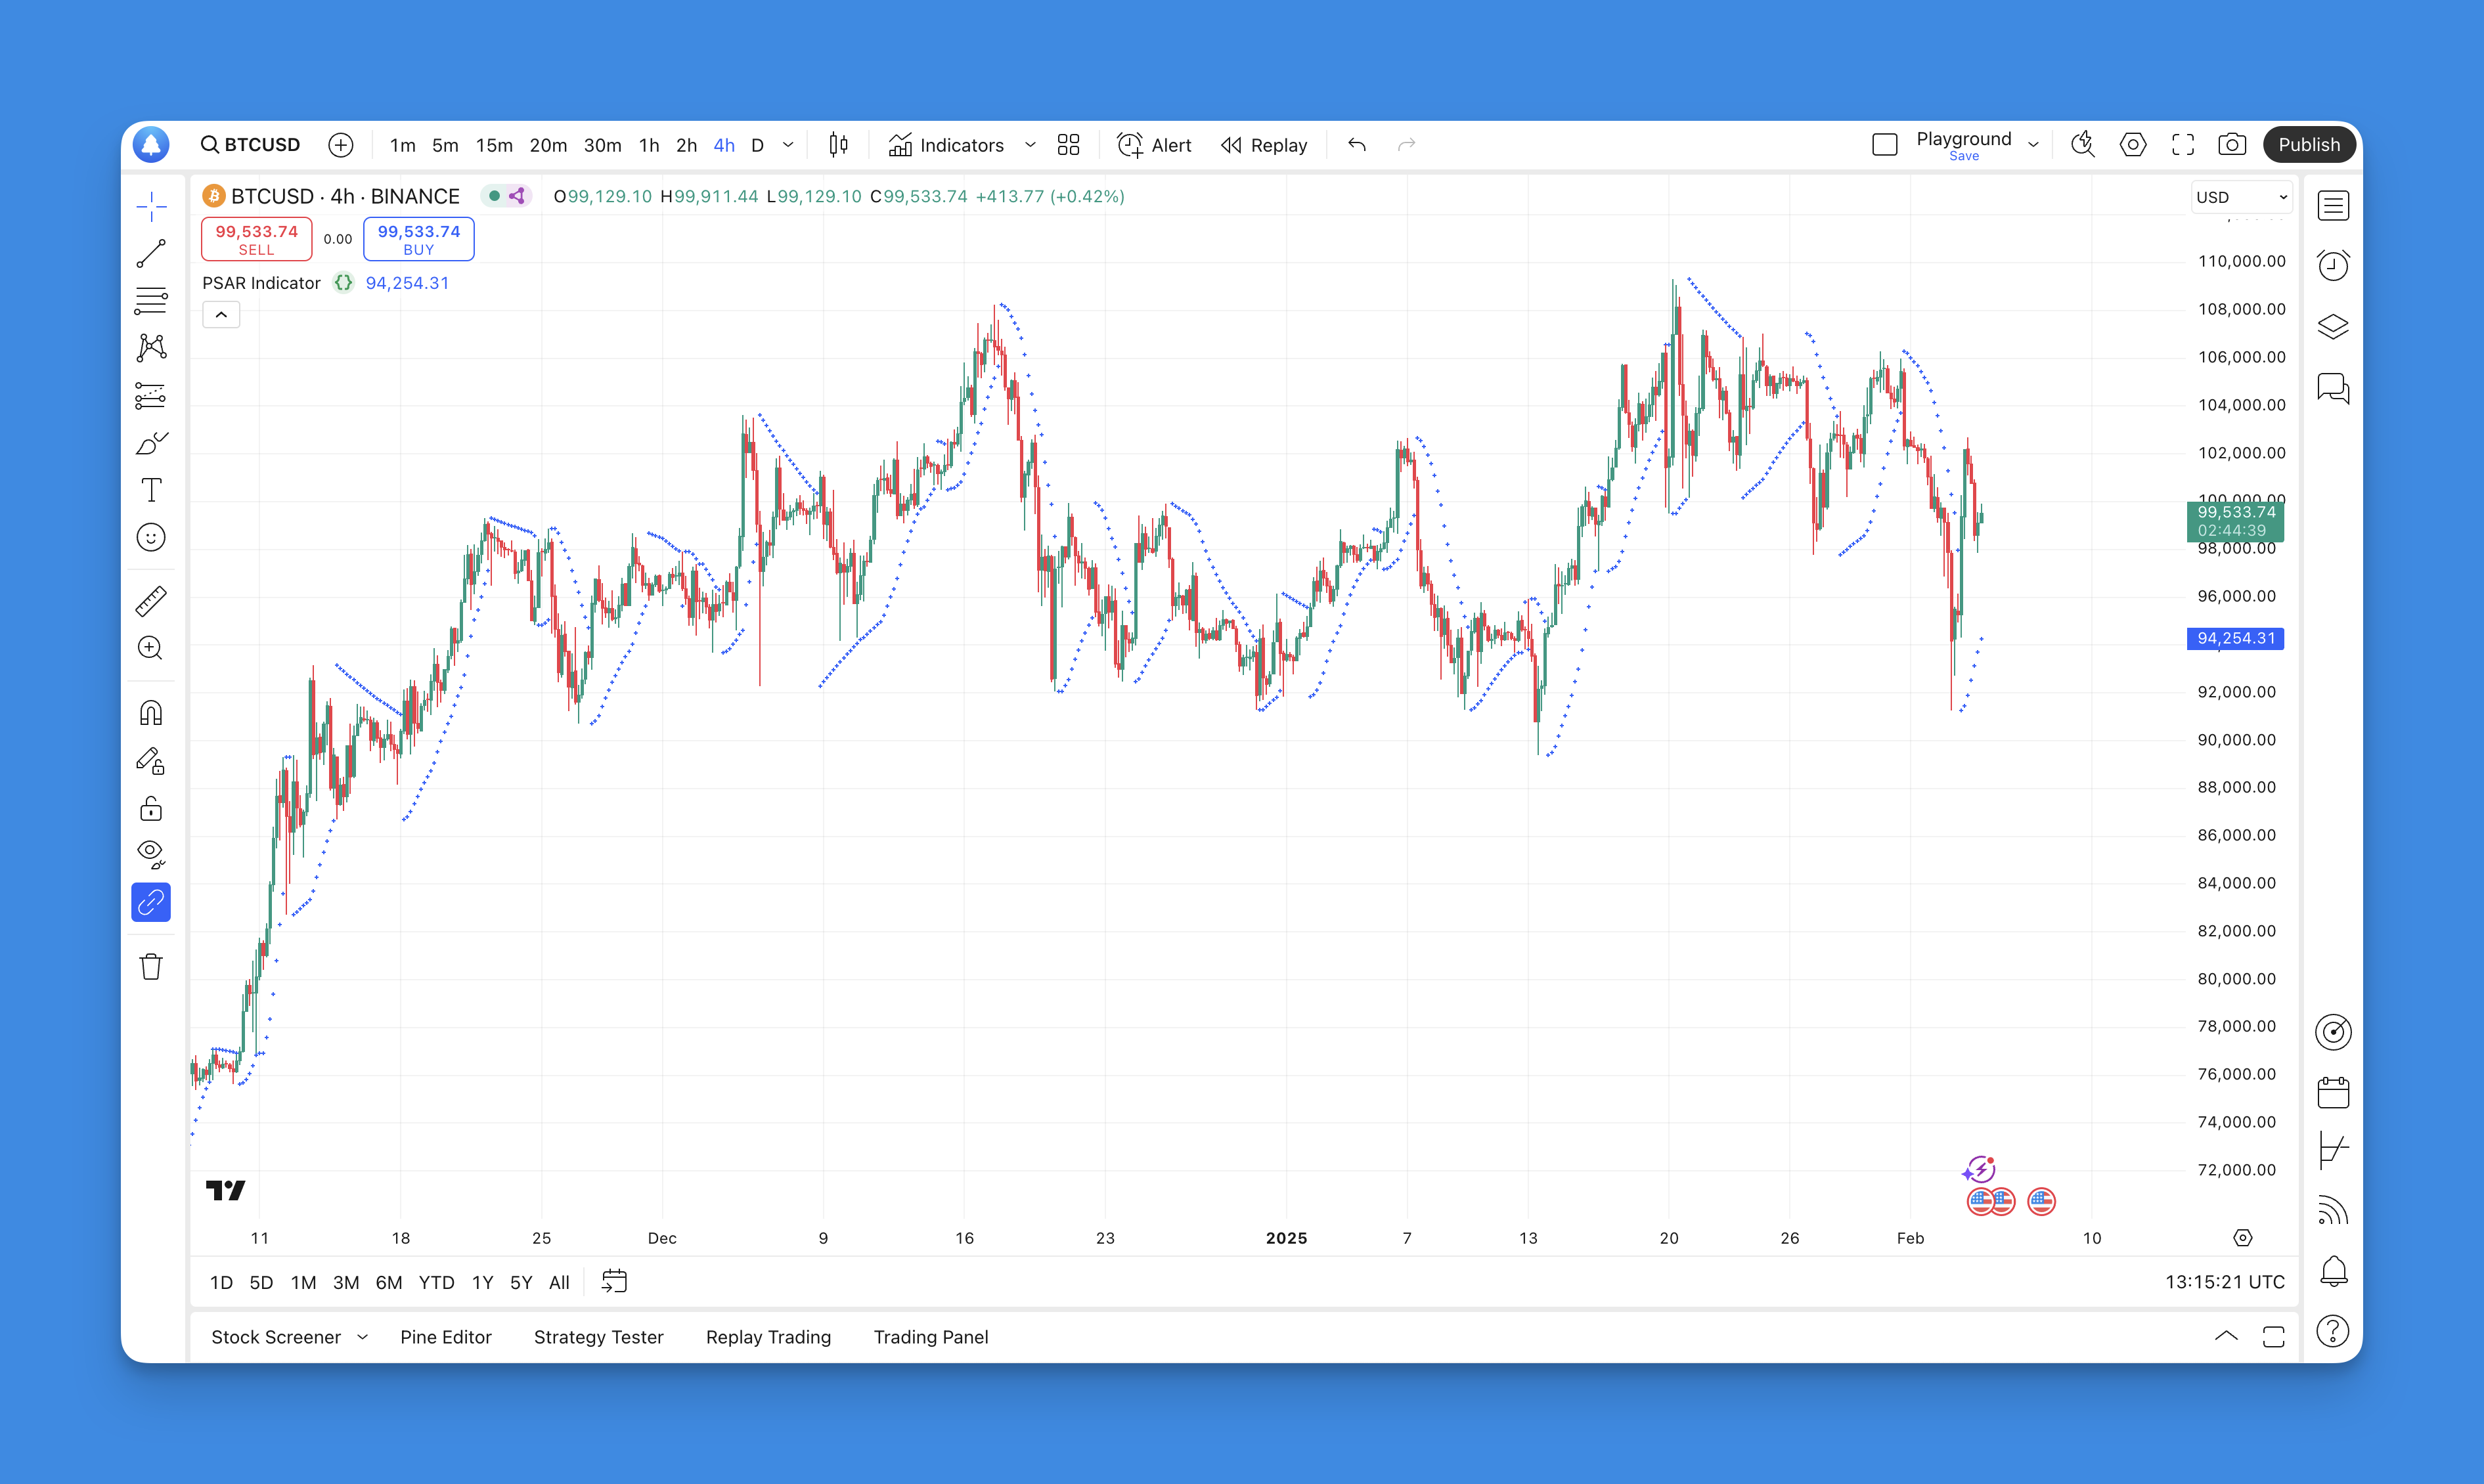
The indicator is represented visually on a chart as a series of dots that appear either above or below the price bars. When the dots are positioned below the price, it indicates a bullish trend, suggesting that traders may consider entering long positions. Conversely, when the dots are above the price, it signals a bearish trend, indicating potential short positions.
How to Use Parabolic SAR Indicator

Using the Parabolic SAR effectively requires understanding its signals and how to integrate them into trading strategies:
- Identifying Trends: The primary function of the Parabolic SAR is to identify whether an asset is in an uptrend or downtrend. Traders should look for the placement of dots relative to price bars.
- Entry and Exit Points: A buy signal occurs when the dots move from above to below the price, indicating a potential upward reversal. Conversely, a sell signal happens when the dots switch from below to above, suggesting a downward reversal.
- Setting Stop-Loss Orders: Traders can use the Parabolic SAR as a dynamic stop-loss tool. For long positions, stop-loss orders can be placed just below the latest dot; for short positions, they can be set just above.
- Combining with Other Indicators: To enhance accuracy, traders often use the Parabolic SAR alongside other indicators like moving averages or RSI (Relative Strength Index). This helps confirm signals and filter out false positives.
What is TradingView and Pineify?
TradingView is a leading charting platform that provides traders and investors with powerful tools for market analysis and strategy development. With over 50 million users, it combines advanced charting features, a wide array of technical indicators, and a robust social networking aspect, allowing users to share insights and strategies.
Pineify is an innovative tool designed specifically for TradingView users who may not have coding skills. It empowers traders to create and optimize their own indicators and strategies without needing to write code.

Website: Pineify
Click here to view all the features of Pineify.Adding the Parabolic SAR to TradingView Chart Without Coding
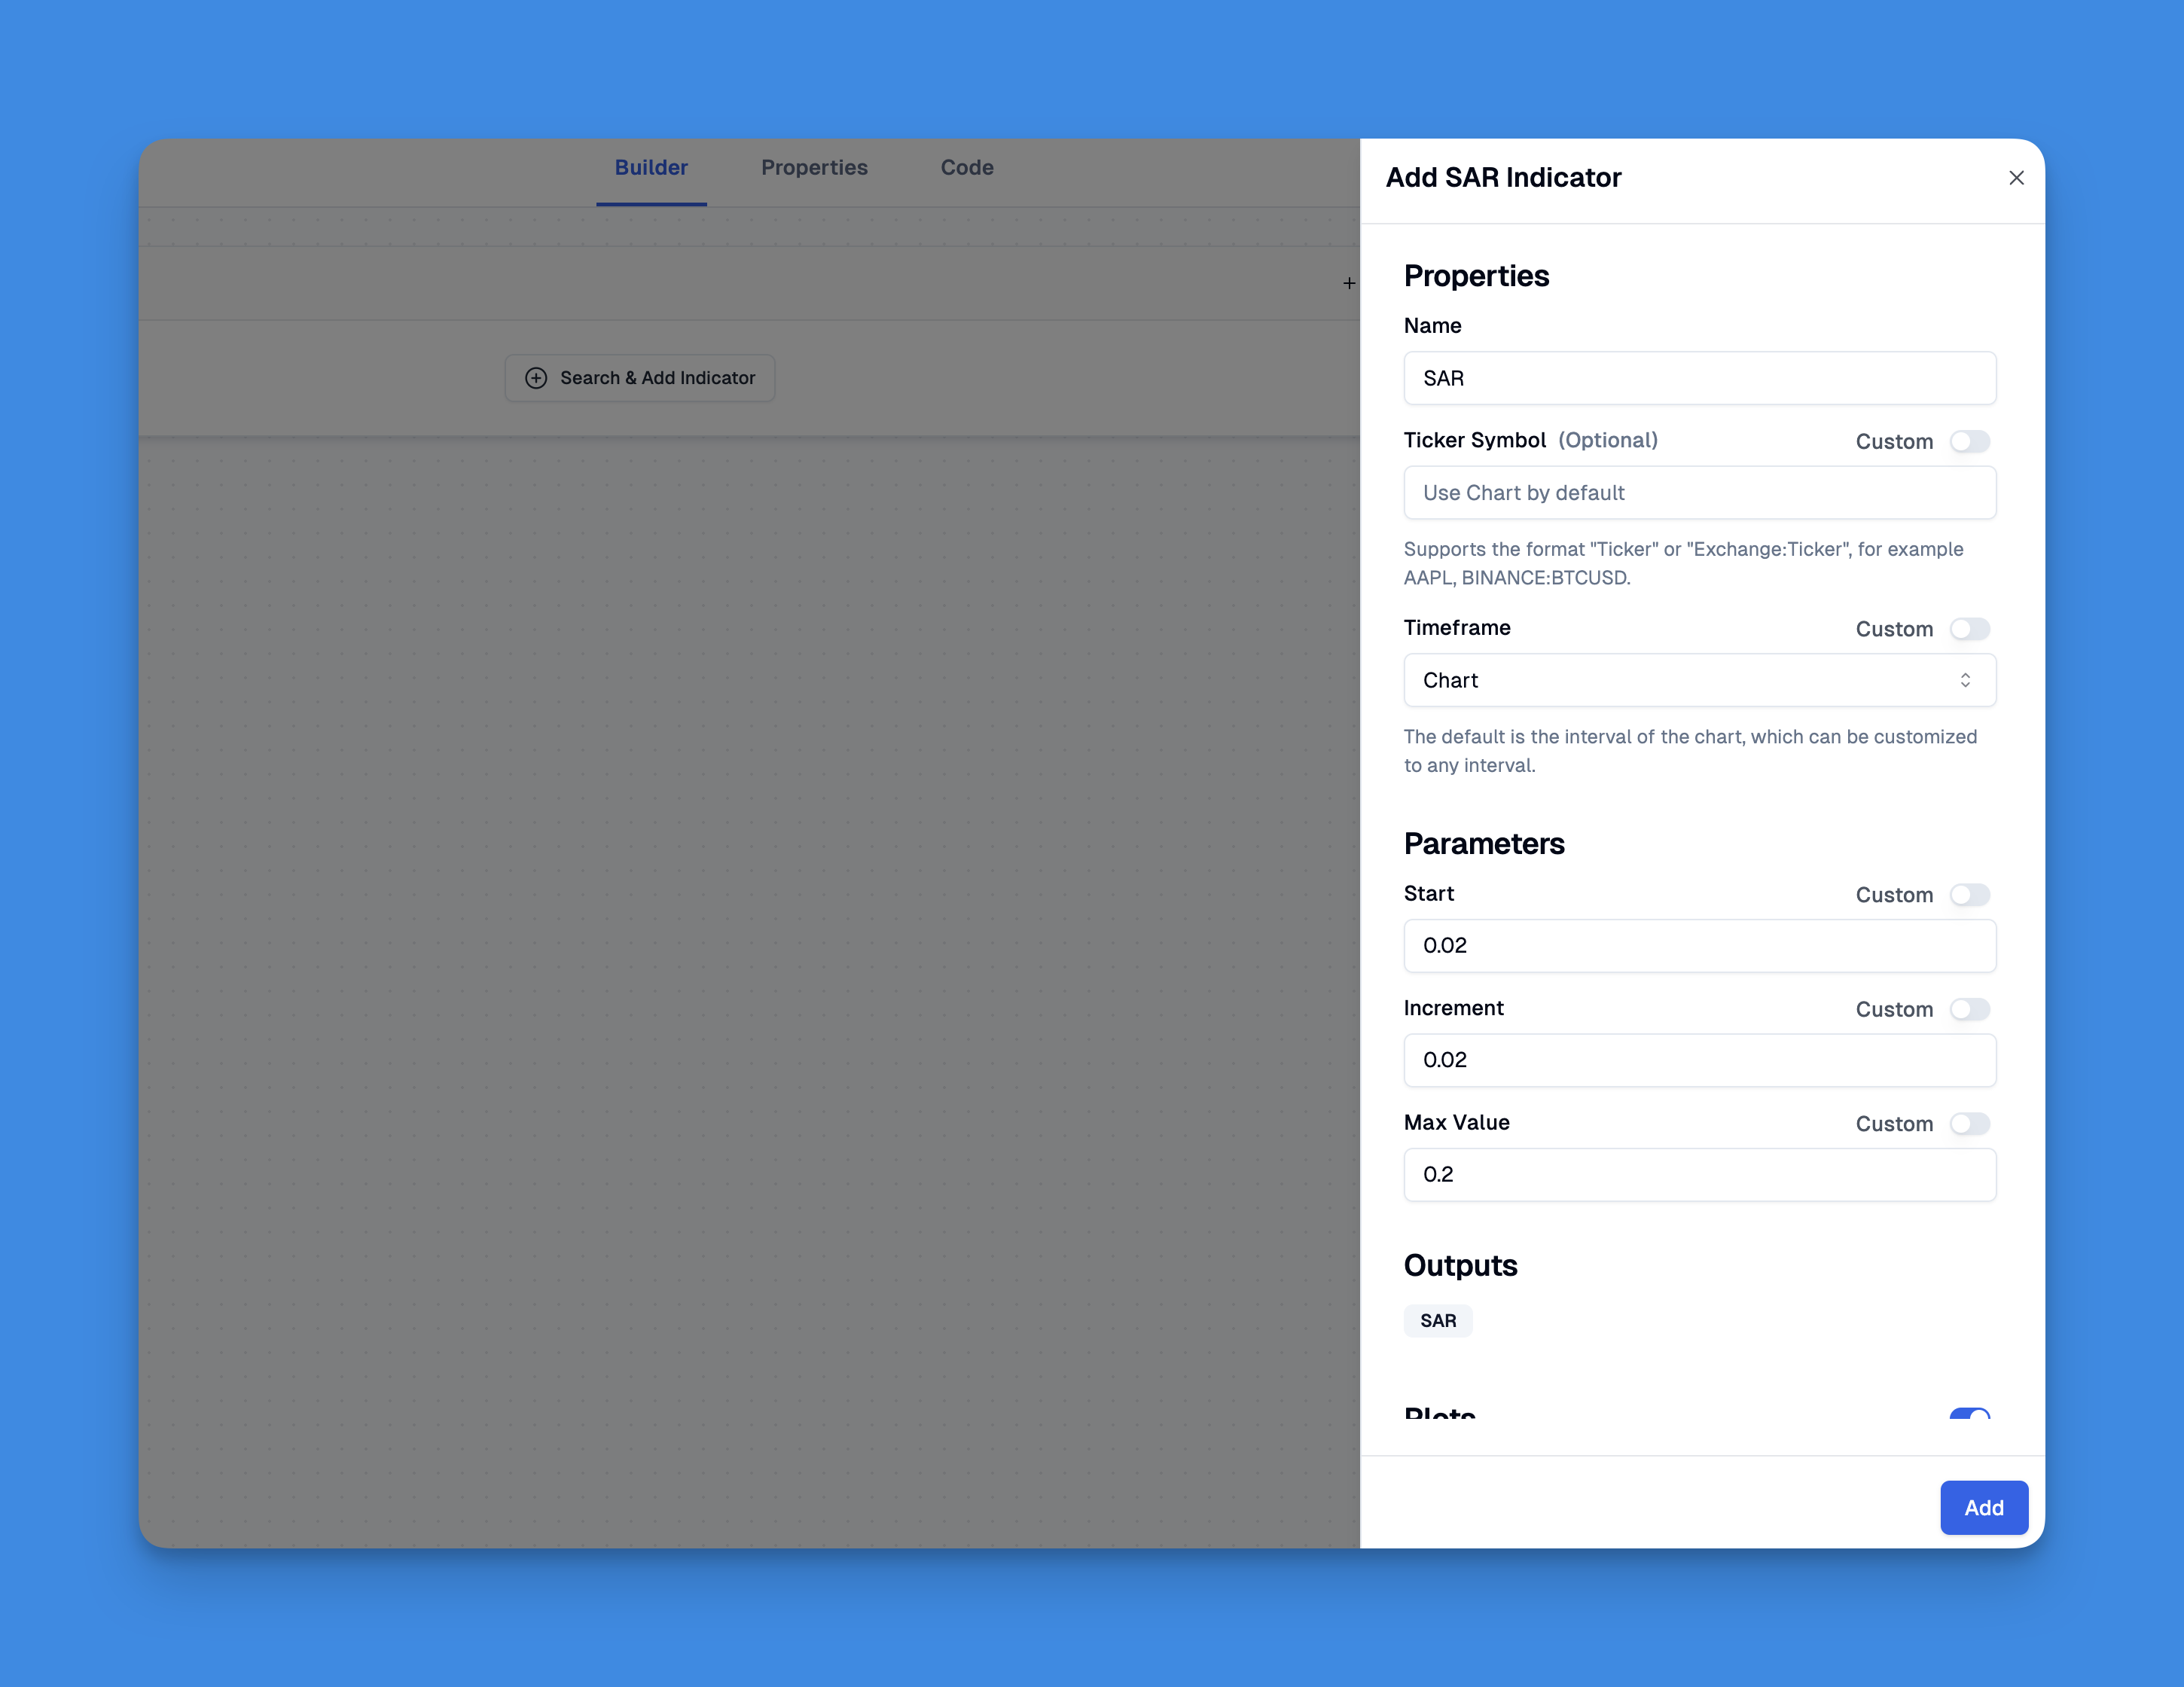
To add the Parabolic SAR (Stop and Reverse) indicator to your TradingView chart without coding, you can utilize Pineify's user-friendly features.
With Pineify, you can also combine multiple indicators into one, enhancing your analytical capabilities while maintaining clarity on your charts. This approach not only simplifies the process of adding indicators but also enhances your ability to make informed trading decisions based on comprehensive data analysis.
Parabolic SAR (SAR) Pine Script Code
// This source code is subject to the terms of the Mozilla Public License 2.0 at https://mozilla.org/MPL/2.0/
// © Pineify

//======================================================================//
//                    ____  _            _  __                          //
//                   |  _ \(_)_ __   ___(_)/ _|_   _                    //
//                   | |_) | | '_ \ / _ \ | |_| | | |                   //
//                   |  __/| | | | |  __/ |  _| |_| |                   //
//                   |_|   |_|_| |_|\___|_|_|  \__, |                   //
//                                             |___/                    //
//======================================================================//

//@version=6
indicator(title="PSAR Indicator", overlay=true, max_labels_count=500)

//#region —————————————————————————————————————————————————— Custom Code

//#endregion ————————————————————————————————————————————————————————————


//#region —————————————————————————————————————————————————— Common Dependence

p_comm_time_range_to_unix_time(string time_range, int date_time = time, string timezone = syminfo.timezone) =>
    int start_unix_time = na
    int end_unix_time = na
    int start_time_hour = na
    int start_time_minute = na
    int end_time_hour = na
    int end_time_minute = na
    if str.length(time_range) == 11
        // Format: hh:mm-hh:mm
        start_time_hour := math.floor(str.tonumber(str.substring(time_range, 0, 2)))
        start_time_minute := math.floor(str.tonumber(str.substring(time_range, 3, 5)))
        end_time_hour := math.floor(str.tonumber(str.substring(time_range, 6, 8)))
        end_time_minute := math.floor(str.tonumber(str.substring(time_range, 9, 11)))
    else if str.length(time_range) == 9
        // Format: hhmm-hhmm
        start_time_hour := math.floor(str.tonumber(str.substring(time_range, 0, 2)))
        start_time_minute := math.floor(str.tonumber(str.substring(time_range, 2, 4)))
        end_time_hour := math.floor(str.tonumber(str.substring(time_range, 5, 7)))
        end_time_minute := math.floor(str.tonumber(str.substring(time_range, 7, 9)))
    start_unix_time := timestamp(timezone, year(date_time, timezone), month(date_time, timezone), dayofmonth(date_time, timezone), start_time_hour, start_time_minute, 0)
    end_unix_time := timestamp(timezone, year(date_time, timezone), month(date_time, timezone), dayofmonth(date_time, timezone), end_time_hour, end_time_minute, 0)
    [start_unix_time, end_unix_time]

p_comm_time_range_to_start_unix_time(string time_range, int date_time = time, string timezone = syminfo.timezone) =>
    int start_time_hour = na
    int start_time_minute = na
    if str.length(time_range) == 11
        // Format: hh:mm-hh:mm
        start_time_hour := math.floor(str.tonumber(str.substring(time_range, 0, 2)))
        start_time_minute := math.floor(str.tonumber(str.substring(time_range, 3, 5)))
    else if str.length(time_range) == 9
        // Format: hhmm-hhmm
        start_time_hour := math.floor(str.tonumber(str.substring(time_range, 0, 2)))
        start_time_minute := math.floor(str.tonumber(str.substring(time_range, 2, 4)))
    timestamp(timezone, year(date_time, timezone), month(date_time, timezone), dayofmonth(date_time, timezone), start_time_hour, start_time_minute, 0)

p_comm_time_range_to_end_unix_time(string time_range, int date_time = time, string timezone = syminfo.timezone) =>
    int end_time_hour = na
    int end_time_minute = na
    if str.length(time_range) == 11
        end_time_hour := math.floor(str.tonumber(str.substring(time_range, 6, 8)))
        end_time_minute := math.floor(str.tonumber(str.substring(time_range, 9, 11)))
    else if str.length(time_range) == 9
        end_time_hour := math.floor(str.tonumber(str.substring(time_range, 5, 7)))
        end_time_minute := math.floor(str.tonumber(str.substring(time_range, 7, 9)))
    timestamp(timezone, year(date_time, timezone), month(date_time, timezone), dayofmonth(date_time, timezone), end_time_hour, end_time_minute, 0)

p_comm_timeframe_to_seconds(simple string tf) =>
    float seconds = 0
    tf_lower = str.lower(tf)
    value = str.tonumber(str.substring(tf_lower, 0, str.length(tf_lower) - 1))
    if str.endswith(tf_lower, 's')
        seconds := value
    else if str.endswith(tf_lower, 'd')
        seconds := value * 86400
    else if str.endswith(tf_lower, 'w')
        seconds := value * 604800
    else if str.endswith(tf_lower, 'm')
        seconds := value * 2592000
    else
        seconds := str.tonumber(tf_lower) * 60
    seconds

p_custom_sources() =>
    [open, high, low, close, volume]

//#endregion —————————————————————————————————————————————————————————————————


//#region —————————————————————————————————————————————————— Ta Dependence


//#endregion —————————————————————————————————————————————————————————————


//#region —————————————————————————————————————————————————— Constants

// Input Groups
string P_GP_1      =      ""

//#endregion —————————————————————————————————————————————————————————


//#region —————————————————————————————————————————————————— Inputs

//#endregion ———————————————————————————————————————————————————————


//#region —————————————————————————————————————————————————— Price Data


//#endregion ———————————————————————————————————————————————————————————


//#region —————————————————————————————————————————————————— Indicators

p_ind_1      =      ta.sar(0.02, 0.02, 0.2) // SAR


//#endregion ———————————————————————————————————————————————————————————


//#region —————————————————————————————————————————————————— Conditions

//#endregion ———————————————————————————————————————————————————————————


//#region —————————————————————————————————————————————————— Indicator Plots

// SAR
plot(p_ind_1, "SAR", color.rgb(41, 98, 255, 0), 1, style=plot.style_cross)

//#endregion ————————————————————————————————————————————————————————————————


//#region —————————————————————————————————————————————————— Custom Plots

//#endregion —————————————————————————————————————————————————————————————


//#region —————————————————————————————————————————————————— Alert

//#endregion ——————————————————————————————————————————————————————
Advantages of the Parabolic SAR
The Parabolic SAR offers several benefits that make it a popular choice among traders:
- Clear Signals: The indicator provides straightforward visual cues for identifying trends and potential reversals, making it easy for traders to make informed decisions.
- Dynamic Stop-Loss Management: As trends develop, traders can adjust their stop-loss levels in real-time based on the movement of the SAR dots, helping to lock in profits while minimizing losses.
- Versatility: The Parabolic SAR can be applied across various timeframes and asset classes, making it suitable for different trading styles, including day trading and swing trading.
- Objective Criteria: The indicator eliminates emotional bias by providing objective criteria for trade entries and exits based solely on price action.
Parabolic SAR in Trading Strategies
Incorporating the Parabolic SAR into trading strategies can enhance performance. Here are some effective approaches:
- Single Timeframe Strategy: Traders can use a single timeframe chart with Parabolic SAR to identify trends. For instance, if the indicator shows bullish signals on a 1-hour chart, traders may look for long opportunities.
- Double Timeframe Strategy: This involves analyzing two different timeframes. For example, using a daily chart to identify long-term trends while executing trades based on signals from an hourly chart can improve accuracy.
- Combining with Moving Averages: Using moving averages alongside the Parabolic SAR can strengthen signals. For example, entering long positions when both indicators align in a bullish trend enhances confidence in trade decisions.
Limitations of the Parabolic SAR
While useful, the Parabolic SAR has limitations that traders should consider:
- Lagging Indicator: As a lagging indicator, it reacts to past price movements. This means it may provide late signals during rapid market changes, potentially causing missed opportunities.
- Sensitivity to Volatility: In highly volatile markets or sideways conditions, it can generate false signals or whipsaws, leading to unnecessary trades and losses.
- Limited Customization: While traders can adjust parameters like acceleration factors, these adjustments may not suit all market conditions or assets equally well.
- Not Ideal for Range-Bound Markets: The Parabolic SAR is designed for trending markets; therefore, it may produce frequent false signals during consolidation phases.
Conclusion
The Parabolic SAR is a powerful tool for traders looking to identify trends and potential reversals in price movements. By understanding how to use this indicator effectively—recognizing its advantages and limitations—traders can enhance their decision-making process and improve their overall trading strategies.