35 posts tagged with "TradingView"

Blog posts related to the TradingView

View All Tags

Mastering Pine Script RSI for Trading Success

· 4 min read

The Relative Strength Index (RSI) is a popular momentum oscillator used in technical analysis to measure the speed and change of price movements. This article will delve into the intricacies of coding the RSI in Pine Script, a domain-specific language for TradingView, and how to effectively utilize it for trading strategies.

Pine Script RSI

QQE Indicator: A Comprehensive Trading Guide

· 5 min read

The Quantitative Qualitative Estimation (QQE) indicator is a powerful tool used in technical analysis to help traders identify market trends, overbought and oversold conditions, and potential entry and exit points. This article will delve into the intricacies of the QQE indicator, its applications in trading, and how it compares to other popular indicators like the Relative Strength Index (RSI).

QQE Indicator

Pine Script Supertrend: A Guide to Trend-Following Strategies

· 4 min read

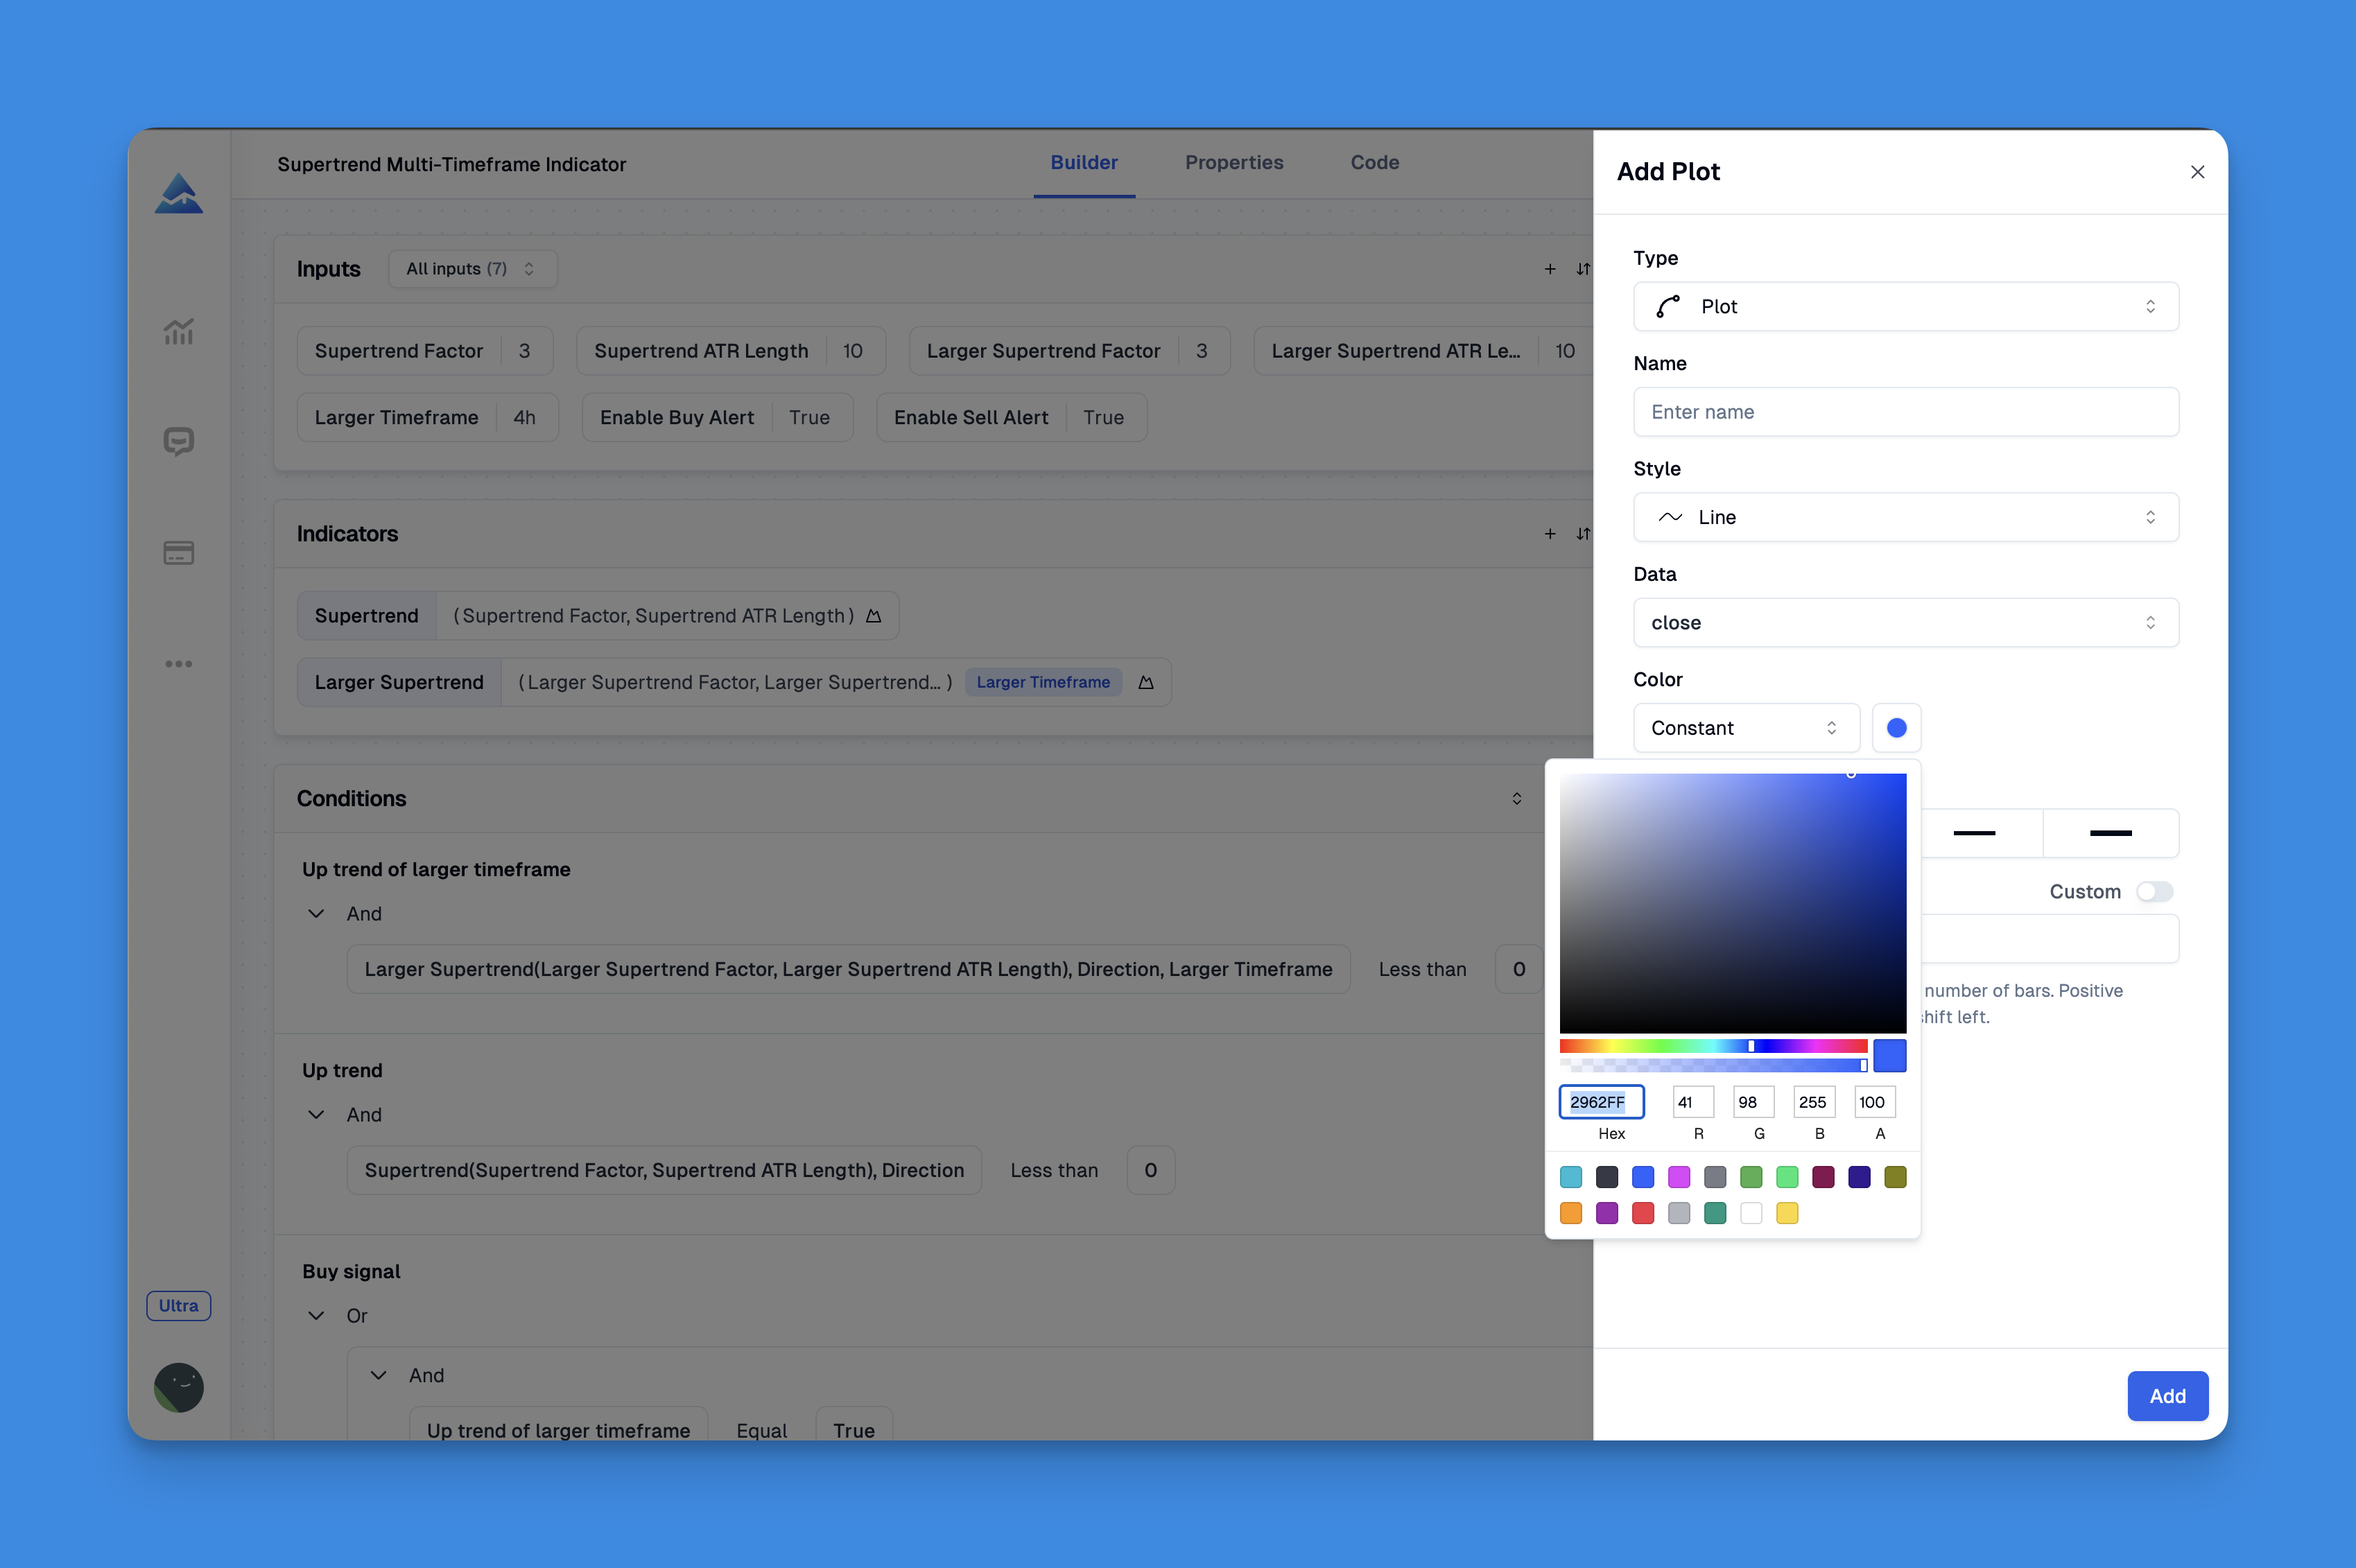
The Supertrend indicator is a popular tool among traders for identifying market trends and potential entry and exit points.

This article delves into the intricacies of the Pine Script Supertrend, providing a detailed overview, practical applications, and tips for implementation. By the end, you will have a solid understanding of how to leverage this powerful trading strategy effectively.

Supertrend Indicator

SMA Pine Script: Plot Moving Averages Easily

· 6 min read

The Simple Moving Average (SMA) is a fundamental concept in technical analysis, widely used by traders to smooth out price data and identify trends over a specified period. In the context of Pine Script, TradingView's unique scripting language, the SMA can be easily calculated and plotted on charts, making it an essential tool for traders. This article will delve into the intricacies of implementing SMA in Pine Script, covering everything from basic syntax to advanced strategies.

SMA Pine Script

EMA Pine Script: Customization for Effective Trading

· 7 min read

The Exponential Moving Average (EMA) is a vital tool in the arsenal of traders, providing insights into price trends and potential market reversals. This article delves into the intricacies of EMA in Pine Script, a powerful scripting language used on TradingView. We will explore how to implement EMAs, create custom indicators, and develop trading strategies.

Exponential Moving Average (EMA) Indicator

DIY Custom Strategy Builder vs Pineify: Key Features & Benefits

· 4 min read

In the ever-evolving landscape of trading, having the right tools to build and manage strategies can significantly impact a trader's success. Two popular options are the DIY Custom Strategy Builder and Pineify. This article delves into both tools, comparing their features, benefits, and usability, ultimately highlighting why Pineify stands out as the best Pine Script AI generation tool.

[Pineify | Best Pine Script Editor]

BBTrend Indicator Guide: Enhance Your Trading Strategy

· 5 min read

The BBTrend Indicator, developed by the renowned technical analyst John Bollinger, is a powerful tool designed to enhance trading strategies by providing insights into market trends. This article will explore the intricacies of the BBTrend Indicator, its calculations, applications, and how traders can effectively integrate it into their trading strategies.

[Pineify - Best Pine Script Generator] - BBTrend Indicator

Mastering ATR in Pine Script for Trading Success

· 5 min read

The Average True Range (ATR) is a vital technical analysis tool used by traders to measure market volatility. In this article, we will explore how to implement the ATR indicator using Pine Script, a domain-specific language for coding custom indicators and strategies on TradingView. We will delve into the syntax, practical applications, and provide examples to help you effectively utilize the ATR in your trading strategies.

What is Average True Range (ATR)?

ATR is a measure of volatility that was developed by J. Welles Wilder Jr. It reflects the degree of price movement over a specified period, typically 14 days. Unlike other indicators that may focus solely on price direction, ATR provides insights into market volatility, which can be crucial for setting stop-loss orders and determining position sizing.