Fibonacci Bollinger Bands Indicator & Strategy Guide
Fibonacci Bollinger Bands combine two powerful trading tools: Bollinger Bands and Fibonacci retracement levels. This article will explore their significance, how to implement them using Pine Script, and strategies for effective trading.
Understanding Fibonacci Bollinger Bands
Bollinger Bands are a volatility indicator that consists of a middle band (a simple moving average) and two outer bands that represent standard deviations from the average. The purpose of these bands is to provide a relative definition of high and low prices.
Fibonacci retracement levels, derived from the Fibonacci sequence, indicate potential reversal levels in the market. By integrating these two tools, traders can enhance their analysis, identifying potential entry and exit points more effectively.

Key Components of Fibonacci Bollinger Bands
- Middle Band: Usually a 20-period simple moving average (SMA).
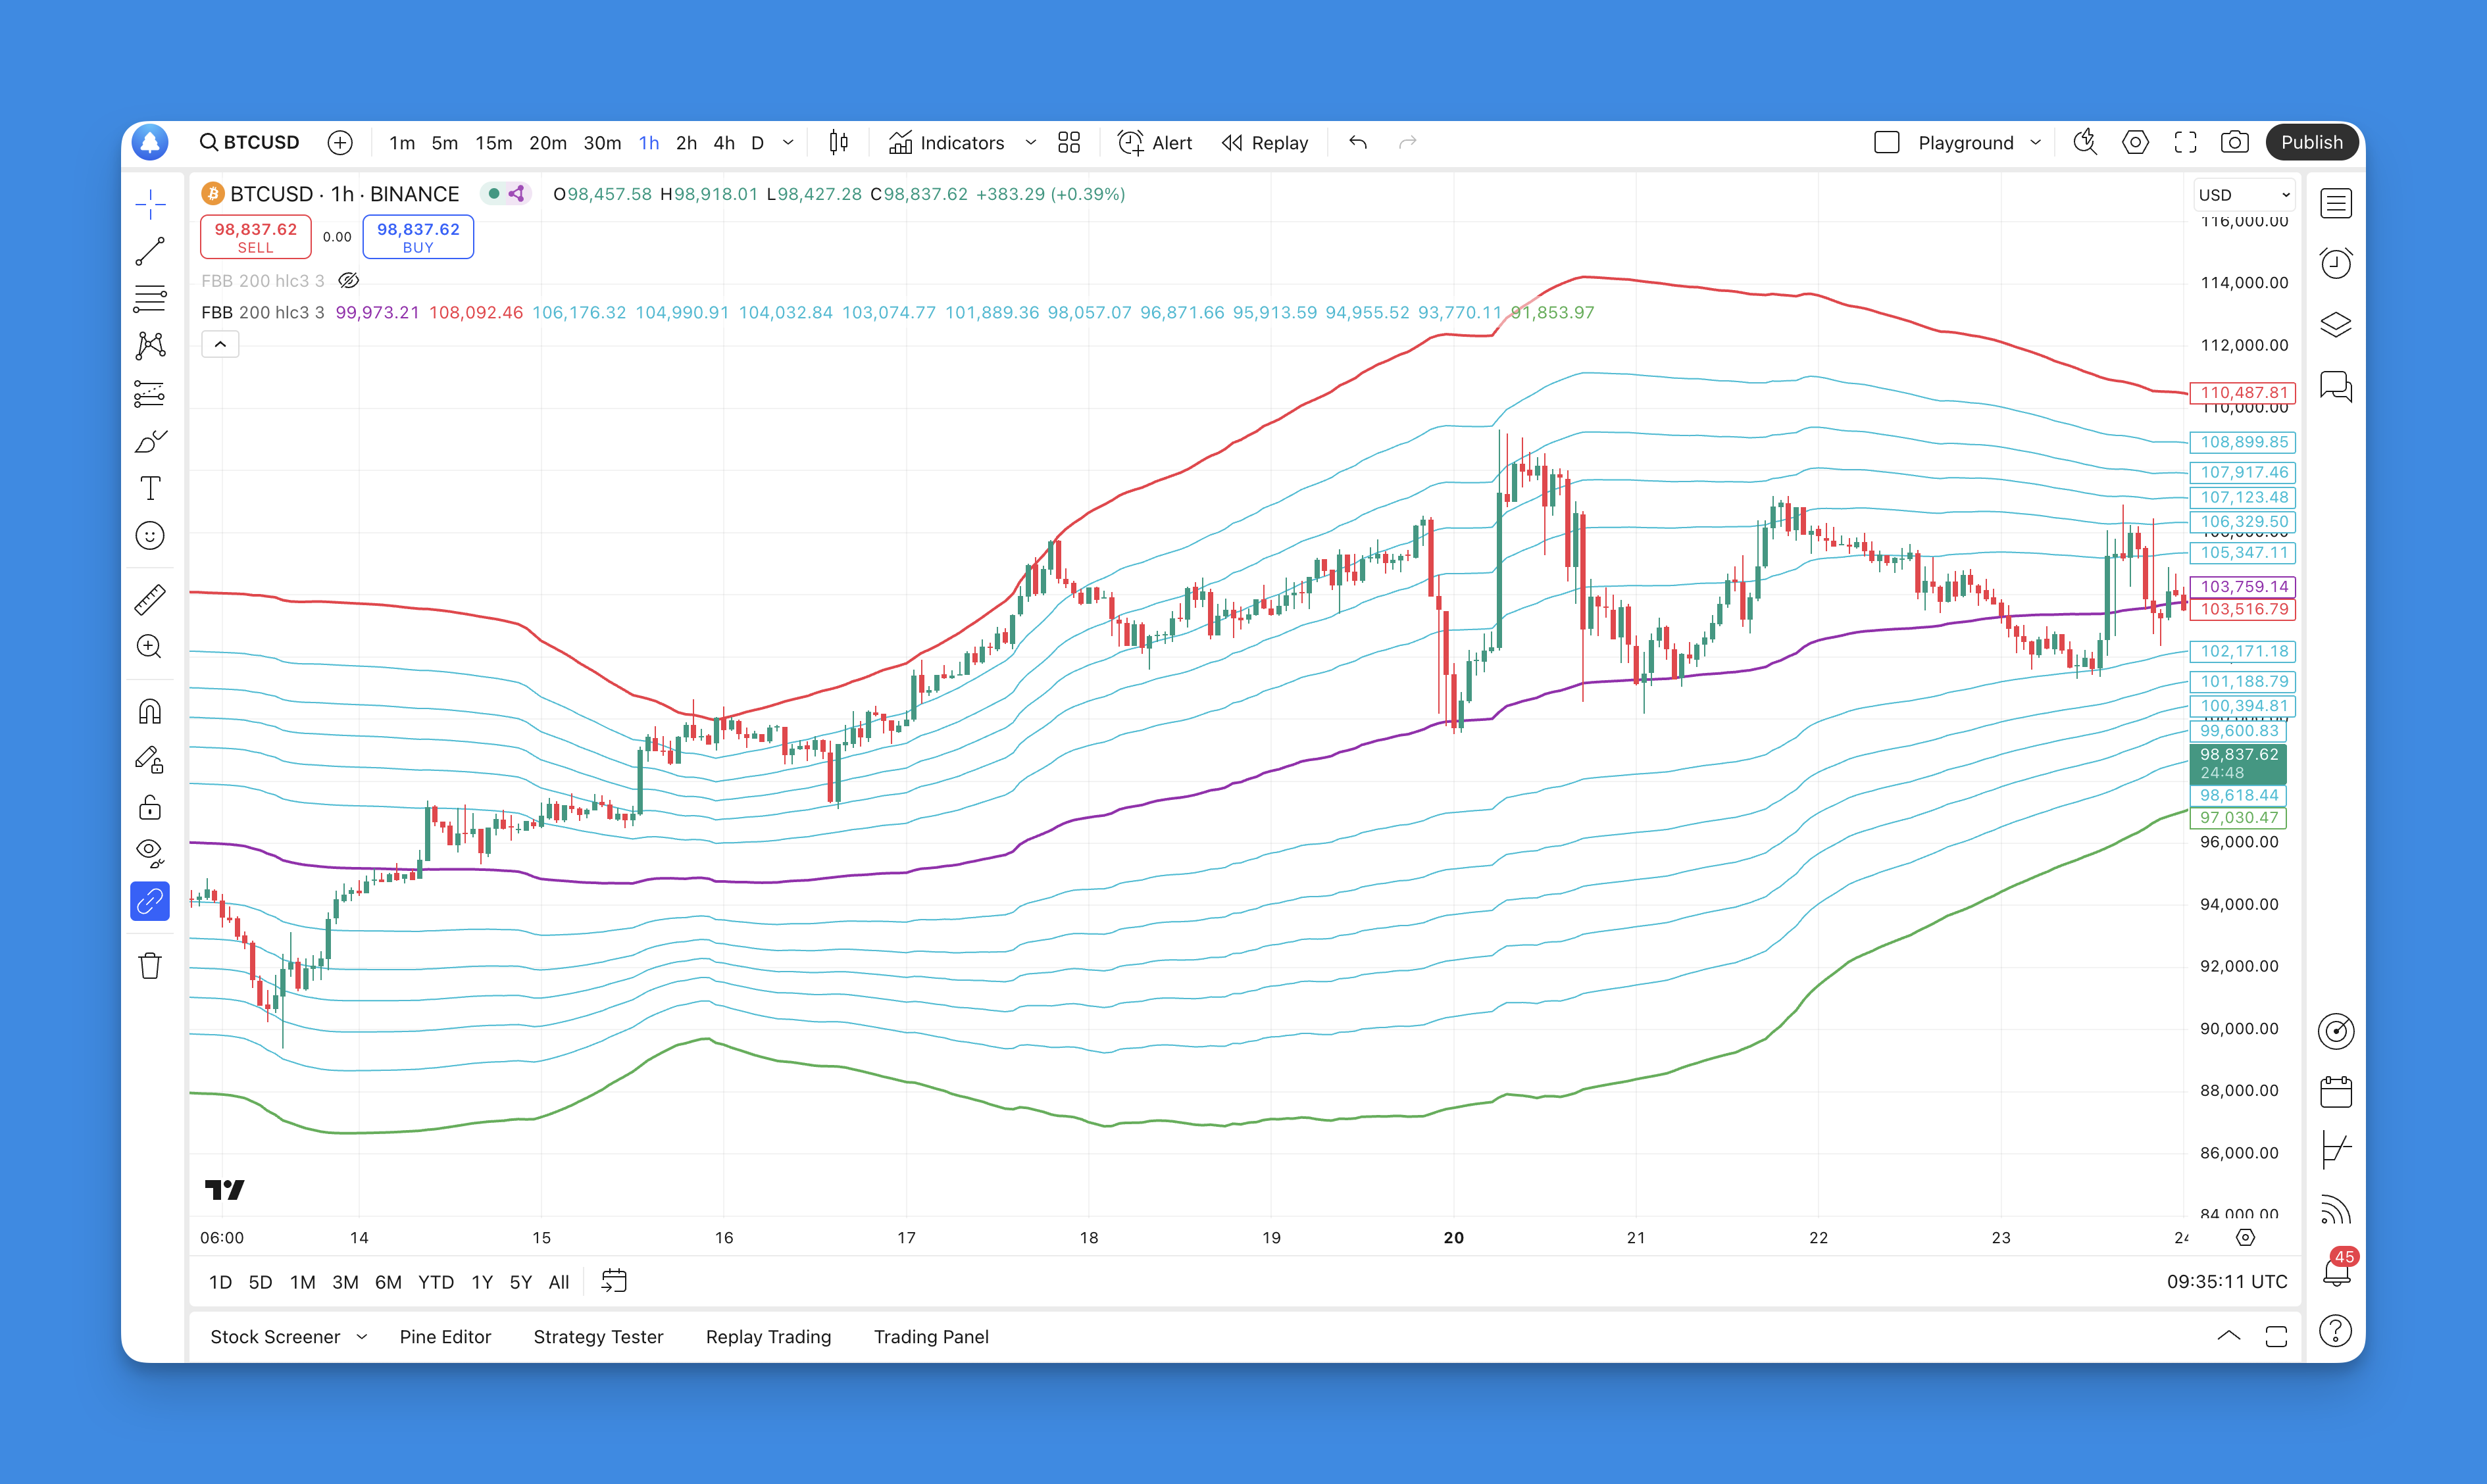
- Upper and Lower Bands: Calculated using standard deviations from the middle band but adjusted with Fibonacci ratios (e.g., 1.618, 2.618).
- Fibonacci Levels: Commonly used levels include 23.6%, 38.2%, 50%, 61.8%, and 100%.
The Importance of Using Pine Script
Pine Script is TradingView's domain-specific language that allows traders to create custom indicators and strategies. Its user-friendly syntax makes it accessible for both novice and experienced traders.
Benefits of Using Pine Script for Fibonacci Bollinger Bands
- Customization: Tailor indicators to fit specific trading strategies.
- Backtesting: Evaluate the performance of strategies using historical data.
- Real-time Data: Respond dynamically to market movements with real-time data manipulation.
Adding the Fibonacci Bollinger Bands to TradingView Chart Without Coding
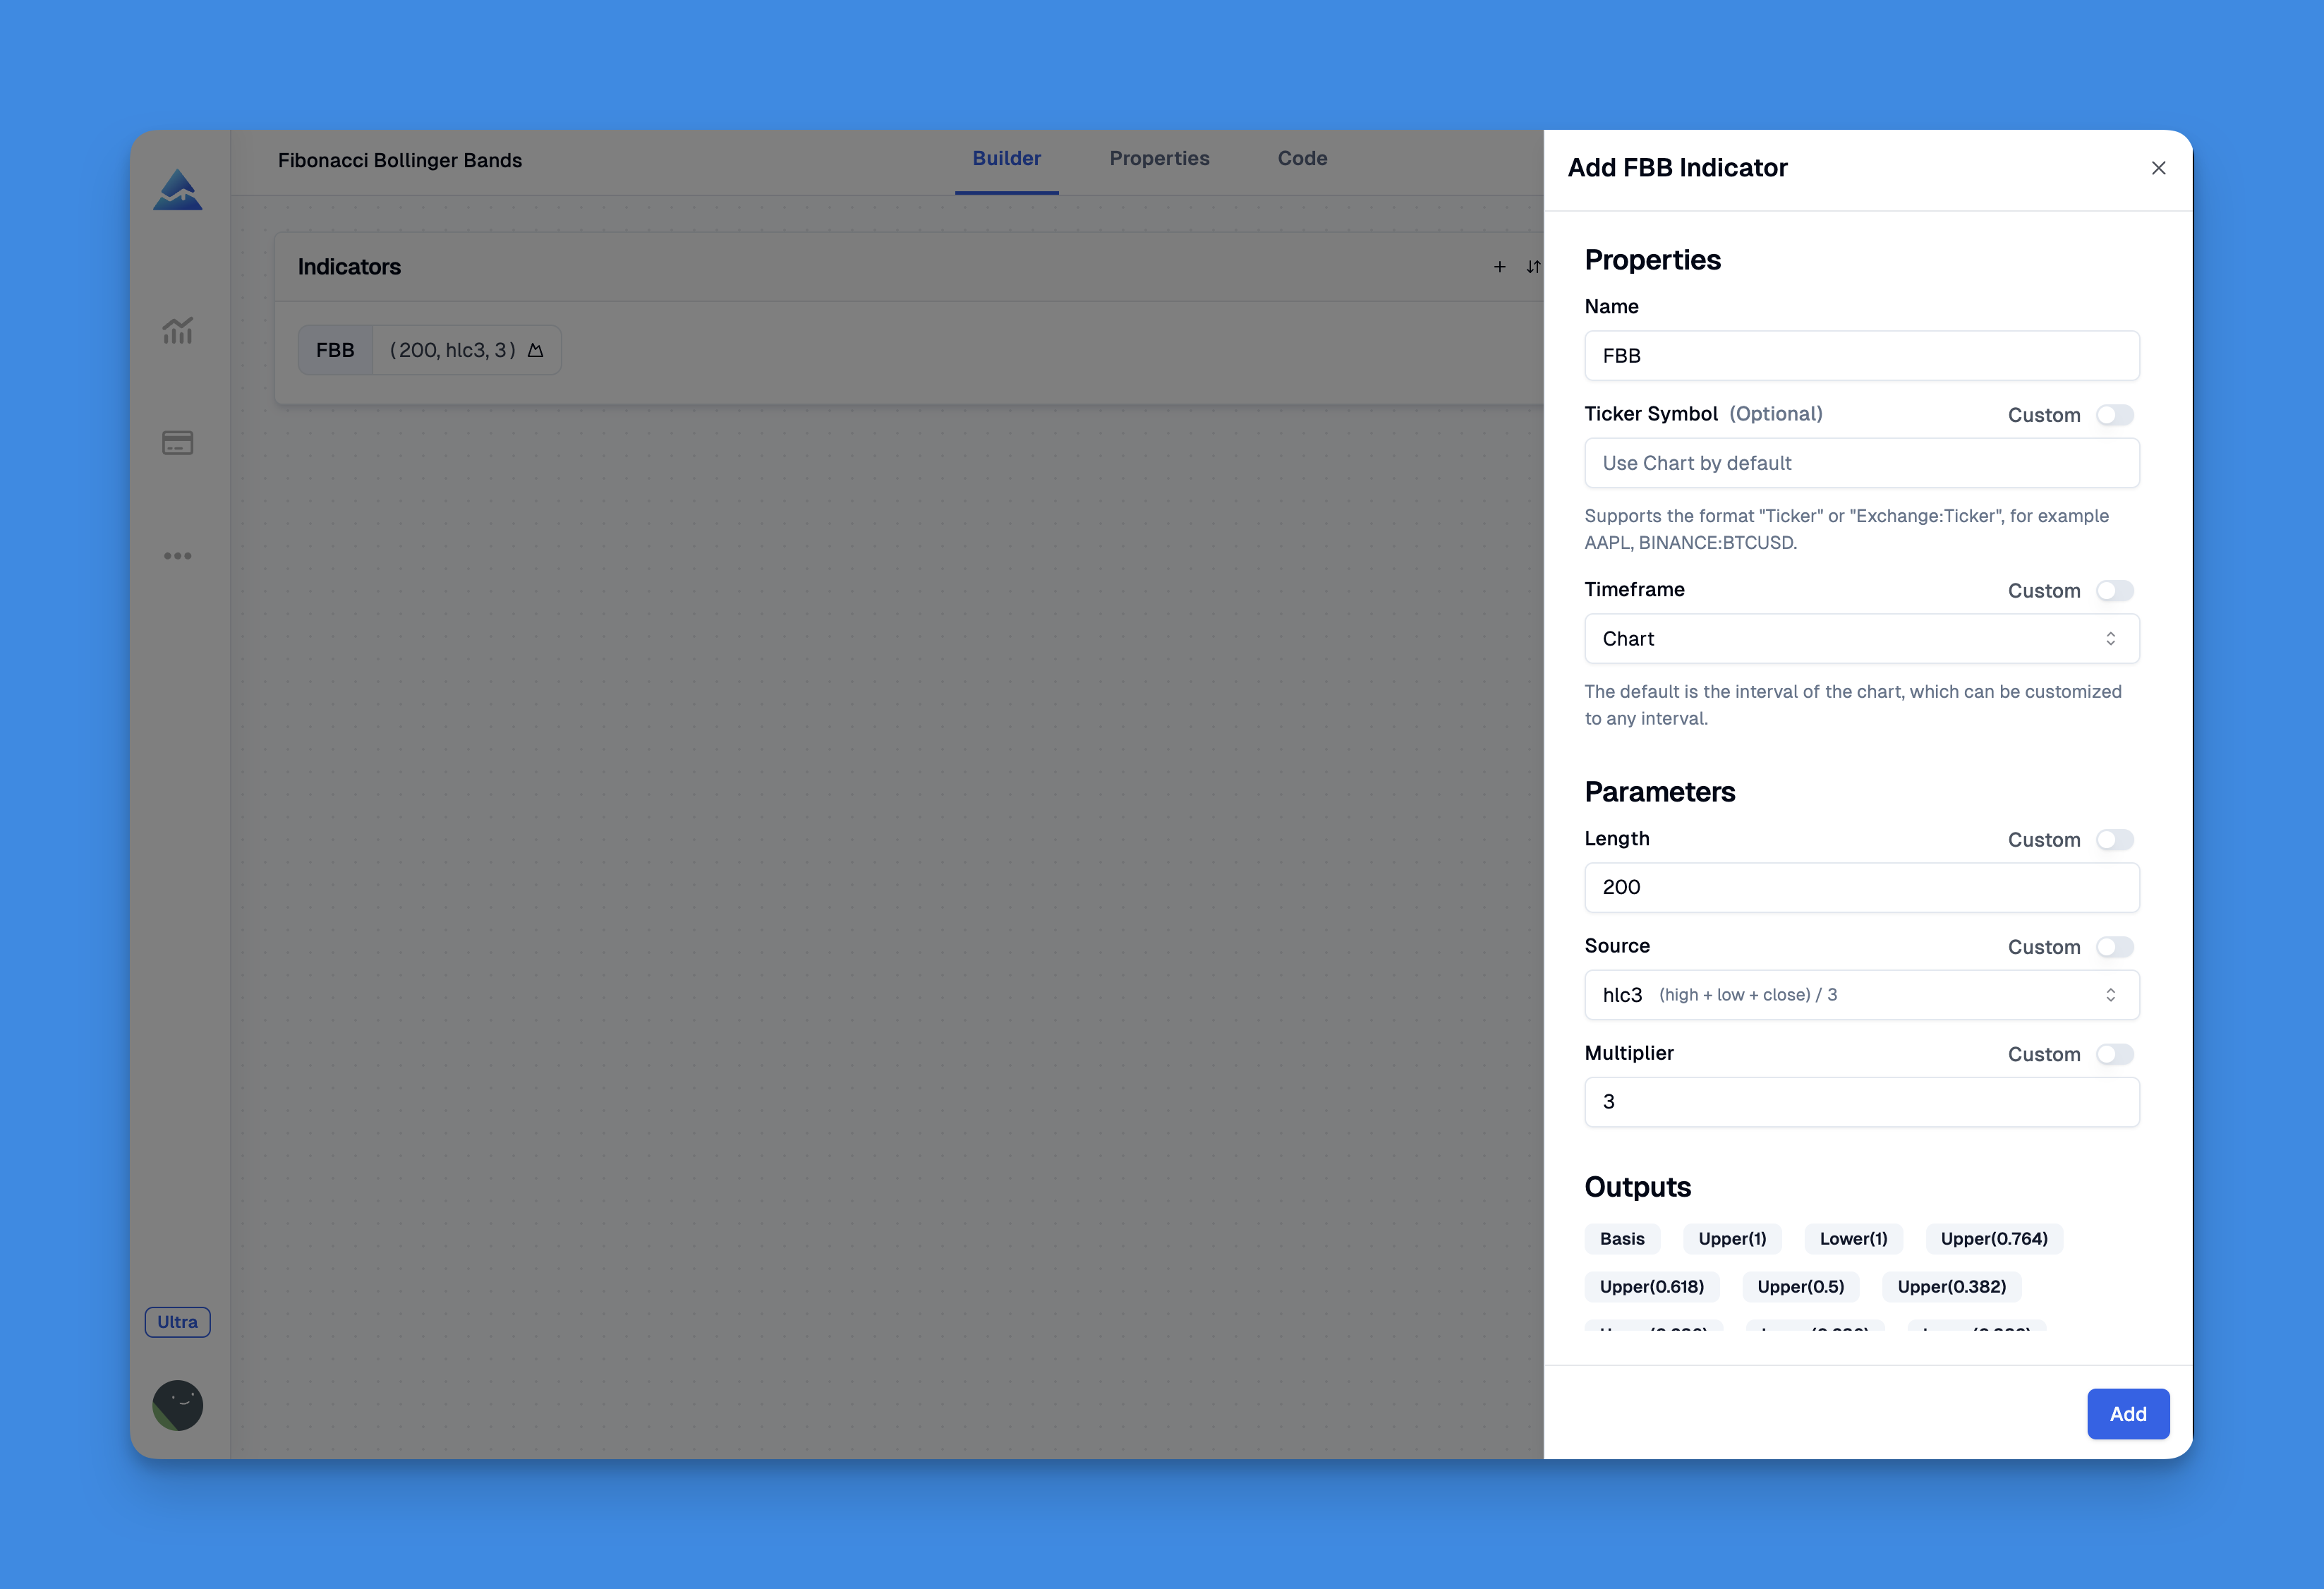
To incorporate the Fibonacci Bollinger Bands into your TradingView chart without any coding skills, you can utilize Pineify, a user-friendly tool designed for traders. Pineify allows you to create and manage indicators effortlessly, bypassing the traditional limitations of TradingView's two-indicator cap. With its intuitive interface, you can add unlimited technical indicators, including the Fibonacci Bollinger Bands, to your charts, enhancing your trading strategy without needing programming knowledge.

Website: Pineify
Click here to view all the features of Pineify.Using Pineify, you can easily customize inputs and plots for the Fibonacci Bollinger Bands, allowing you to tailor the indicator to fit your specific trading style. The platform also supports various ticker symbols and timeframes, ensuring that you can analyze multiple markets simultaneously. Additionally, Pineify offers a powerful condition editor that enables you to combine different technical indicators and price data to develop precise trading rules.
Implementing Fibonacci Bollinger Bands in Pine Script
Below is a basic implementation of Fibonacci Bollinger Bands in Pine Script:
// This source code is subject to the terms of the Mozilla Public License 2.0 at https://mozilla.org/MPL/2.0/
// © Pineify
//======================================================================//
// ____ _ _ __ //
// | _ \(_)_ __ ___(_)/ _|_ _ //
// | |_) | | '_ \ / _ \ | |_| | | | //
// | __/| | | | | __/ | _| |_| | //
// |_| |_|_| |_|\___|_|_| \__, | //
// |___/ //
//======================================================================//
//@version=6
indicator(title="Fibonacci Bollinger Bands", overlay=true, max_labels_count=500)
//#region —————————————————————————————————————————————————— Custom Code
//#endregion ————————————————————————————————————————————————————————————
//#region —————————————————————————————————————————————————— Common Dependence
p_comm_time_range_to_unix_time(string time_range, int date_time = time, string timezone = syminfo.timezone) =>
int start_unix_time = na
int end_unix_time = na
int start_time_hour = na
int start_time_minute = na
int end_time_hour = na
int end_time_minute = na
if str.length(time_range) == 11
// Format: hh:mm-hh:mm
start_time_hour := math.floor(str.tonumber(str.substring(time_range, 0, 2)))
start_time_minute := math.floor(str.tonumber(str.substring(time_range, 3, 5)))
end_time_hour := math.floor(str.tonumber(str.substring(time_range, 6, 8)))
end_time_minute := math.floor(str.tonumber(str.substring(time_range, 9, 11)))
else if str.length(time_range) == 9
// Format: hhmm-hhmm
start_time_hour := math.floor(str.tonumber(str.substring(time_range, 0, 2)))
start_time_minute := math.floor(str.tonumber(str.substring(time_range, 2, 4)))
end_time_hour := math.floor(str.tonumber(str.substring(time_range, 5, 7)))
end_time_minute := math.floor(str.tonumber(str.substring(time_range, 7, 9)))
start_unix_time := timestamp(timezone, year(date_time, timezone), month(date_time, timezone), dayofmonth(date_time, timezone), start_time_hour, start_time_minute, 0)
end_unix_time := timestamp(timezone, year(date_time, timezone), month(date_time, timezone), dayofmonth(date_time, timezone), end_time_hour, end_time_minute, 0)
[start_unix_time, end_unix_time]
p_comm_time_range_to_start_unix_time(string time_range, int date_time = time, string timezone = syminfo.timezone) =>
int start_time_hour = na
int start_time_minute = na
if str.length(time_range) == 11
// Format: hh:mm-hh:mm
start_time_hour := math.floor(str.tonumber(str.substring(time_range, 0, 2)))
start_time_minute := math.floor(str.tonumber(str.substring(time_range, 3, 5)))
else if str.length(time_range) == 9
// Format: hhmm-hhmm
start_time_hour := math.floor(str.tonumber(str.substring(time_range, 0, 2)))
start_time_minute := math.floor(str.tonumber(str.substring(time_range, 2, 4)))
timestamp(timezone, year(date_time, timezone), month(date_time, timezone), dayofmonth(date_time, timezone), start_time_hour, start_time_minute, 0)
p_comm_time_range_to_end_unix_time(string time_range, int date_time = time, string timezone = syminfo.timezone) =>
int end_time_hour = na
int end_time_minute = na
if str.length(time_range) == 11
end_time_hour := math.floor(str.tonumber(str.substring(time_range, 6, 8)))
end_time_minute := math.floor(str.tonumber(str.substring(time_range, 9, 11)))
else if str.length(time_range) == 9
end_time_hour := math.floor(str.tonumber(str.substring(time_range, 5, 7)))
end_time_minute := math.floor(str.tonumber(str.substring(time_range, 7, 9)))
timestamp(timezone, year(date_time, timezone), month(date_time, timezone), dayofmonth(date_time, timezone), end_time_hour, end_time_minute, 0)
p_comm_timeframe_to_seconds(simple string tf) =>
float seconds = 0
tf_lower = str.lower(tf)
value = str.tonumber(str.substring(tf_lower, 0, str.length(tf_lower) - 1))
if str.endswith(tf_lower, 's')
seconds := value
else if str.endswith(tf_lower, 'd')
seconds := value * 86400
else if str.endswith(tf_lower, 'w')
seconds := value * 604800
else if str.endswith(tf_lower, 'm')
seconds := value * 2592000
else
seconds := str.tonumber(tf_lower) * 60
seconds
p_custom_sources() =>
[open, high, low, close, volume]
//#endregion —————————————————————————————————————————————————————————————————
//#region —————————————————————————————————————————————————— Ta Dependence
p_ta_fbb(simple int length, series float src, simple float mult) =>
basis = ta.vwma(src, length)
dev = mult * ta.stdev(src, length)
upper_1= basis + (0.236*dev)
upper_2= basis + (0.382*dev)
upper_3= basis + (0.5*dev)
upper_4= basis + (0.618*dev)
upper_5= basis + (0.764*dev)
upper_6= basis + (1*dev)
lower_1= basis - (0.236*dev)
lower_2= basis - (0.382*dev)
lower_3= basis - (0.5*dev)
lower_4= basis - (0.618*dev)
lower_5= basis - (0.764*dev)
lower_6= basis - (1*dev)
[basis, upper_6, lower_6, upper_5, upper_4, upper_3, upper_2, upper_1, lower_1, lower_2, lower_3, lower_4, lower_5]
//#endregion —————————————————————————————————————————————————————————————
//#region ———————————————————————————��——————————————————————— Constants
// Input Groups
string P_GP_1 = ""
//#endregion —————————————————————————————————————————————————————————
//#region —————————————————————————————————————————————————— Inputs
//#endregion ———————————————————————————————————————————————————————
//#region —————————————————————————————————————————————————— Price Data
//#endregion ———————————————————————————————————————————————————————————
//#region —————————————————————————————————————————————————— Indicators
[p_ind_1_basis, p_ind_1_upper1, p_ind_1_lower1, p_ind_1_upper0764, p_ind_1_upper0618, p_ind_1_upper05, p_ind_1_upper0382, p_ind_1_upper0236, p_ind_1_lower0236, p_ind_1_lower0382, p_ind_1_lower05, p_ind_1_lower0618, p_ind_1_lower0764] = p_ta_fbb(200, hlc3, 3) // FBB
//#endregion ———————————————————————————————————————————————————————————
//#region —————————————————————————————————————————————————— Conditions
//#endregion ———————————————————————————————————————————————————————————
//#region —————————————————————————————————————————————————— Indicator Plots
// FBB
plot(p_ind_1_basis, "FBB - Basis", color.rgb(156, 39, 176, 0), 2)
plot(p_ind_1_upper1, "FBB - Upper (1)", color.rgb(242, 54, 69, 0), 2)
plot(p_ind_1_upper0764, "FBB - Upper (0.764)", color.rgb(0, 188, 212, 0), 1)
plot(p_ind_1_upper0618, "FBB - Upper (0.618)", color.rgb(0, 188, 212, 0), 1)
plot(p_ind_1_upper05, "FBB - Upper (0.5)", color.rgb(0, 188, 212, 0), 1)
plot(p_ind_1_upper0382, "FBB - Upper (0.382)", color.rgb(0, 188, 212, 0), 1)
plot(p_ind_1_upper0236, "FBB - Upper (0.236)", color.rgb(0, 188, 212, 0), 1)
plot(p_ind_1_lower0236, "FBB - Lower (0.236)", color.rgb(0, 188, 212, 0), 1)
plot(p_ind_1_lower0382, "FBB - Lower (0.382)", color.rgb(0, 188, 212, 0), 1)
plot(p_ind_1_lower05, "FBB - Lower (0.5)", color.rgb(0, 188, 212, 0), 1)
plot(p_ind_1_lower0618, "FBB - Lower (0.618)", color.rgb(0, 188, 212, 0), 1)
plot(p_ind_1_lower0764, "FBB - Lower (0.764)", color.rgb(0, 188, 212, 0), 1)
plot(p_ind_1_lower1, "FBB - Lower (1)", color.rgb(76, 175, 80, 0), 2)
//#endregion ————————————————————————————————————————————————————————————————
//#region —————————————————————————————————————————————————— Custom Plots
//#endregion —————————————————————————————————————————————————————————————
//#region —————————————————————————————————————————————————— Alert
//#endregion ——————————————————————————————————————————————————————
Trading Strategies with Fibonacci Bollinger Bands
Incorporating Fibonacci Bollinger Bands into your trading strategy can enhance your ability to identify potential market movements. Here are some strategies to consider:
1. Breakout Strategy
- Identify Breakouts: Look for price action that closes above the upper band or below the lower band.
- Confirmation: Use additional indicators like RSI or MACD for confirmation before entering a trade.
2. Reversal Strategy
- Fibonacci Levels as Targets: After a breakout, set profit targets at key Fibonacci levels (e.g., 61.8% retracement).
- Stop Loss Placement: Place stop losses just outside the opposite band to manage risk effectively.
3. Range-Bound Trading
- Identify Ranges: In sideways markets, use the bands to identify potential support and resistance levels.
- Buy/Sell Signals: Buy when price touches the lower band and sell when it touches the upper band.
Conclusion
Fibonacci Bollinger Bands offer a unique approach to technical analysis by combining volatility measurements with mathematical ratios that traders have relied on for decades. By implementing these bands through Pine Script, traders can develop customized strategies that cater to their trading styles.