How to Code an EMA Crossover Pine Script for Trading

An EMA crossover occurs when a faster exponential moving average moves from one side of a slower EMA to the other. Pine Script can calculate the two series, identify the crossing bar, and mark the event. The crossing is an observable rule, not evidence of a profitable entry on its own.
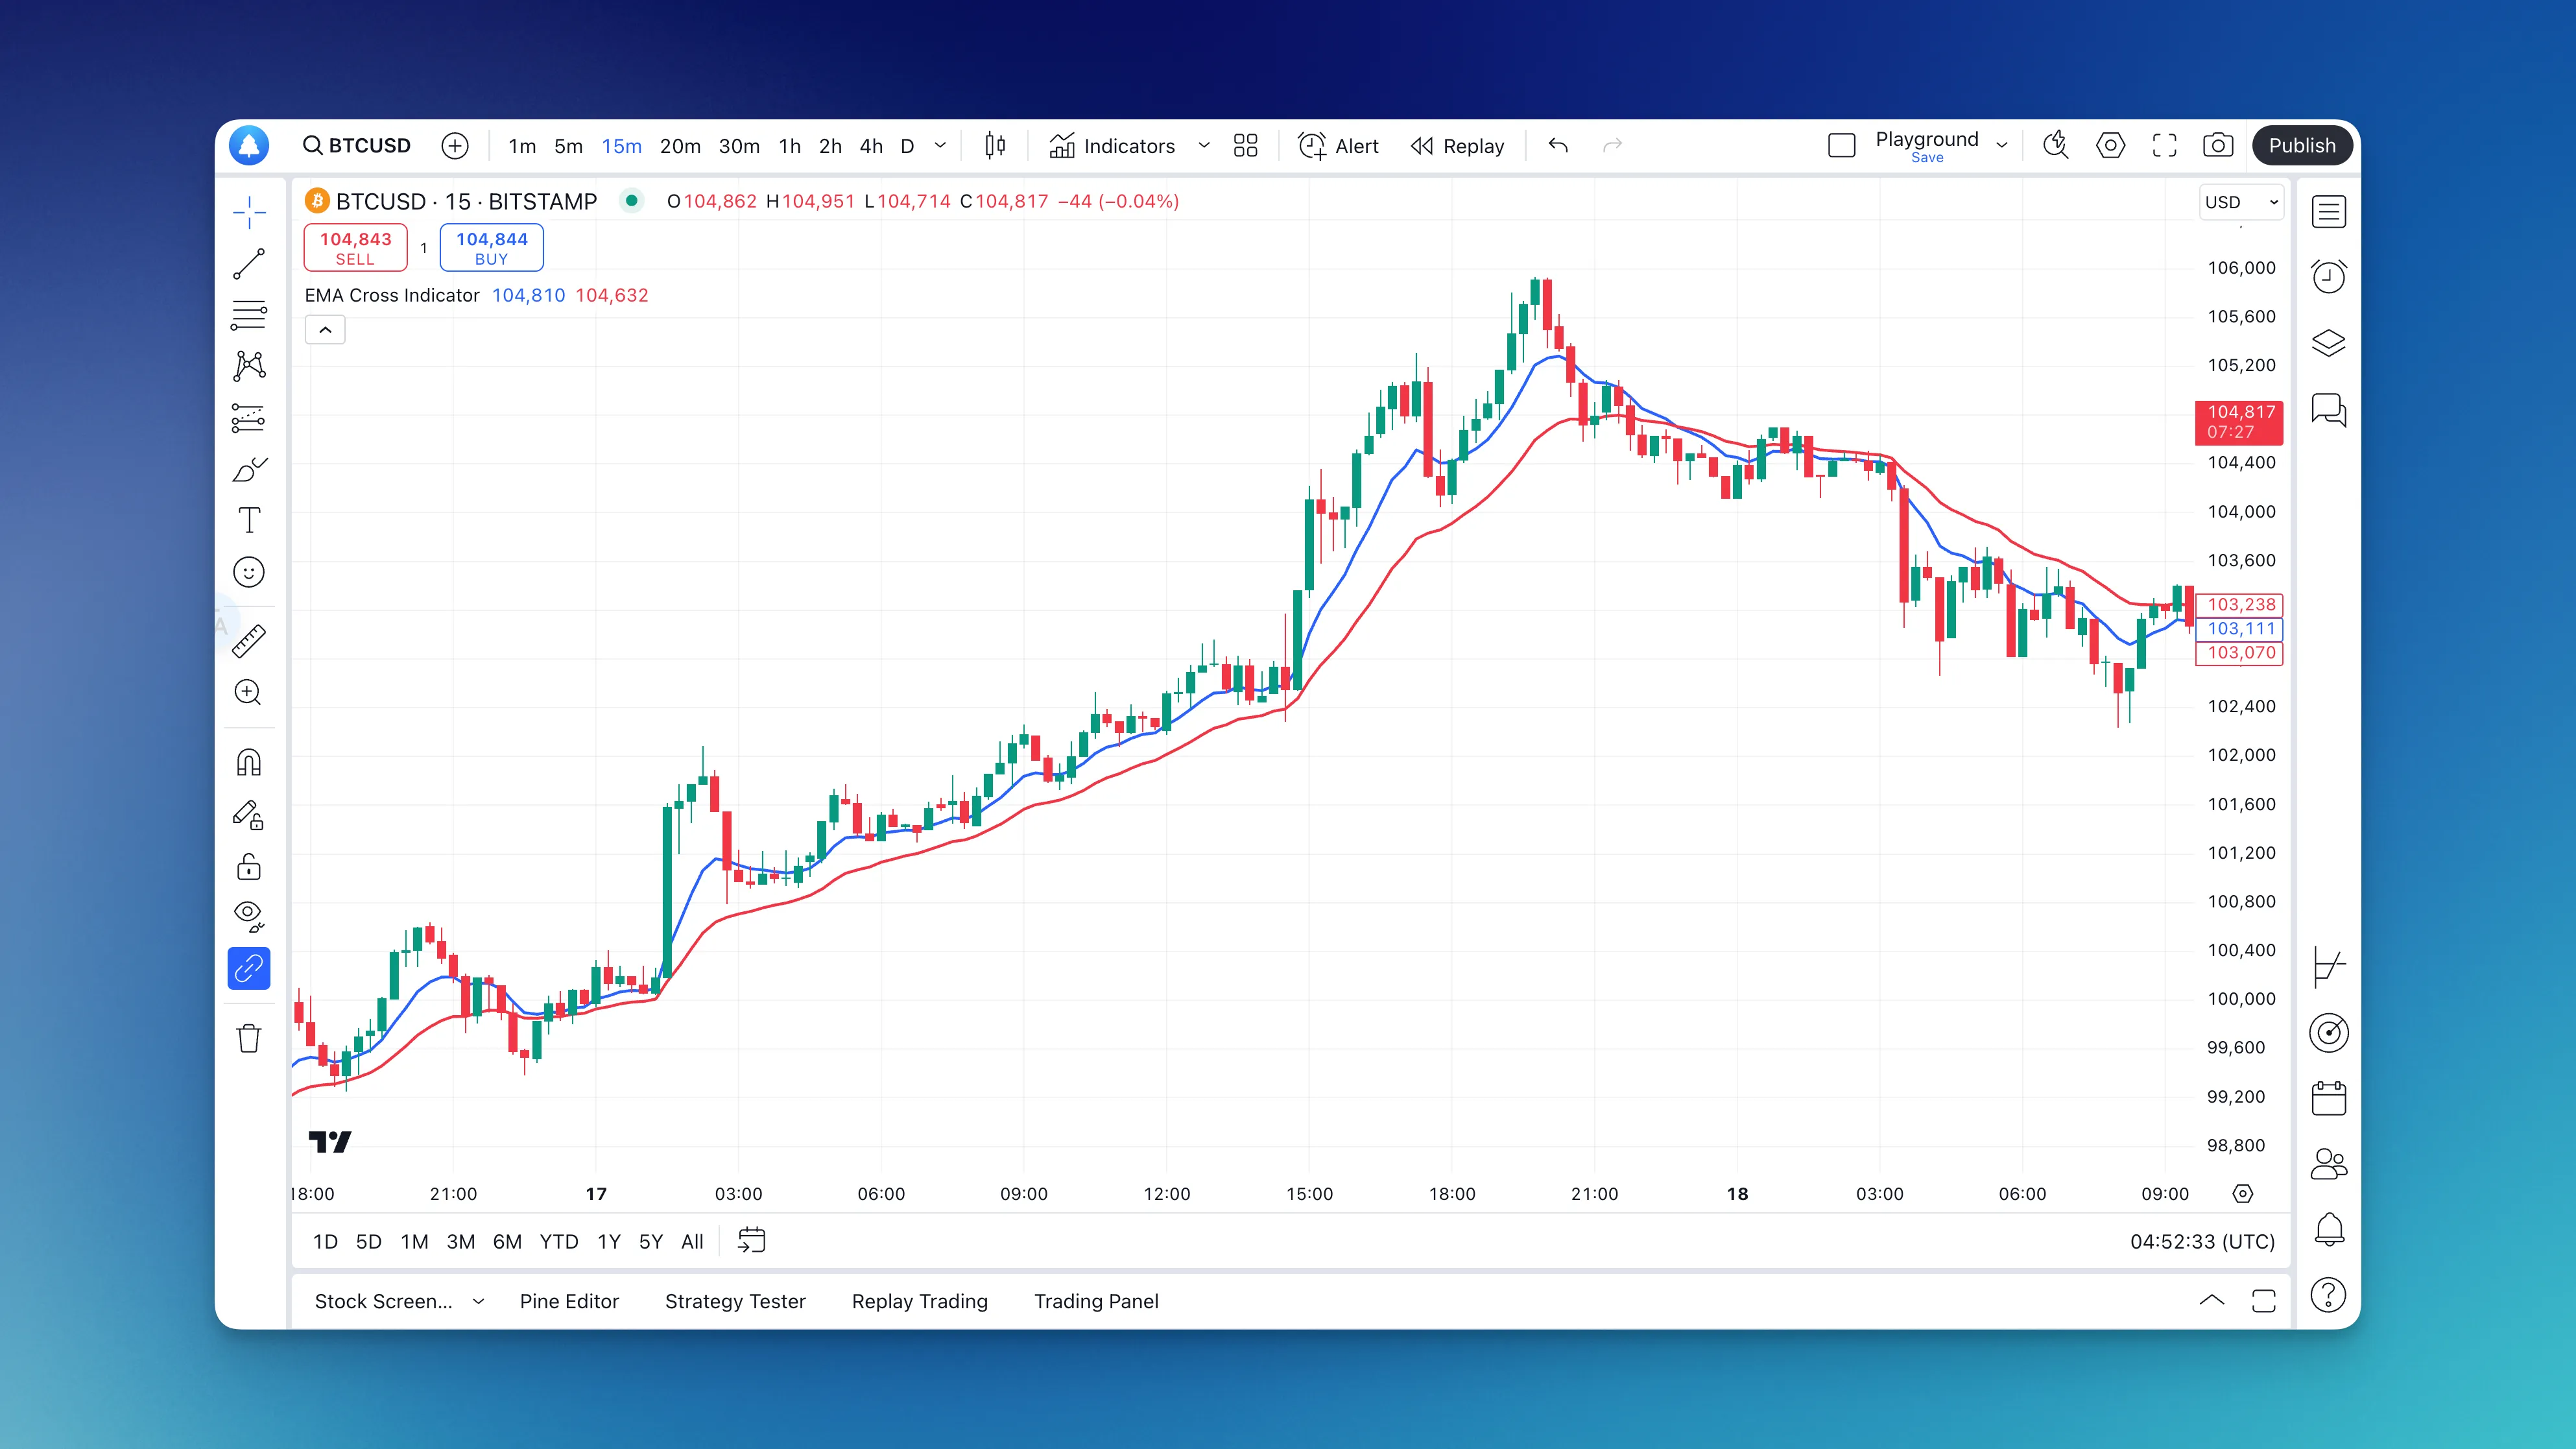
Define the crossover before coding
An EMA weights recent observations more heavily than older ones. Compared with an SMA of the same nominal length, its response differs; faster response does not remove whipsaws or guarantee an earlier profitable trade.
Choose the price source, fast and slow lengths, chart timeframe, and confirmation policy. The 9/21 lengths below are illustrative inputs. They are not proven best settings for day trading, and changing the timeframe changes the time span each average summarizes.

A complete EMA crossover indicator
//@version=6
indicator("Confirmed EMA Crossovers", overlay=true)
fastLength = input.int(9, "Fast EMA", minval=1)
slowLength = input.int(21, "Slow EMA", minval=1)
if fastLength >= slowLength
    runtime.error("Fast EMA length must be less than slow EMA length.")
fastEMA = ta.ema(close, fastLength)
slowEMA = ta.ema(close, slowLength)
crossUp = ta.crossover(fastEMA, slowEMA)
crossDown = ta.crossunder(fastEMA, slowEMA)
confirmedUp = crossUp and barstate.isconfirmed
confirmedDown = crossDown and barstate.isconfirmed
plot(fastEMA, "Fast EMA", color.blue)
plot(slowEMA, "Slow EMA", color.orange)
plotshape(confirmedUp, title="Cross up", style=shape.triangleup, location=location.belowbar, color=color.green, size=size.small)
plotshape(confirmedDown, title="Cross down", style=shape.triangledown, location=location.abovebar, color=color.red, size=size.small)
alertcondition(confirmedUp, "EMA cross up", "Fast EMA crossed above slow EMA at bar close.")
alertcondition(confirmedDown, "EMA cross down", "Fast EMA crossed below slow EMA at bar close.")
Paste the source into a new indicator in Pine Editor, save it, and add it to the chart. A cross-up requires the fast EMA to be above the slow EMA now and at or below it on the previous bar; the reverse defines a cross-down. The confirmation condition waits for the realtime bar to close. The EMA lines can still move during that bar.
Inspect several marked bars in the Data Window, checking both current and prior values. This verifies the implementation without inventing a return statistic. TradingView's repainting documentation explains the distinction between developing-bar values and confirmed events.
Create an alert deliberately
Select the indicator's cross-up or cross-down condition in TradingView's alert dialog and verify the intended interval and inputs. Code declares alert conditions; it does not create running alerts. Recreate a script alert after changing the relevant code or settings because the running alert uses a saved snapshot. See Pine alerts.
Use Pineify to specify the same rules
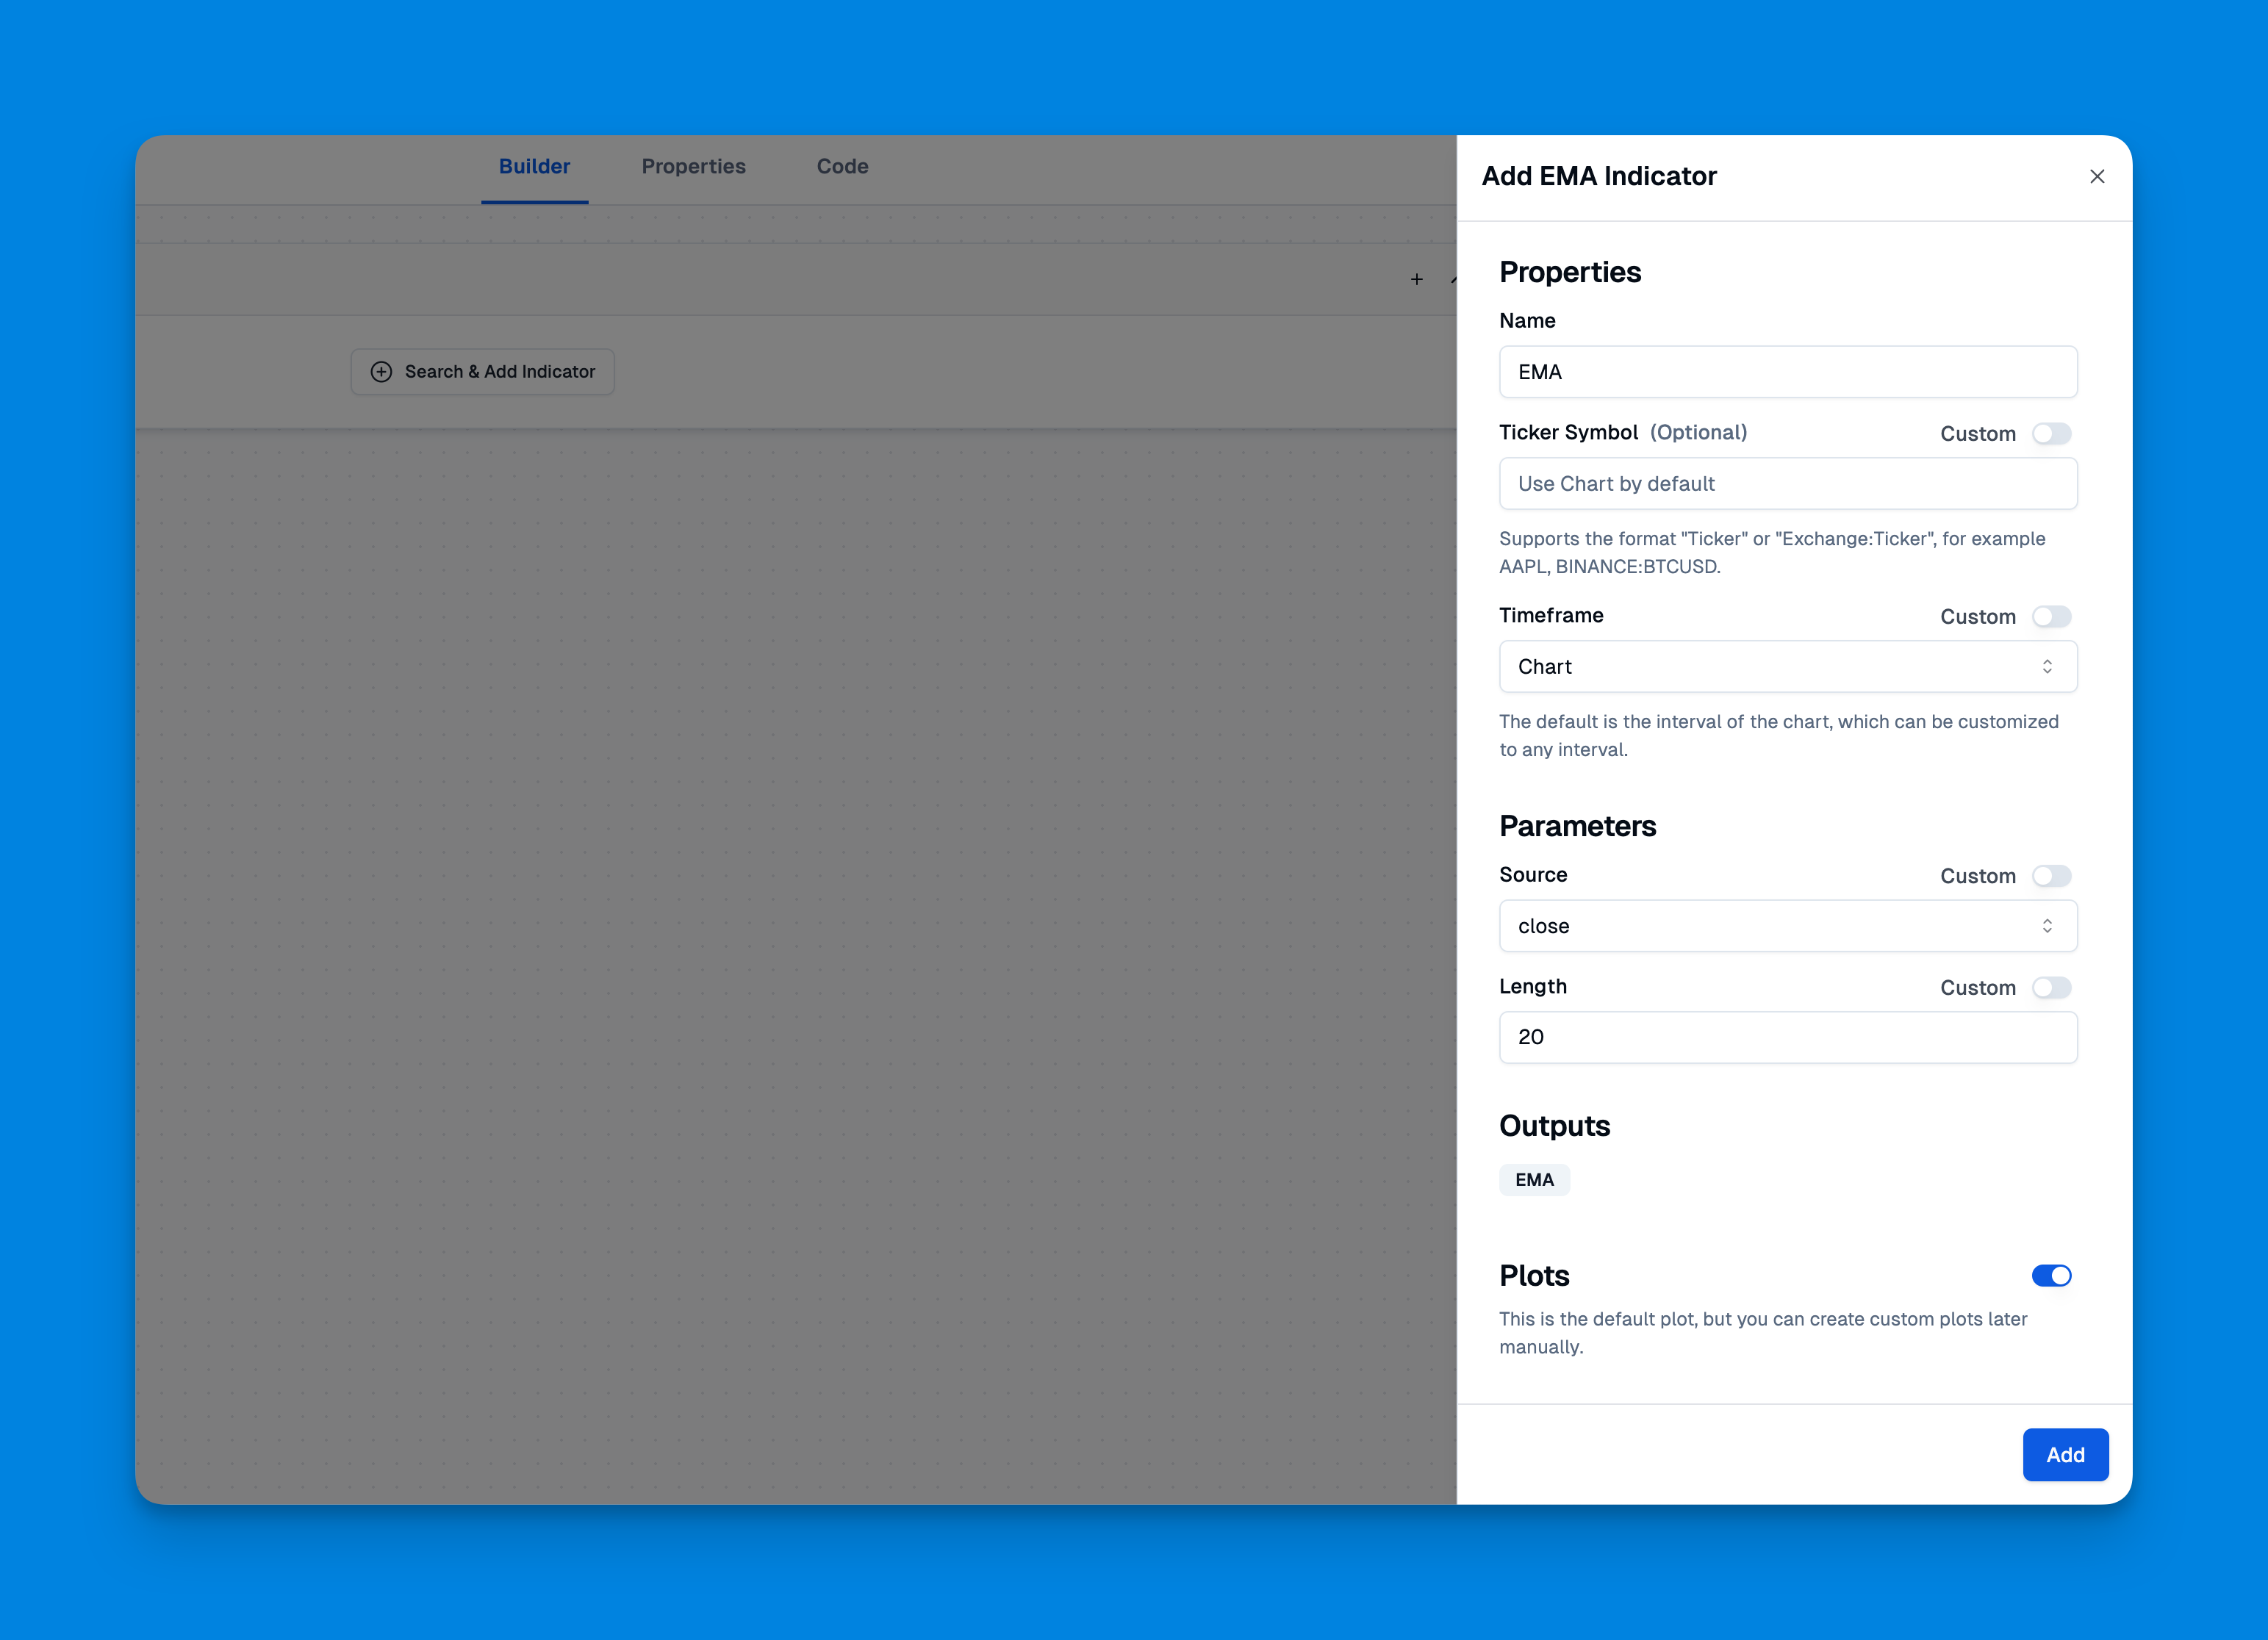
In Pineify, describe the two EMA lengths, close source, confirmed-bar markers, and required alerts. Whether using visual components or AI-generated source, inspect the exported logic and compare its crossing bars with the example. Generating one combined indicator does not remove TradingView's plotting, calculation, or alert limits.
Turn an indicator into a testable strategy
This example has no orders and produces no Strategy Tester performance report. A strategy needs explicit entry, exit, sizing, costs, and fill assumptions. Decide whether a bearish cross closes a long, opens a short, or simply marks an observation; those are materially different systems.
Compare results on data excluded from parameter selection and inspect individual fills. Account for the next available execution after a confirmed signal, spreads, commissions, and slippage. Maximum drawdown measures an equity decline from a peak to a later trough, not just a losing streak. A planned risk allocation or stop does not ensure that loss cannot exceed it. TradingView's strategy documentation explains its broker emulator and testing limitations.
Additional RSI, MACD, or higher-timeframe filters change the hypothesis and may reduce the sample. They do not automatically improve accuracy. Record every variant tested rather than selecting only the best historical combination.
What are the best EMA lengths?
There is no universal pair established here. The example uses configurable 9/21 lengths to demonstrate the rule; evaluate settings against a defined market, timeframe, and test protocol.
Does a marker place a trade?
No. This is an indicator. A strategy simulation or live execution workflow requires separate implementation and validation.
Why wait for bar close?
A developing bar can cross and then uncross. Confirmation avoids acting on that transient event, at the cost of waiting until close.