Change Candle Color in Pine Script: Step-by-Step Guide
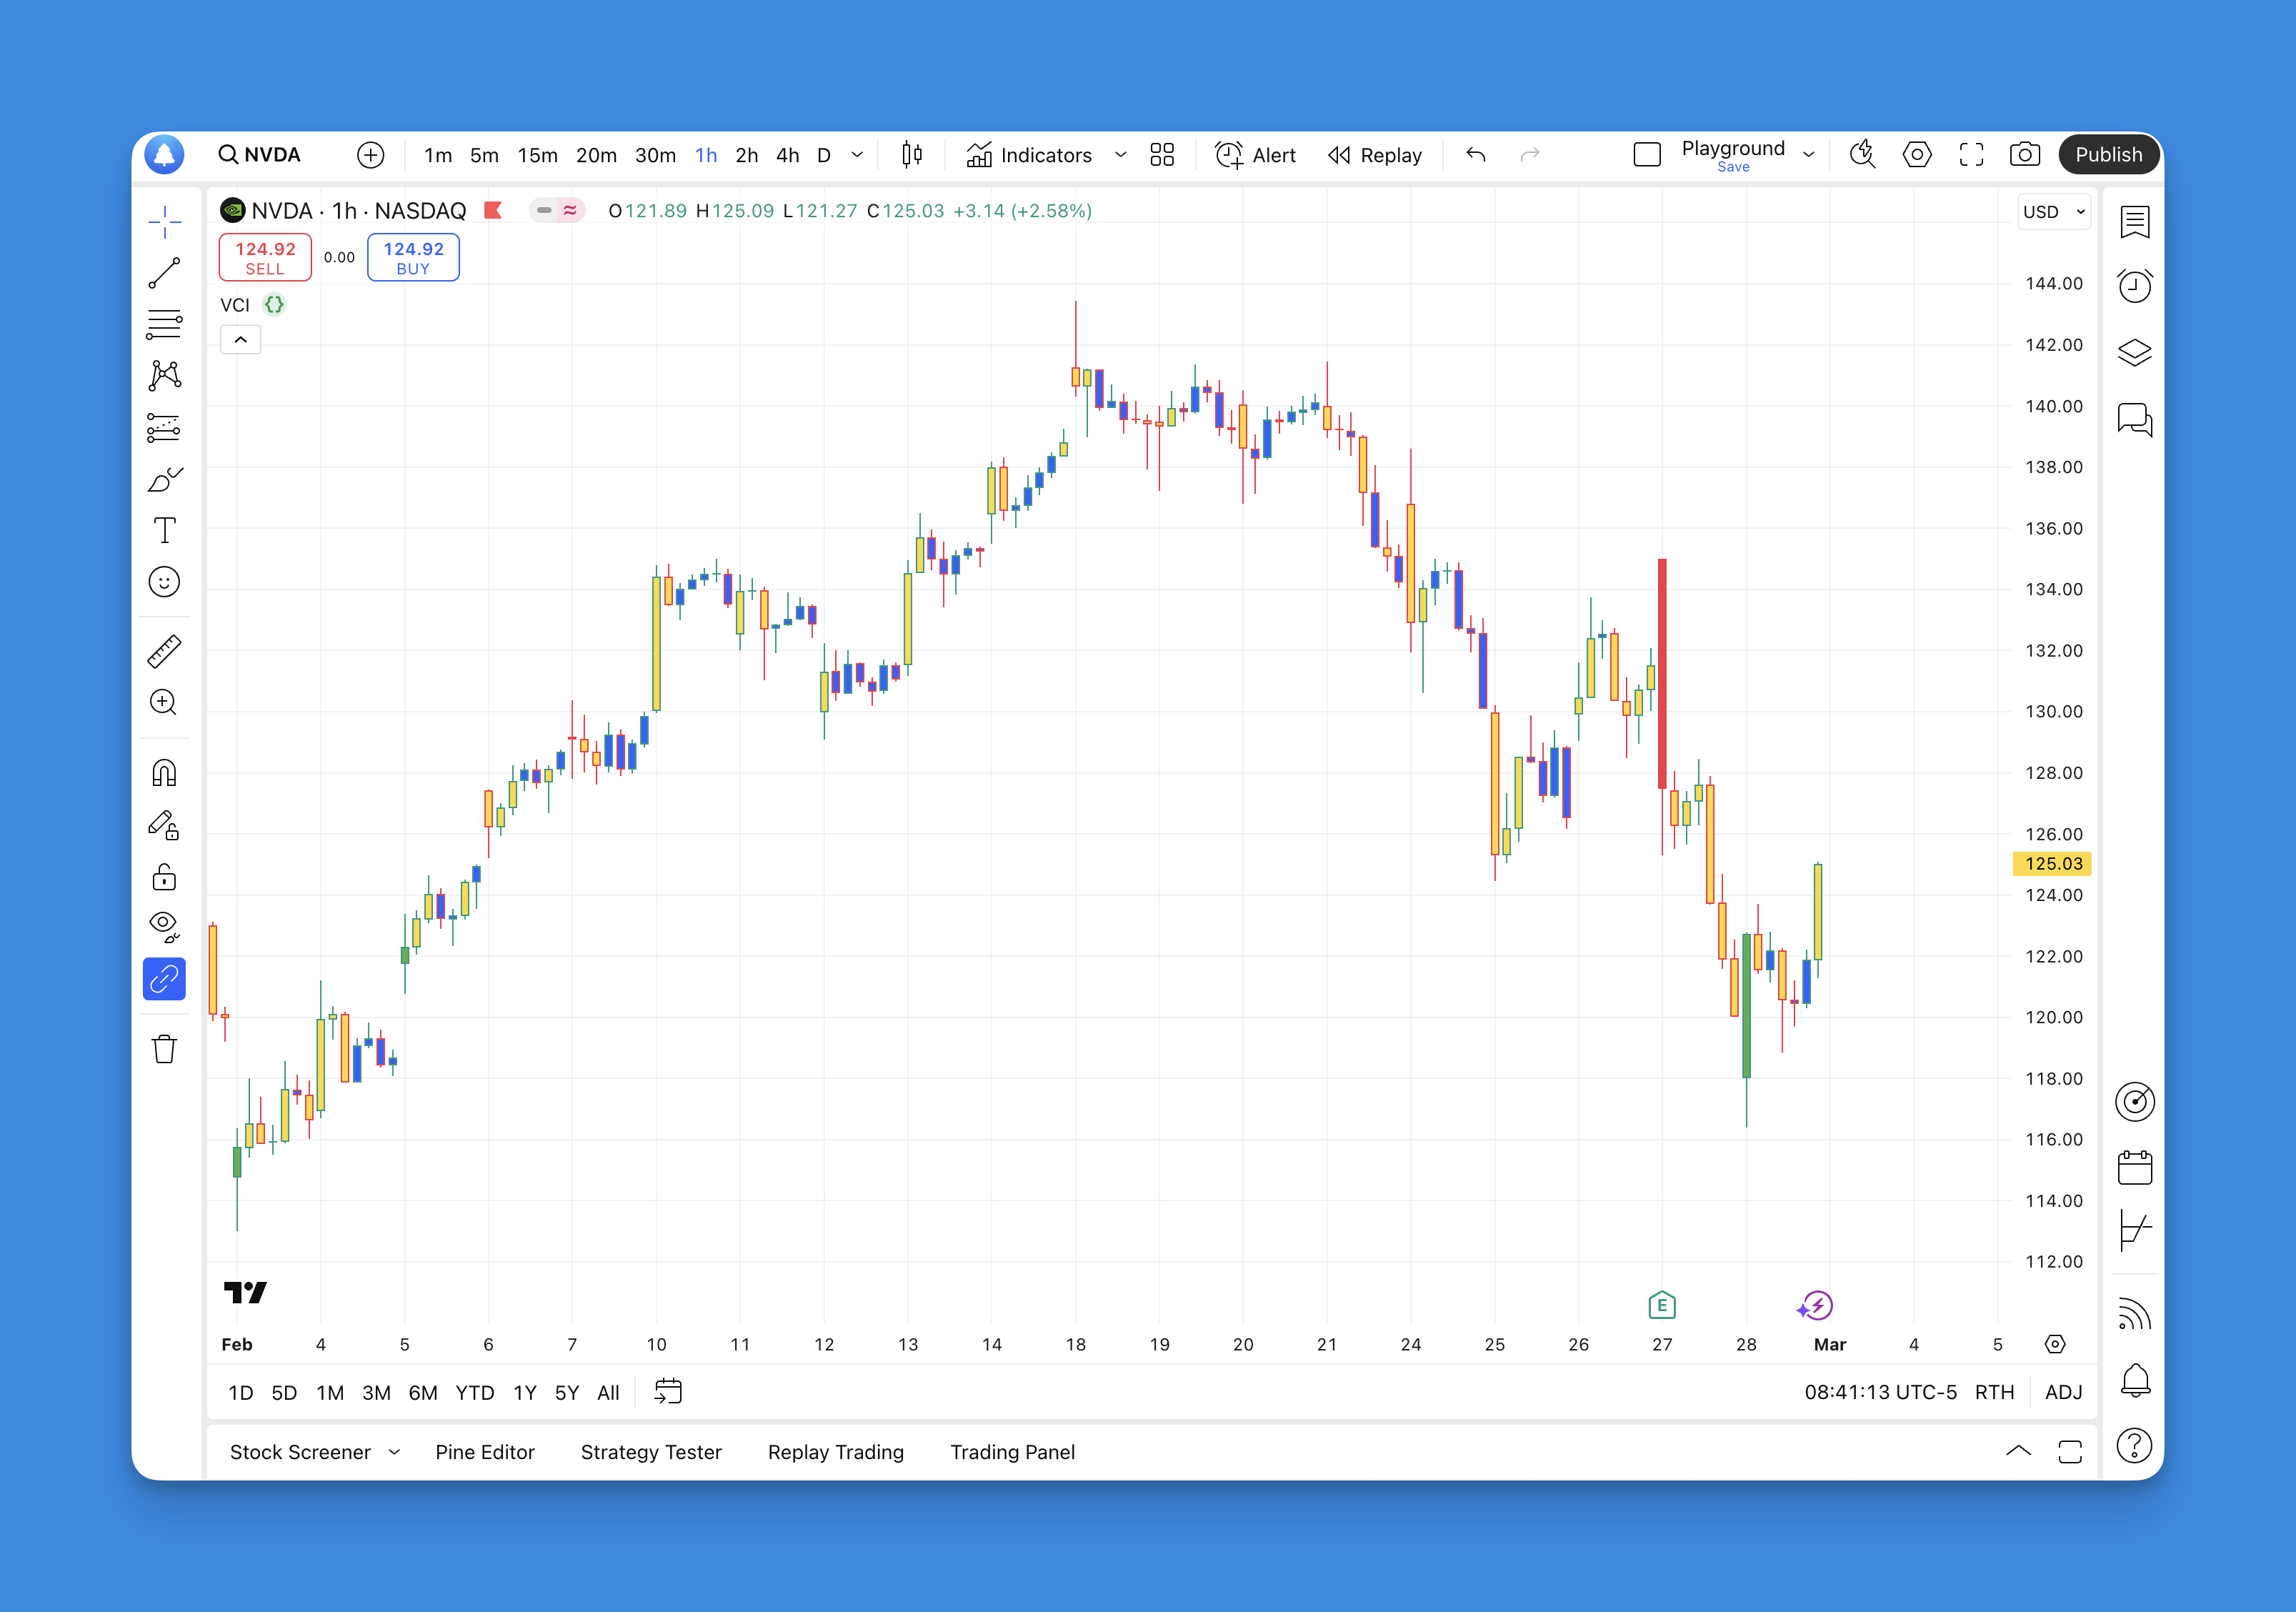
Changing candle colors in Pine Script can significantly enhance the visual appeal and functionality of your TradingView charts. Whether you’re a seasoned trader or just starting out, customizing candle colors based on specific conditions can help you identify trends and patterns more effectively. In this article, we’ll explore how to use Pine Script to change candle colors based on volume, a common requirement for many traders.

Understanding Pine Script Basics
Before diving into the specifics of changing candle colors, it’s essential to understand the basics of Pine Script. Pine Script is a programming language used in TradingView to create custom indicators and strategies. It allows users to manipulate chart elements, including candle colors, based on various conditions such as price movements, volume, or other technical indicators.
Changing Candle Colors Based on Volume

One of the most common reasons to change candle colors is to highlight significant volume changes. This can help traders identify periods of high market activity, which often precede major price movements. Here’s how you can achieve this using Pine Script:
Simplifying Candle Color Customization with Pineify’s Visual Tools

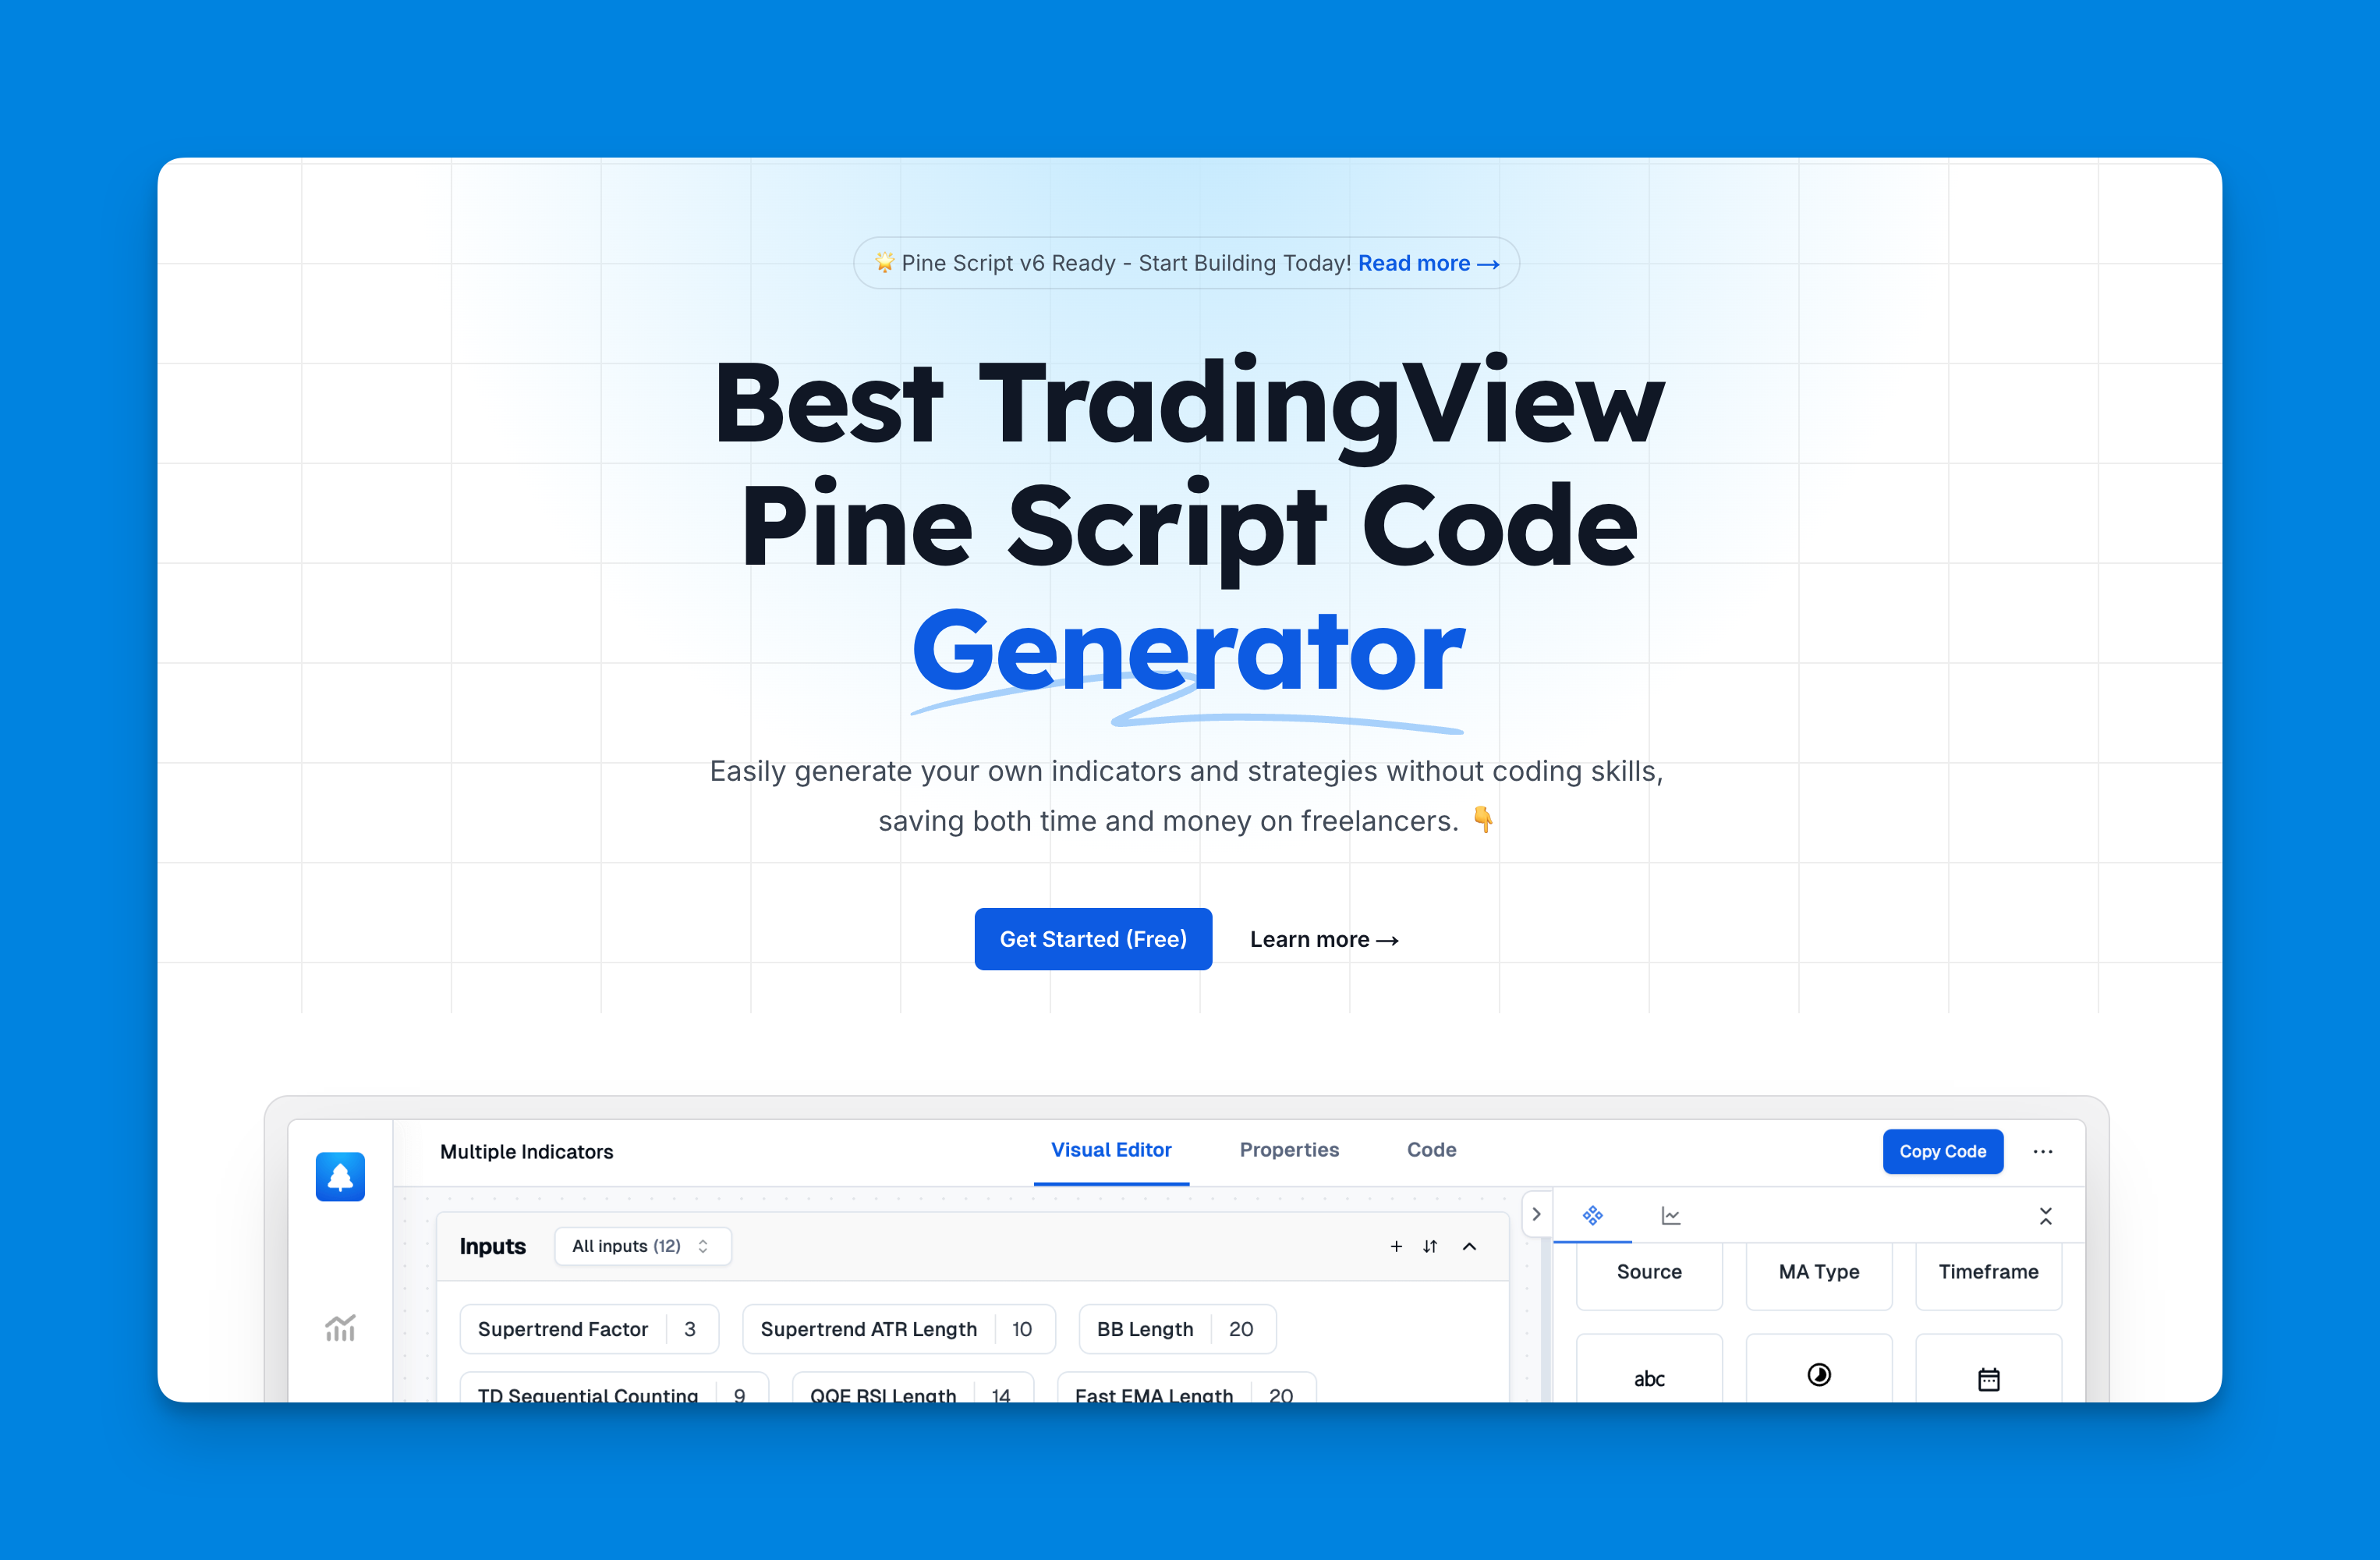
Pineify revolutionizes candle color modification in TradingView charts through its intuitive visual interface, eliminating the need for manual Pine Script coding. The platform's Condition Editor enables traders to dynamically alter candlestick colors based on complex market conditions without writing a single line of code.
Key advantages over manual coding:
| Traditional Method | Pineify Solution |
|---|---|
| Requires Pine Script syntax knowledge | No coding required |
| Limited to 3 indicators (free TV plan) | Unlimited simultaneous conditions |
| Manual error debugging | Automatic error-free scripting |
| Single timeframe implementation | Multi-timeframe support |
Example Code
To change candle colors based on volume, you can use the following Pine Script code:
//@version=5
indicator(title='Volume Candle Indicator', shorttitle="VCI", overlay = true)

// Define volume thresholds
lowVol = 30000
highVol = 100000

// Conditional logic for color assignment
color_volume = if volume >= lowVol and volume < highVol
    color.new(color.yellow, 0) // Yellow for medium volume
else if volume > highVol and close > open
    color.new(color.green, 0) // Green for high volume and rising price
else if volume > highVol and close < open
    color.new(color.red, 0) // Red for high volume and falling price
else
    color.new(color.blue, 0) // Blue for low volume

// Apply the color to the candles
barcolor(color_volume, title='Bar Colors')
How It Works
- Volume Thresholds: The script defines two volume thresholds (
lowVolandhighVol) to categorize volume levels. - Conditional Logic: It uses conditional statements (
if-else) to assign different colors based on volume and price movement. - Color Application: The
barcolorfunction applies these colors to the candles on the chart.
Tips for Effective Use
- Customization: Adjust the volume thresholds and colors according to your trading strategy.
- Combination with Other Indicators: Use this script alongside other indicators to enhance your analysis.
- Testing: Always test scripts in a demo environment before applying them to live trading.
Conclusion
Changing candle colors in Pine Script is a straightforward process that can significantly enhance your trading experience. By following the steps outlined above, you can create custom indicators that highlight important market conditions, helping you make more informed trading decisions.
