TradingView vs StockCharts: Which Platform Is Right for Your Trading Style?
In the competitive world of trading platforms, TradingView and StockCharts stand out as leading options for technical analysis and market research. While both offer powerful charting capabilities, they cater to different trading styles and preferences. This comprehensive comparison will help you determine which platform better suits your trading needs.
Key Features Comparison
Both platforms offer robust charting tools, but with distinct approaches to technical analysis and user experience.
Charting Capabilities
TradingView excels in chart customization, offering interactive, multi-timeframe charts with over 100 technical indicators. Users can apply indicators on top of other indicators and create multi-tab layouts with up to 4 charts per tab (or unlimited for premium users). The platform’s drag-and-drop functionality and real-time updates make it highly flexible for active traders.
StockCharts focuses on traditional technical analysis with classic chart types including candlestick, point & figure, Renko, and Kagi charts. Its SharpCharts feature allows users to apply up to 25 technical indicators per chart, though customization options are somewhat limited compared to TradingView.
Market Coverage
TradingView offers global market coverage across stocks, forex, cryptocurrencies, commodities, and indices. This comprehensive coverage makes it ideal for traders looking to diversify across multiple asset classes.
StockCharts primarily focuses on US markets, making it more suitable for traders concentrated on American securities.
Platform Comparison Table

| Feature | TradingView | StockCharts |
|---|---|---|
| Overall Rating | 4.5/5 | 3.8/5 |
| Chart Customization | Advanced with Pine Script | Traditional with limited customization |
| Market Coverage | Global (stocks, forex, crypto, etc.) | US-focused |
| Social Features | 10 million user community | Limited social components |
| Technical Indicators | 160+ indicators | Traditional indicators |
| Free Version | More functionality | Basic features |
| Ideal For | Active traders, day traders | Long-term investors, swing traders |
| Real-time Data | Comprehensive | Limited |
| Educational Resources | Community-driven | Expert commentary and tutorials |
Enhancing TradingView with Third-Party Tools: The Pineify Advantage
When comparing TradingView and StockCharts, it's worth noting that TradingView's ecosystem supports powerful third-party enhancements like Pineify, which can significantly expand the platform's capabilities.

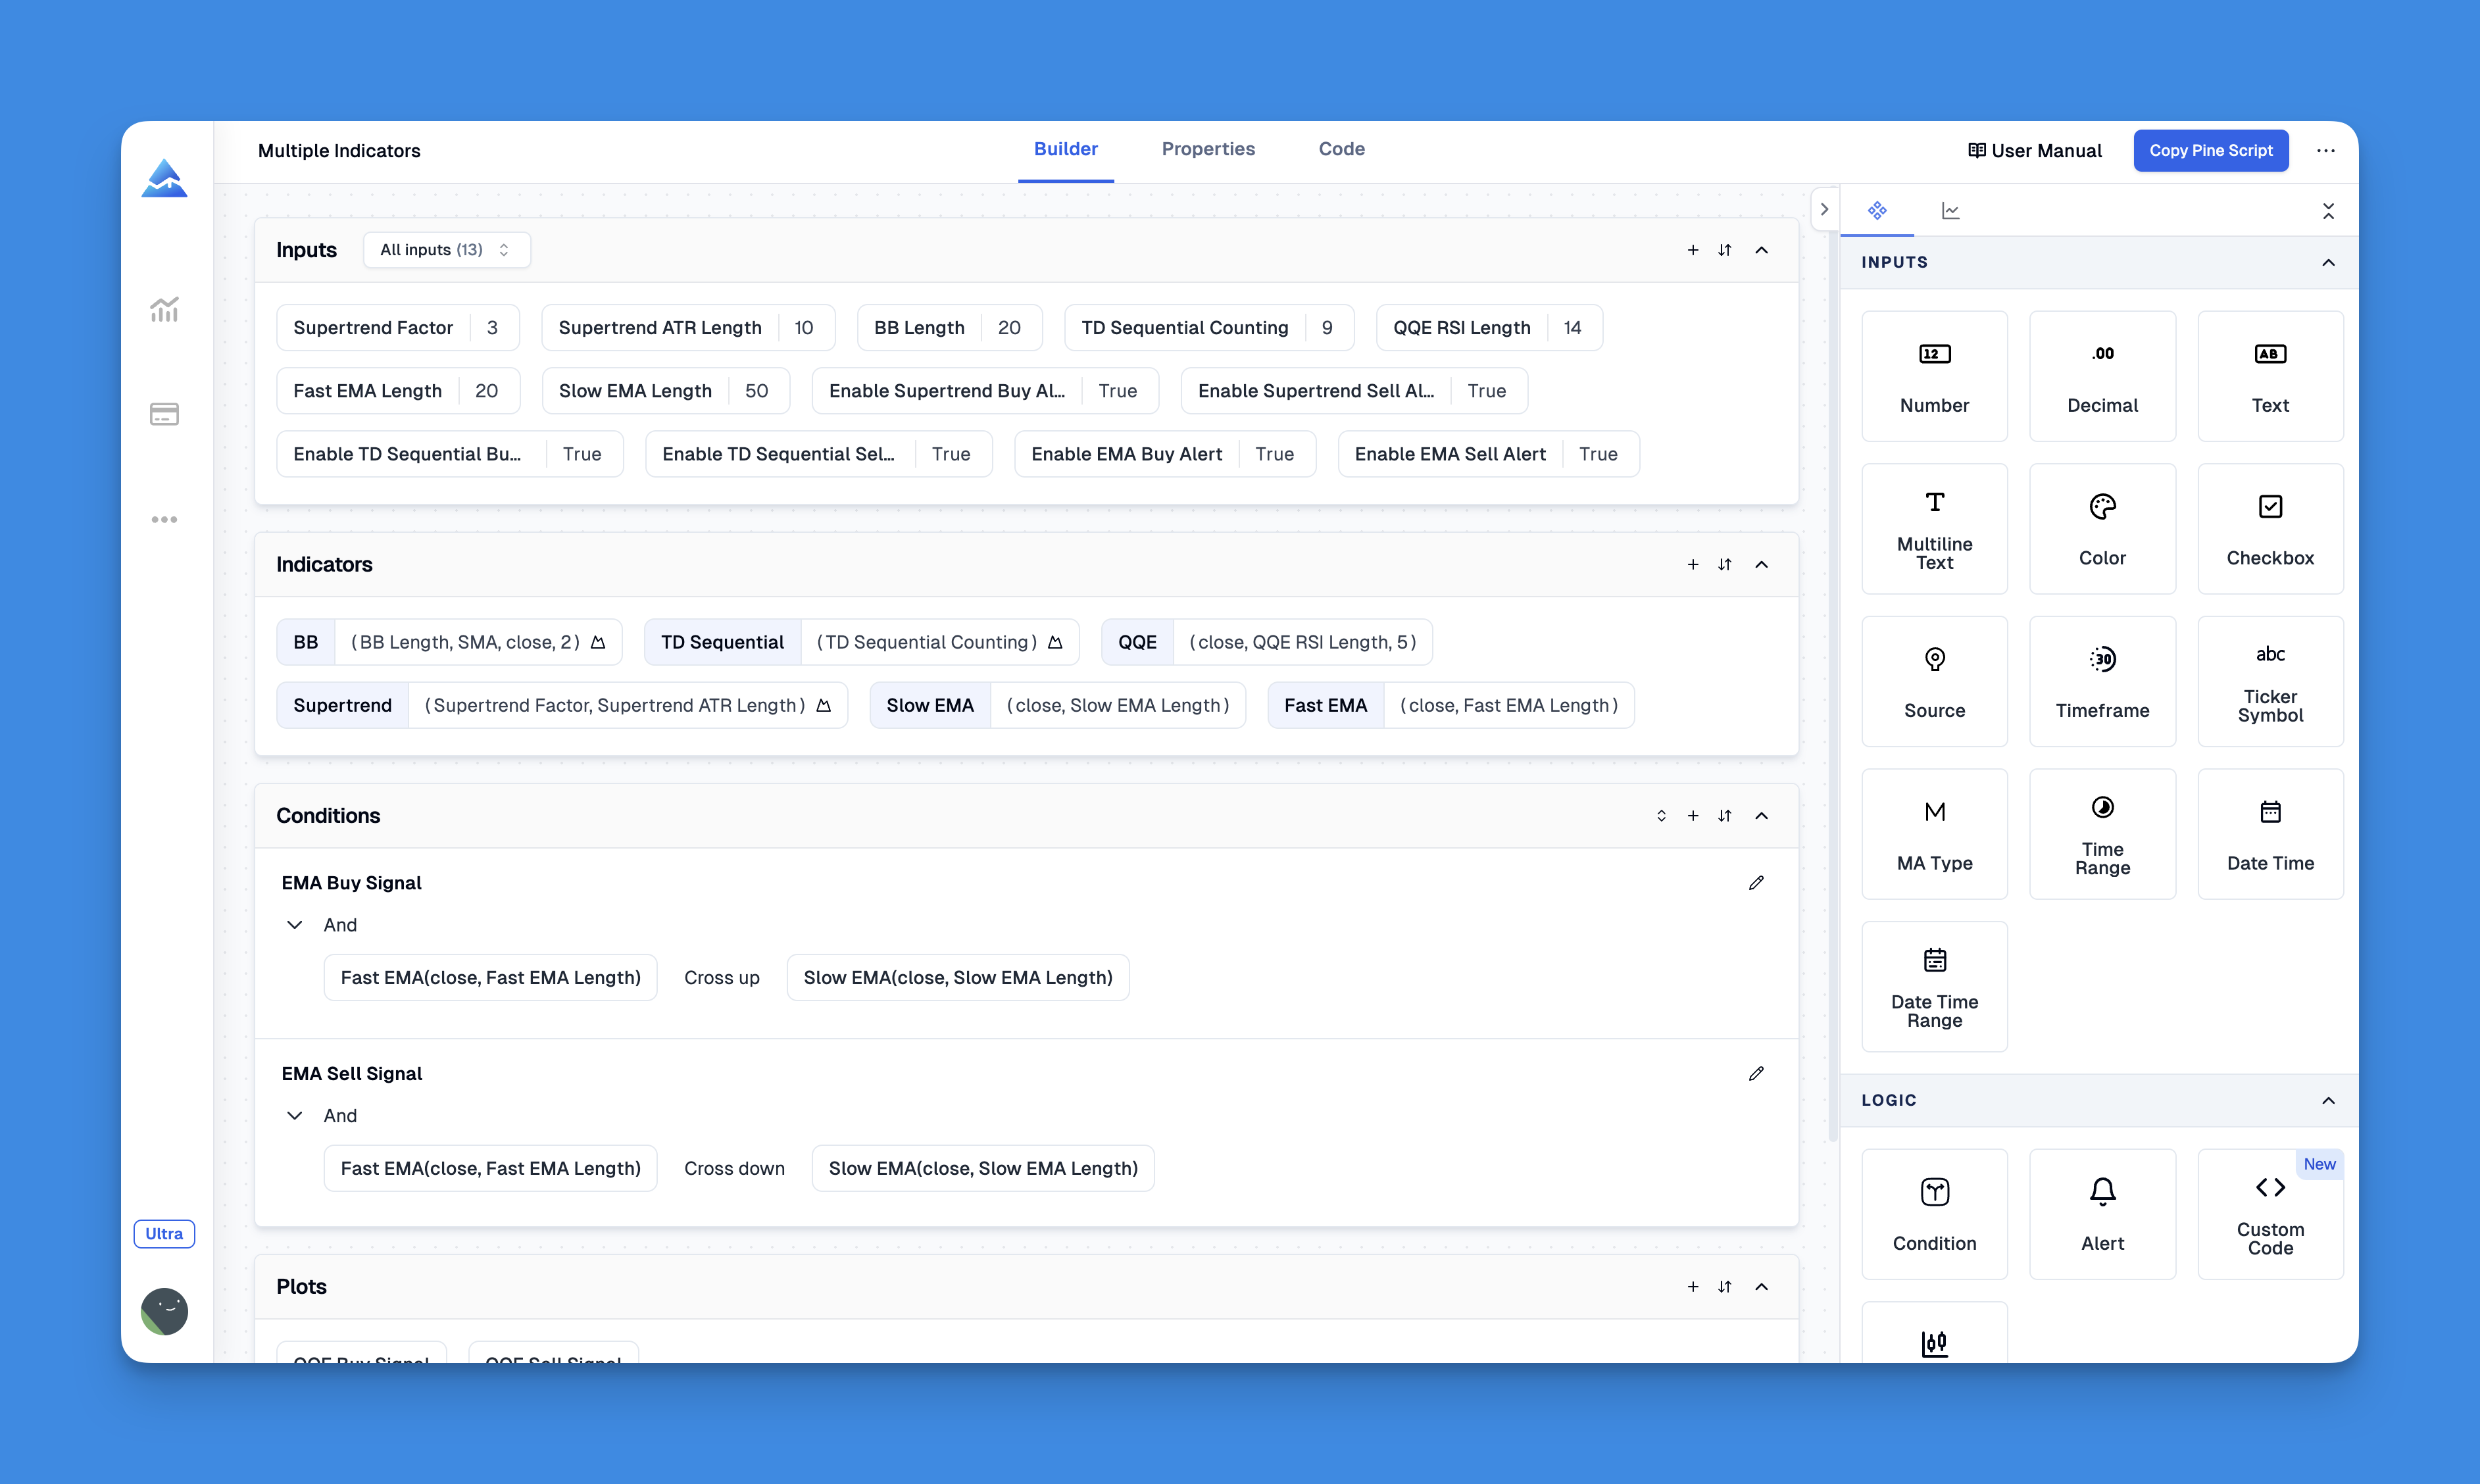
Pineify is a game-changing tool that enables traders to create custom indicators and strategies without any programming knowledge, effectively addressing one of TradingView's limitations1. While TradingView's free plan restricts users to only two indicators per chart, Pineify allows for unlimited indicators, giving traders comprehensive analytical capabilities without upgrading to premium subscriptions. The tool features an intuitive interface with a powerful condition editor where users can combine multiple technical indicators and price data to construct precise trading rules。
Website: Pineify
Click here to view all the features of Pineify.Who Should Choose TradingView?
TradingView is the superior choice for active traders who need:
- Real-time data across multiple global markets
- Advanced chart customization with Pine Script automation
- A social trading community for sharing ideas and strategies
- Comprehensive screening tools with 160 criteria covering both technical and fundamental analysis
- Visually appealing, highly configurable heatmaps
“If you’re serious about day trading or swing trading, choose TradingView for its advanced charting capabilities.”
Who Should Choose StockCharts?
StockCharts is better suited for traders who value:
- Traditional technical analysis methods
- Classic chart types like point & figure and Kagi charts
- Structured, organized approach to technical indicators
- Extensive educational resources and expert commentary
- Technical screening focused on price patterns in candlestick and point-and-figure charts
“StockCharts is best for traders who prioritize classic technical analysis and prefer simplicity over advanced customization.”
Pricing Considerations
Both platforms offer free access with limited functionality. TradingView’s free service provides more features than StockCharts’ free option. Premium subscriptions on both platforms unlock additional capabilities, with TradingView generally offering more value for active traders.
Conclusion
Your choice between TradingView and StockCharts should align with your trading style, market preferences, and analysis needs. TradingView’s modern interface, global market coverage, and advanced customization make it ideal for active traders seeking real-time data and social interaction. StockCharts’ traditional approach and educational resources better serve long-term investors and those focused on classic technical analysis.