ADX Indicator in Pine Script: Code, Strategy & Signals
Ever sat there watching a chart, wondering if that price movement is actually going somewhere or just playing with your emotions? I've been there plenty of times. The Average Directional Index (ADX) is a trend strength indicator that scores market momentum from 0 to 100. It won't tell you which way price is headed, but it will tell you whether there's enough force behind the move to bother trading it.
And the best part? You don't need to be a coding wizard to use it in Pine Script.
What ADX Measures and Why It Matters

Back in 1978, J. Welles Wilder (the same guy who gave us RSI and ATR) created the ADX to solve a problem every trader faces: how do you know if a trend is strong enough to actually trade?
Here's how the numbers break down:
- 0-25: Weak or no trend. Markets are ranging, and you'll likely get chopped up trying to trade breakouts.
- 25-50: Moderate trend strength worth your attention.
- 50-75: Strong trend territory. These moves can really pay off.
- 75-100: Extremely strong trends. Rare, but usually explosive.
ADX works the same whether the market is going up or down. A reading of 60 means strong trend strength in a bull run or a bear market.
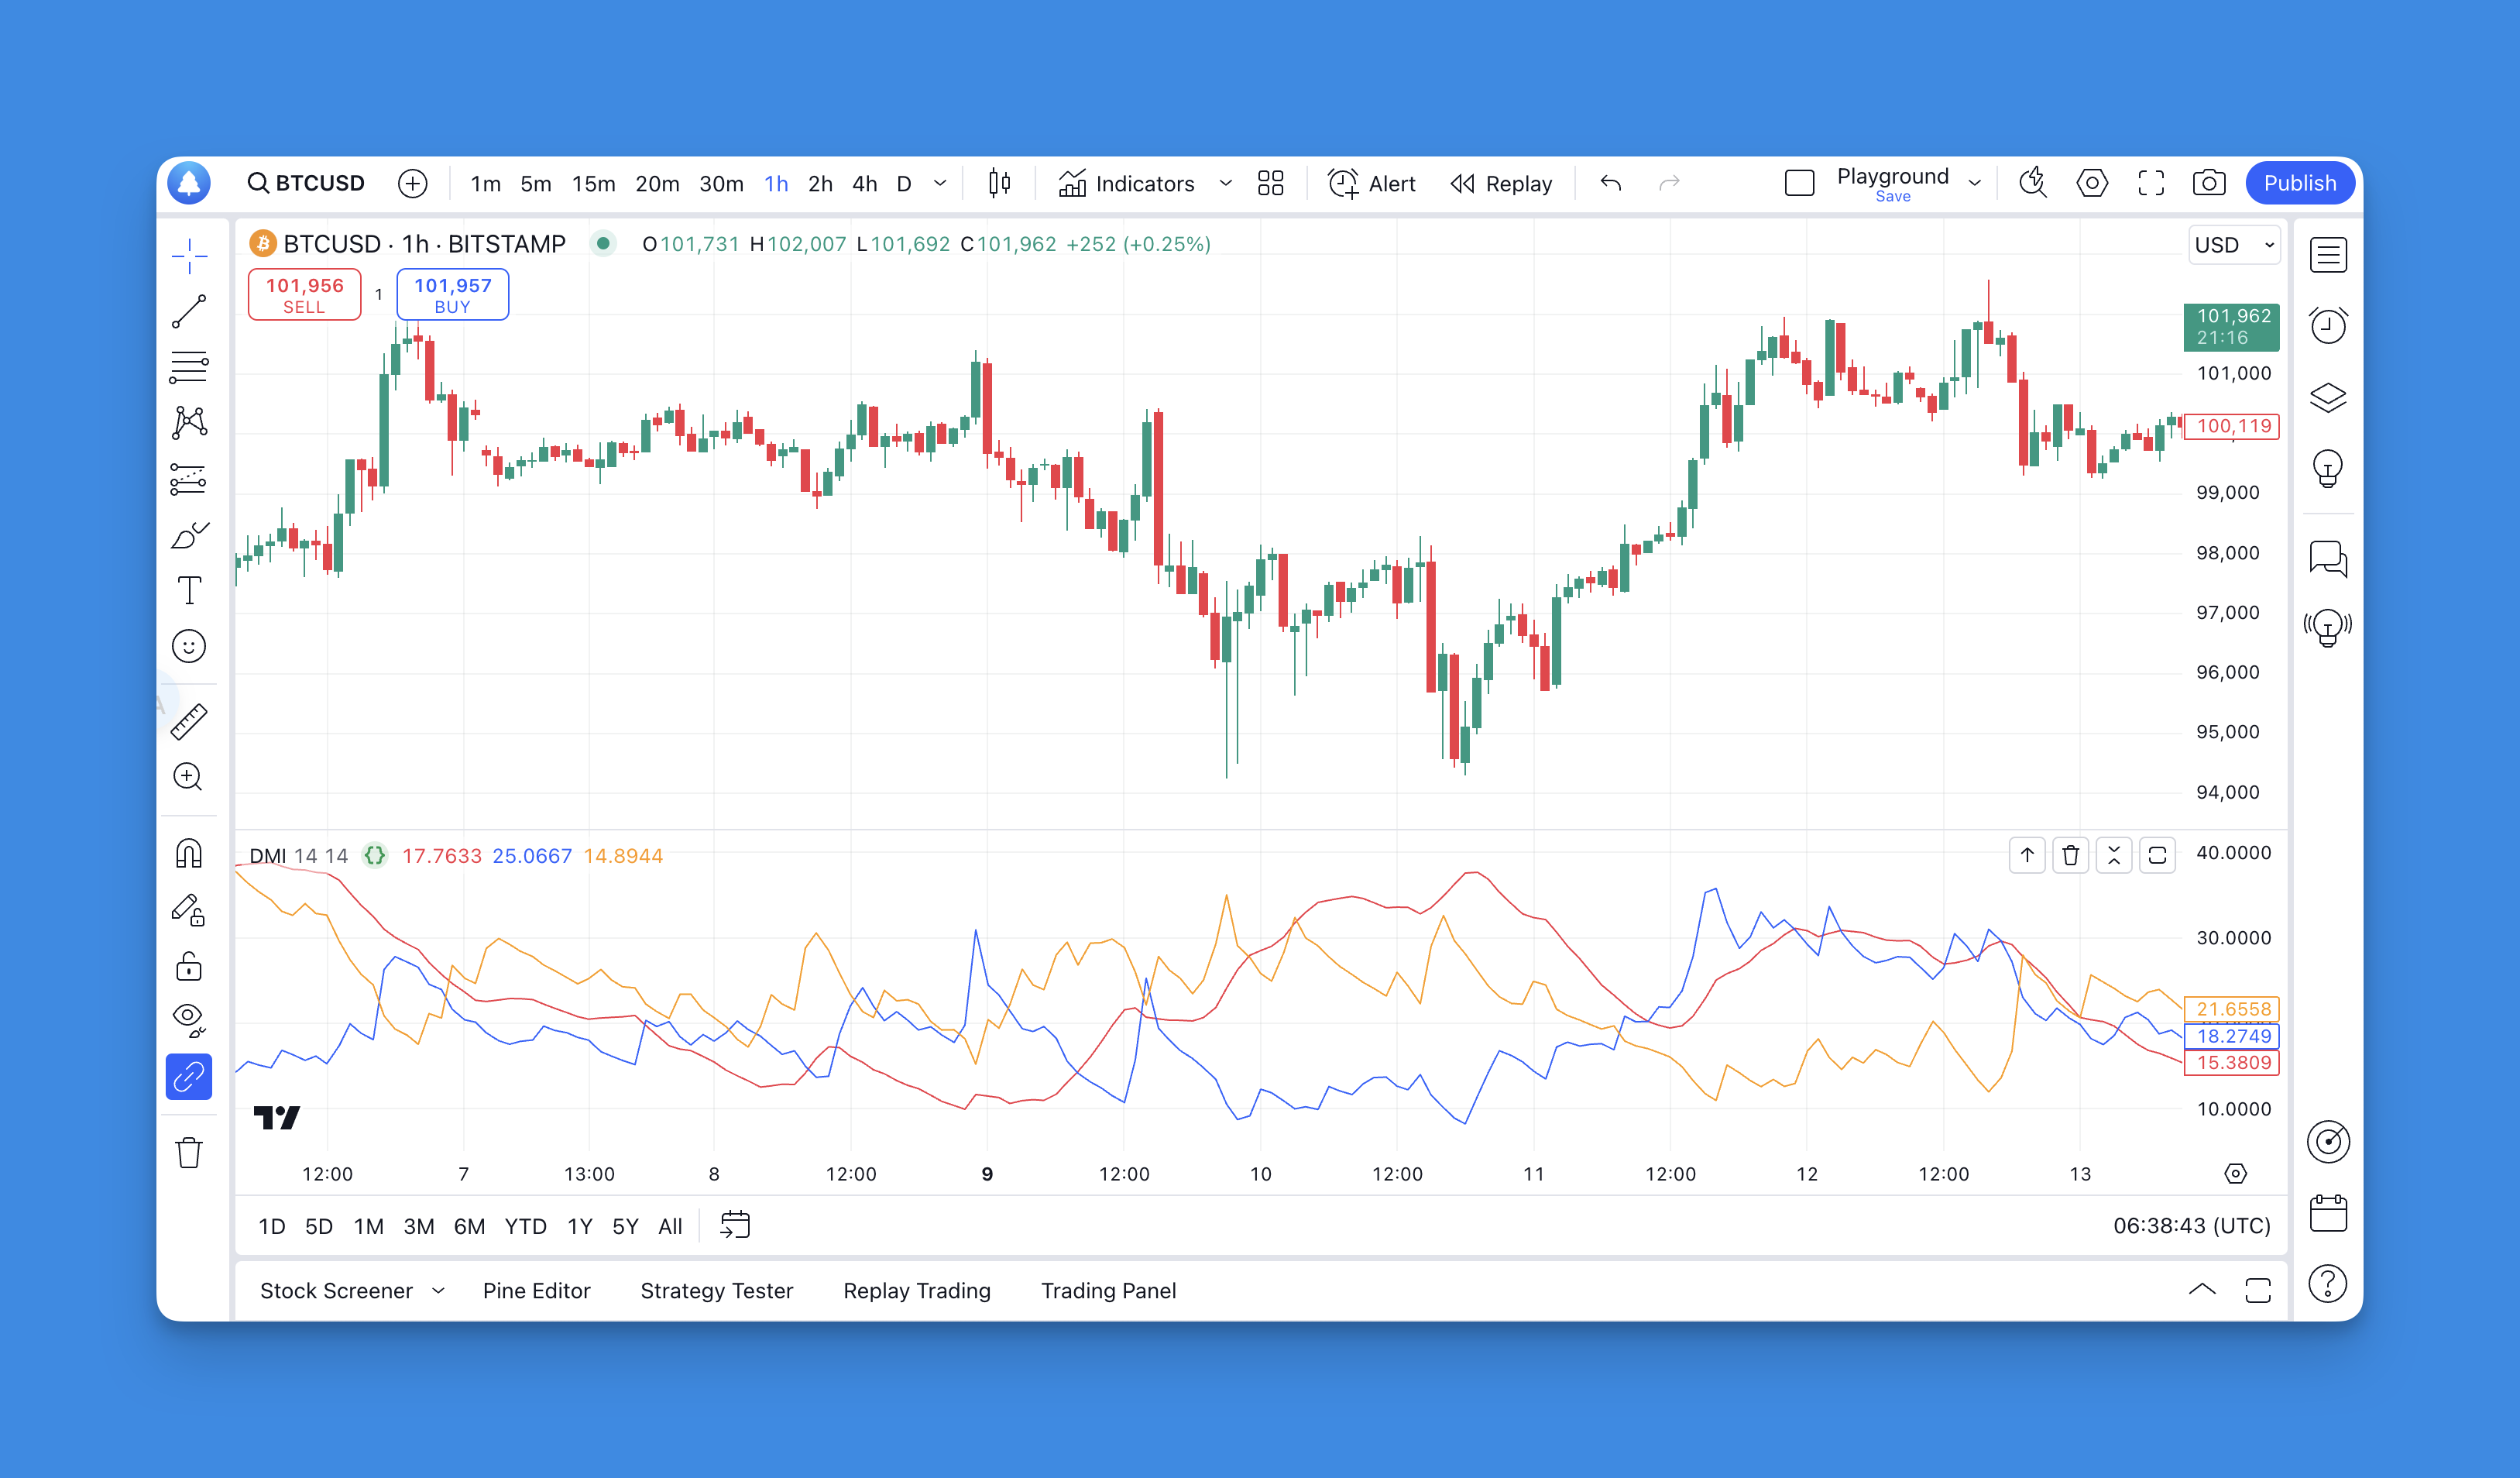
The ADX Family: +DI, -DI, and ADX
ADX doesn't work alone — it's part of a three-indicator system:
+DI (Positive Directional Indicator): Measures upward price pressure. When this line rises, buyers are getting more aggressive.
-DI (Negative Directional Indicator): Measures downward price pressure. A rising -DI means sellers are in control.
ADX: The strength meter that tells you how intense the battle between bulls and bears is.
The magic is in combining all three. When +DI is above -DI and ADX is rising above 25, you've got a strong uptrend. When -DI is above +DI with ADX climbing, it's a strong downtrend.
Coding ADX in Pine Script: The Easy Way
If you want to add ADX to your TradingView charts using Pine Script, you're in luck. Pine Script has a built-in function that handles all the heavy lifting:
ta.dmi(diLength, adxSmoothing) → [series float, series float, series float]
This function returns three values: +DI, -DI, and ADX. Here's a complete example:
// This source code is subject to the terms of the Mozilla Public License 2.0 at https://mozilla.org/MPL/2.0/
// © Pineify

//@version=6
indicator(title="ADX Trend Strength Monitor", shorttitle="ADX", format=format.price, precision=2, overlay=false)

// Input parameters
len = input.int(14, minval=1, title="DI Length", tooltip="Period for directional movement calculation")
lensig = input.int(14, title="ADX Smoothing", minval=1, maxval=50, tooltip="Smoothing period for ADX line")

// Calculate ADX and directional indicators
[diplus, diminus, adx] = ta.dmi(len, lensig)

// Plot the indicators
plot(adx, color=color.red, linewidth=2, title="ADX")
plot(diplus, color=color.lime, title="+DI")
plot(diminus, color=color.orange, title="-DI")

// Add horizontal reference lines
hline(25, "ADX 25", color=color.gray, linestyle=hline.style_dashed)
hline(50, "ADX 50", color=color.gray, linestyle=hline.style_dashed)

// Color background based on trend strength
bgcolor(adx > 50 ? color.new(color.green, 90) : adx > 25 ? color.new(color.yellow, 95) : color.new(color.red, 95))
This creates a clean ADX indicator with background coloring that makes trend strength obvious at a glance. The background turns green for strong trends (ADX > 50), yellow for moderate trends (ADX 25-50), and red for weak trends (ADX < 25).
Here's how different timeframe settings affect ADX behavior:
| Timeframe | DI Length | ADX Smoothing | Notes |
|---|---|---|---|
| 1m–15m (scalping) | 7 | 7 | Faster response for quick entries |
| 1h–4h (day trading) | 14 | 14 | Standard setting, balanced |
| Daily (swing) | 14 | 14 | Default works well for most |
| Weekly (position) | 21 | 21 | Smoother, fewer false signals |
ADX Trading Strategies I've Actually Tested
I've tested these setups on AAPL daily charts and EURUSD on the 4-hour timeframe. Here are the combinations that worked best for me:
Strategy 1: ADX + Moving Average Crossover
This is my bread and butter. Wait for:
- ADX to climb above 25 (confirming trend strength)
- A moving average crossover in the same direction as +DI/-DI
- Enter on the pullback to the moving average
Why this works: You're only taking trades when there's confirmed trend strength, not just any old crossover. I prefer using the 50-period SMA alongside ADX for daily charts.
Strategy 2: ADX Divergence
When ADX tells a different story than price, pay attention. If price makes new highs but ADX is declining, the trend is losing steam. I saw this play out on TSLA in March 2025 — price broke resistance but ADX stayed below 25. The fakeout cost a lot of people money.
Combine this with RSI divergence patterns for even better results. I haven't tested this on crypto pairs yet, so I can't vouch for it there.
Strategy 3: ADX + Bollinger Bands
When ADX is under 25, markets tend to range. Perfect for Bollinger Bands mean reversion strategies. When ADX climbs above 25, switch to trend-following mode. This switch is something I've been using on SPY since late 2024.
Common ADX Mistakes (And How to Avoid Them)
After years of using ADX, here are the mistakes I see traders make repeatedly:
Mistake #1: Trading every +DI/-DI crossover Don't do this. Wait for ADX to be above 25 first. I learned this the expensive way during a choppy month in 2023 where I ignored ADX readings and got wrecked on six straight trades.
Mistake #2: Expecting ADX to predict direction ADX measures strength, not direction. A high ADX reading just means there's a strong trend — it could go up or down.
Mistake #3: Using default settings everywhere The standard 14-period setting works for daily charts, but you might need to adjust. For scalping, I use 7. For swing trading, 21 works better. I don't use ADX on crypto below the 1-hour chart — it's too noisy.
Mistake #4: Ignoring market context ADX behaves differently in trending versus ranging markets. In forex, EURUSD trends differently from GBPJPY. I adjust my ADX thresholds depending on the pair.
Combining ADX With Other Indicators
ADX becomes more powerful when you pair it with other tools:
ADX + ATR for Position Sizing: Use ATR (Average True Range) to set stop loss distance, then let ADX determine position size. Higher ADX readings can justify larger positions since the trend is more reliable.
ADX + Volume: Strong ADX readings confirmed by high volume are far more reliable than ADX spikes on low volume. I skip trades where ADX pops above 25 but volume is flat.
ADX + Support/Resistance: ADX breaking above 25 at key support or resistance levels often produces the strongest moves.
Advanced ADX Techniques in Pine Script
If you're comfortable with Pine Script, here are some techniques worth trying:
Multi-Timeframe ADX: Use request.security() to pull ADX readings from higher timeframes. I run this on my daily charts to check the weekly trend before taking a position.
ADX-Based Alerts: Set up alerts when ADX crosses above 25 with +DI above -DI. This catches trend starts without staring at charts all day.
Dynamic ADX Thresholds: Instead of fixed levels like 25 and 50, create thresholds based on recent ADX behavior. I experimented with this on NQ futures but found the static levels worked just as well for my style.
I'm not going to claim ADX is a magic indicator. What I will say is this: after using it since 2022, it's become one of my most trusted filters. It's saved me from countless bad trades in choppy markets and helped me hold positions longer than I would have otherwise. If you're the type of trader who gets shaken out of good positions too early, ADX might be exactly what you're missing.
The key is using ADX as part of a complete system, not as a standalone signal. Combine it with momentum indicators, support and resistance, and proper risk management. If you're new to Pine Script, check out our Pine Script tutorial guide or explore some of the best free TradingView indicators that incorporate ADX in their logic.
Markets will always have noise. ADX helps you focus on the signals that actually matter.
References:
- https://docs.algotest.in/signals/pinescripts/adx_strategy/
- https://pineify.app/resources/blog/pine-script-tadmi-a-complete-guide
- https://www.youtube.com/watch?v=kqsi5XDqR1M
- https://www.youtube.com/watch?v=i6pvoXo_XyI
- https://stackoverflow.com/questions/75828537/i-want-to-make-a-pinescript-v5-strategy-with-adx-and-rsi-but-keep-receiving-the/75828581
- https://github.com/yaoyao-wang/dmi_and_adx
- https://www.tradingview.com/scripts/averagedirectionalindex/
- https://www.youtube.com/watch?v=Xde-JGbDeAo
- https://www.investopedia.com/terms/d/dmi.asp
- https://www.tradingview.com/scripts/directionalmovement/
Frequently Asked Questions
▶What is the ADX indicator and what does it measure?
ADX is a trend strength indicator created by J. Welles Wilder back in 1978. It scores trends from 0 to 100 — but it won't tell you which way price is heading. A reading below 25 means the market is ranging or weak. Between 25 and 50 signals a moderate trend. Above 50? You're looking at a strong move.
▶How do I add ADX to a TradingView chart using Pine Script?
Call ta.dmi() in Pine Script v6 like this: [diplus, diminus, adx] = ta.dmi(len, lensig). It gives you +DI, -DI, and ADX values. Then use plot() for each one and add hline() at 25 and 50 to mark the key zones.
▶What are the recommended ADX settings for different timeframes?
The default 14-period setting is fine for daily charts. On lower timeframes I'd go shorter — try 7 or 10 for 1m–15m charts. For weekly swing trades, bump it to 21 to filter out noise. Always backtest your setting before trading with real money.
▶What is the difference between ADX, +DI, and -DI?
ADX tells you how strong the trend is, no matter which direction. +DI tracks upward price pressure. -DI tracks downward pressure. Together they form the DMI system. When +DI crosses above -DI and ADX is above 25, that's a potential long entry.
▶Can ADX be used as a standalone trading signal?
I wouldn't recommend it. ADX tells you if a trend has enough strength to trade, but not which direction. Pair it with moving averages, +DI/-DI crossovers, or support and resistance for actual entry and exit signals.
▶How do I set up ADX-based alerts in Pine Script on TradingView?
Use alertcondition() after computing ADX with ta.dmi(). Something like: alertcondition(ta.crossover(adx, 25) and diplus > diminus, title="ADX Uptrend Alert", message="ADX crossed 25 with bullish DMI"). This fires when ADX crosses above 25 with +DI leading.
▶What are the limitations of the ADX indicator?
ADX lags — it confirms trend strength after the move has started, not in real time. It also gives false signals in choppy markets and doesn't tell you direction on its own. You need +DI and -DI for context. It works best in markets with clear trends, not tight ranges.