Pine Script ta.dmi: Guide & Strategies
The Directional Movement Index (DMI) is a widely used technical analysis indicator that measures both the strength and direction of price trends. In TradingView's Pine Script, the ta.dmi() function simplifies the process of integrating this powerful tool into custom indicators and strategies. This article will provide an in-depth exploration of the ta.dmi() function, its syntax, practical applications, and how to use it effectively in trading strategies.
What is the Directional Movement Index (DMI)?
The Directional Movement Index (DMI), developed by J. Welles Wilder in 1978, is a trend-following indicator that evaluates the strength and direction of a market trend. It consists of three components:
- +DI (Positive Directional Indicator): Measures upward price movement.
- DI (Negative Directional Indicator): Measures downward price movement.
- ADX (Average Directional Index): Quantifies the strength of the trend, regardless of its direction.
Key Features

- The DMI helps traders identify whether a market is trending or ranging.
- Crossovers between +DI and -DI generate potential buy or sell signals.
- The ADX value indicates trend strength:
- ADX > 25: Strong trend.
- ADX < 20: Weak or no trend.
Understanding ta.dmi() in Pine Script
The ta.dmi() function in Pine Script simplifies the calculation of DMI components and integrates them into custom indicators or strategies.
Syntax
ta.dmi(diLength, adxSmoothing) → [series float, series float, series float]
Arguments
diLength(int): The period for calculating +DI and -DI values.adxSmoothing(int): The smoothing period for the ADX calculation.
Returns
A tuple containing three series:
+DI(Positive Directional Indicator)DI(Negative Directional Indicator)ADX(Average Directional Index)
Example: Creating a DMI Indicator
Below is an example of how to use ta.dmi() to create a DMI indicator in Pine Script:
// This source code is subject to the terms of the Mozilla Public License 2.0 at https://mozilla.org/MPL/2.0/
// © Pineify

//======================================================================//
//                    ____  _            _  __                          //
//                   |  _ \(_)_ __   ___(_)/ _|_   _                    //
//                   | |_) | | '_ \ / _ \ | |_| | | |                   //
//                   |  __/| | | | |  __/ |  _| |_| |                   //
//                   |_|   |_|_| |_|\___|_|_|  \__, |                   //
//                                             |___/                    //
//======================================================================//

//@version=6
indicator(title="[Pineify - Best Pine Script Generator] Directional Movement Index", shorttitle="DMI", format=format.price, precision=4)

// Input parameters
diLength = input.int(17, minval=1, title="DI Length")
adxSmoothing = input.int(14, minval=1, maxval=50, title="ADX Smoothing")

// Calculate DMI components
[diplus, diminus, adx] = ta.dmi(diLength, adxSmoothing)

// Plot the results
plot(adx, color=color.red, title="ADX")
plot(diplus, color=color.blue, title="+DI")
plot(diminus, color=color.orange, title="-DI")
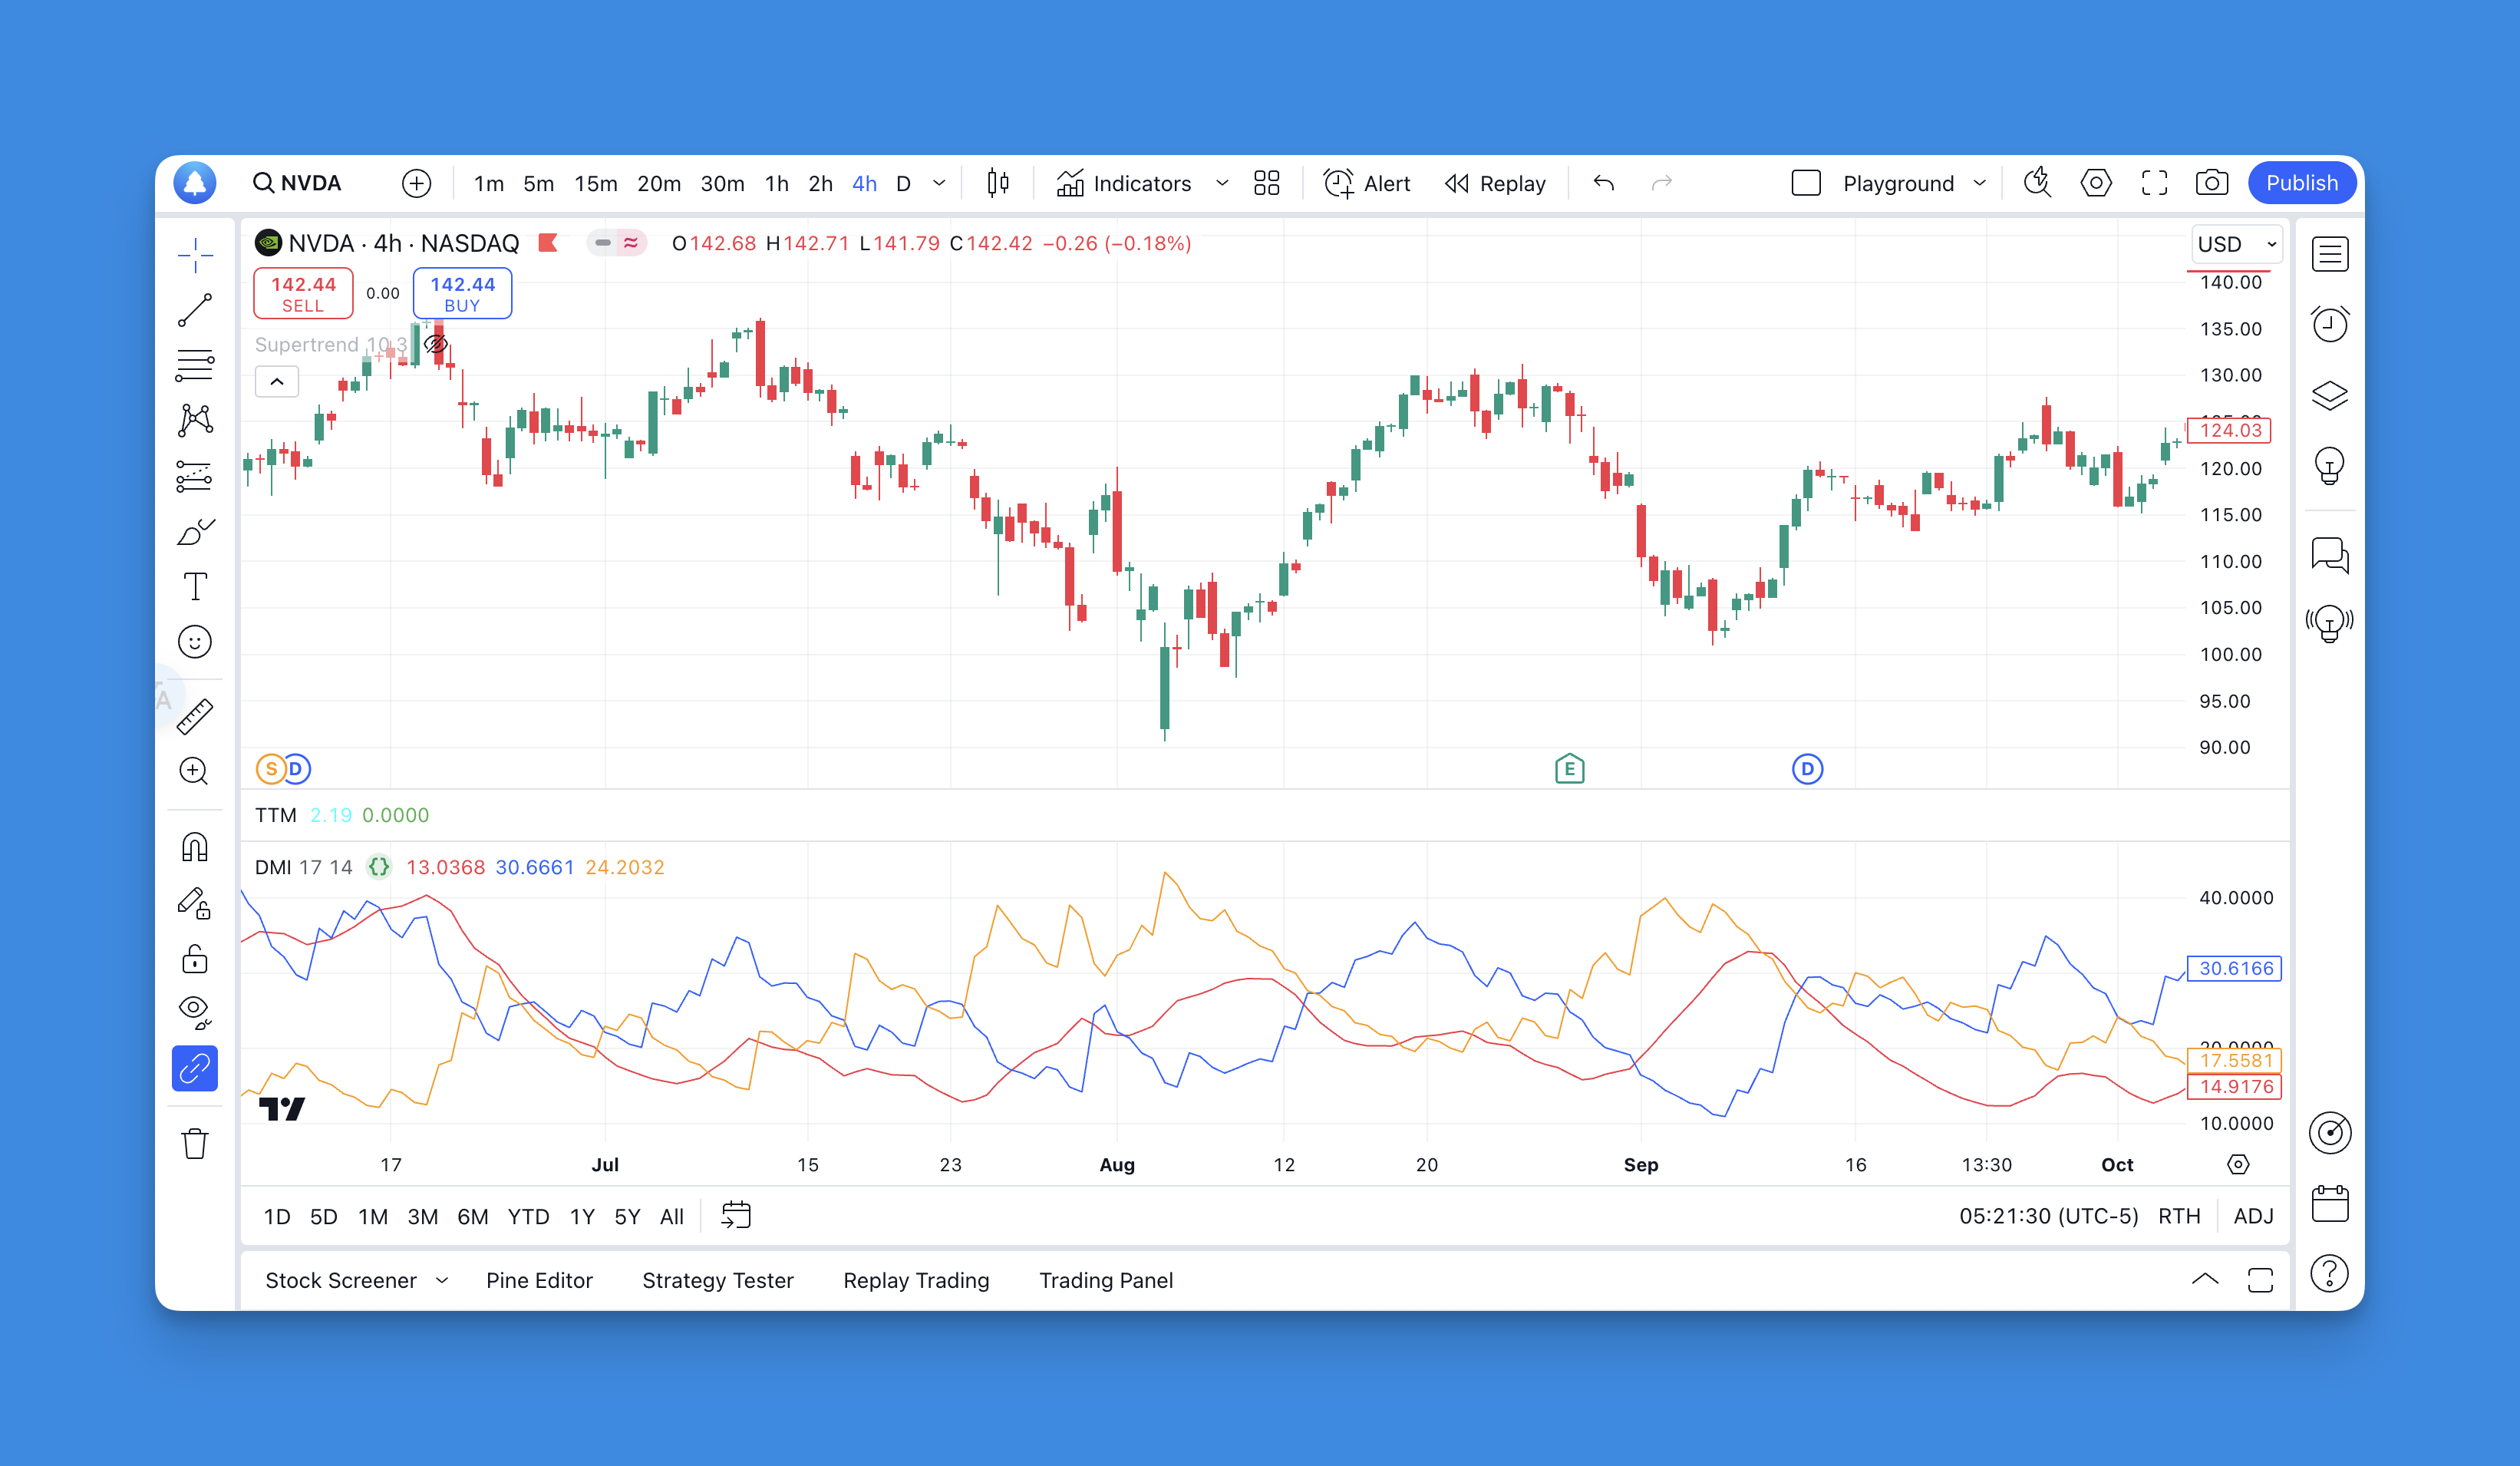
Explanation
- The script calculates +DI, -DI, and ADX using user-defined input lengths.
- These values are plotted on a separate chart pane for easy visualization.
How to Use DMI in Trading Strategies
The DMI can be used in various ways to generate trading signals or confirm trends. Below are some common strategies:
1. Basic Crossover Strategy
- A buy signal occurs when +DI crosses above -DI.
- A sell signal occurs when -DI crosses above +DI.
Example:
if ta.crossover(diplus, diminus)
    strategy.entry("Buy", strategy.long)

if ta.crossunder(diplus, diminus)
    strategy.close("Buy")
2. Trend Confirmation with ADX
To filter false signals:
- Only trade when ADX > 25 (indicating a strong trend).
Example:
if ta.crossover(diplus, diminus) and adx > 25
    strategy.entry("Buy", strategy.long)

if ta.crossunder(diplus, diminus) and adx > 25
    strategy.close("Buy")
3. Combining with Other Indicators
The DMI can be combined with moving averages or RSI for more robust strategies:
- Use moving averages to determine the larger trend direction.
- Use RSI to identify overbought/oversold conditions before executing trades based on DMI signals.
Advantages of Using ta.dmi()
- Built-in Functionality: Simplifies complex calculations for +DI, -DI, and ADX.
- Customizable Inputs: Allows traders to adjust periods for different market conditions.
- Versatility: Can be integrated into various strategies for trend identification and confirmation.
Limitations of DMI
While powerful, the DMI has some limitations:
- Prone to false signals during choppy or ranging markets.
- Requires additional filters (e.g., ADX threshold) to reduce noise.
- Historical data-based calculations may not always predict future price movements accurately.
To mitigate these issues:
- Combine DMI with other indicators like moving averages or Bollinger Bands.
- Use higher timeframes for trend confirmation.
Best Practices for Using ta.dmi()
- Optimize Parameters: Experiment with different values for
diLengthandadxSmoothingto suit specific assets or timeframes. - Backtest Strategies: Use TradingView's backtesting feature to evaluate performance over historical data.
- Combine with Risk Management: Always incorporate stop-loss and take-profit levels to manage risk effectively.
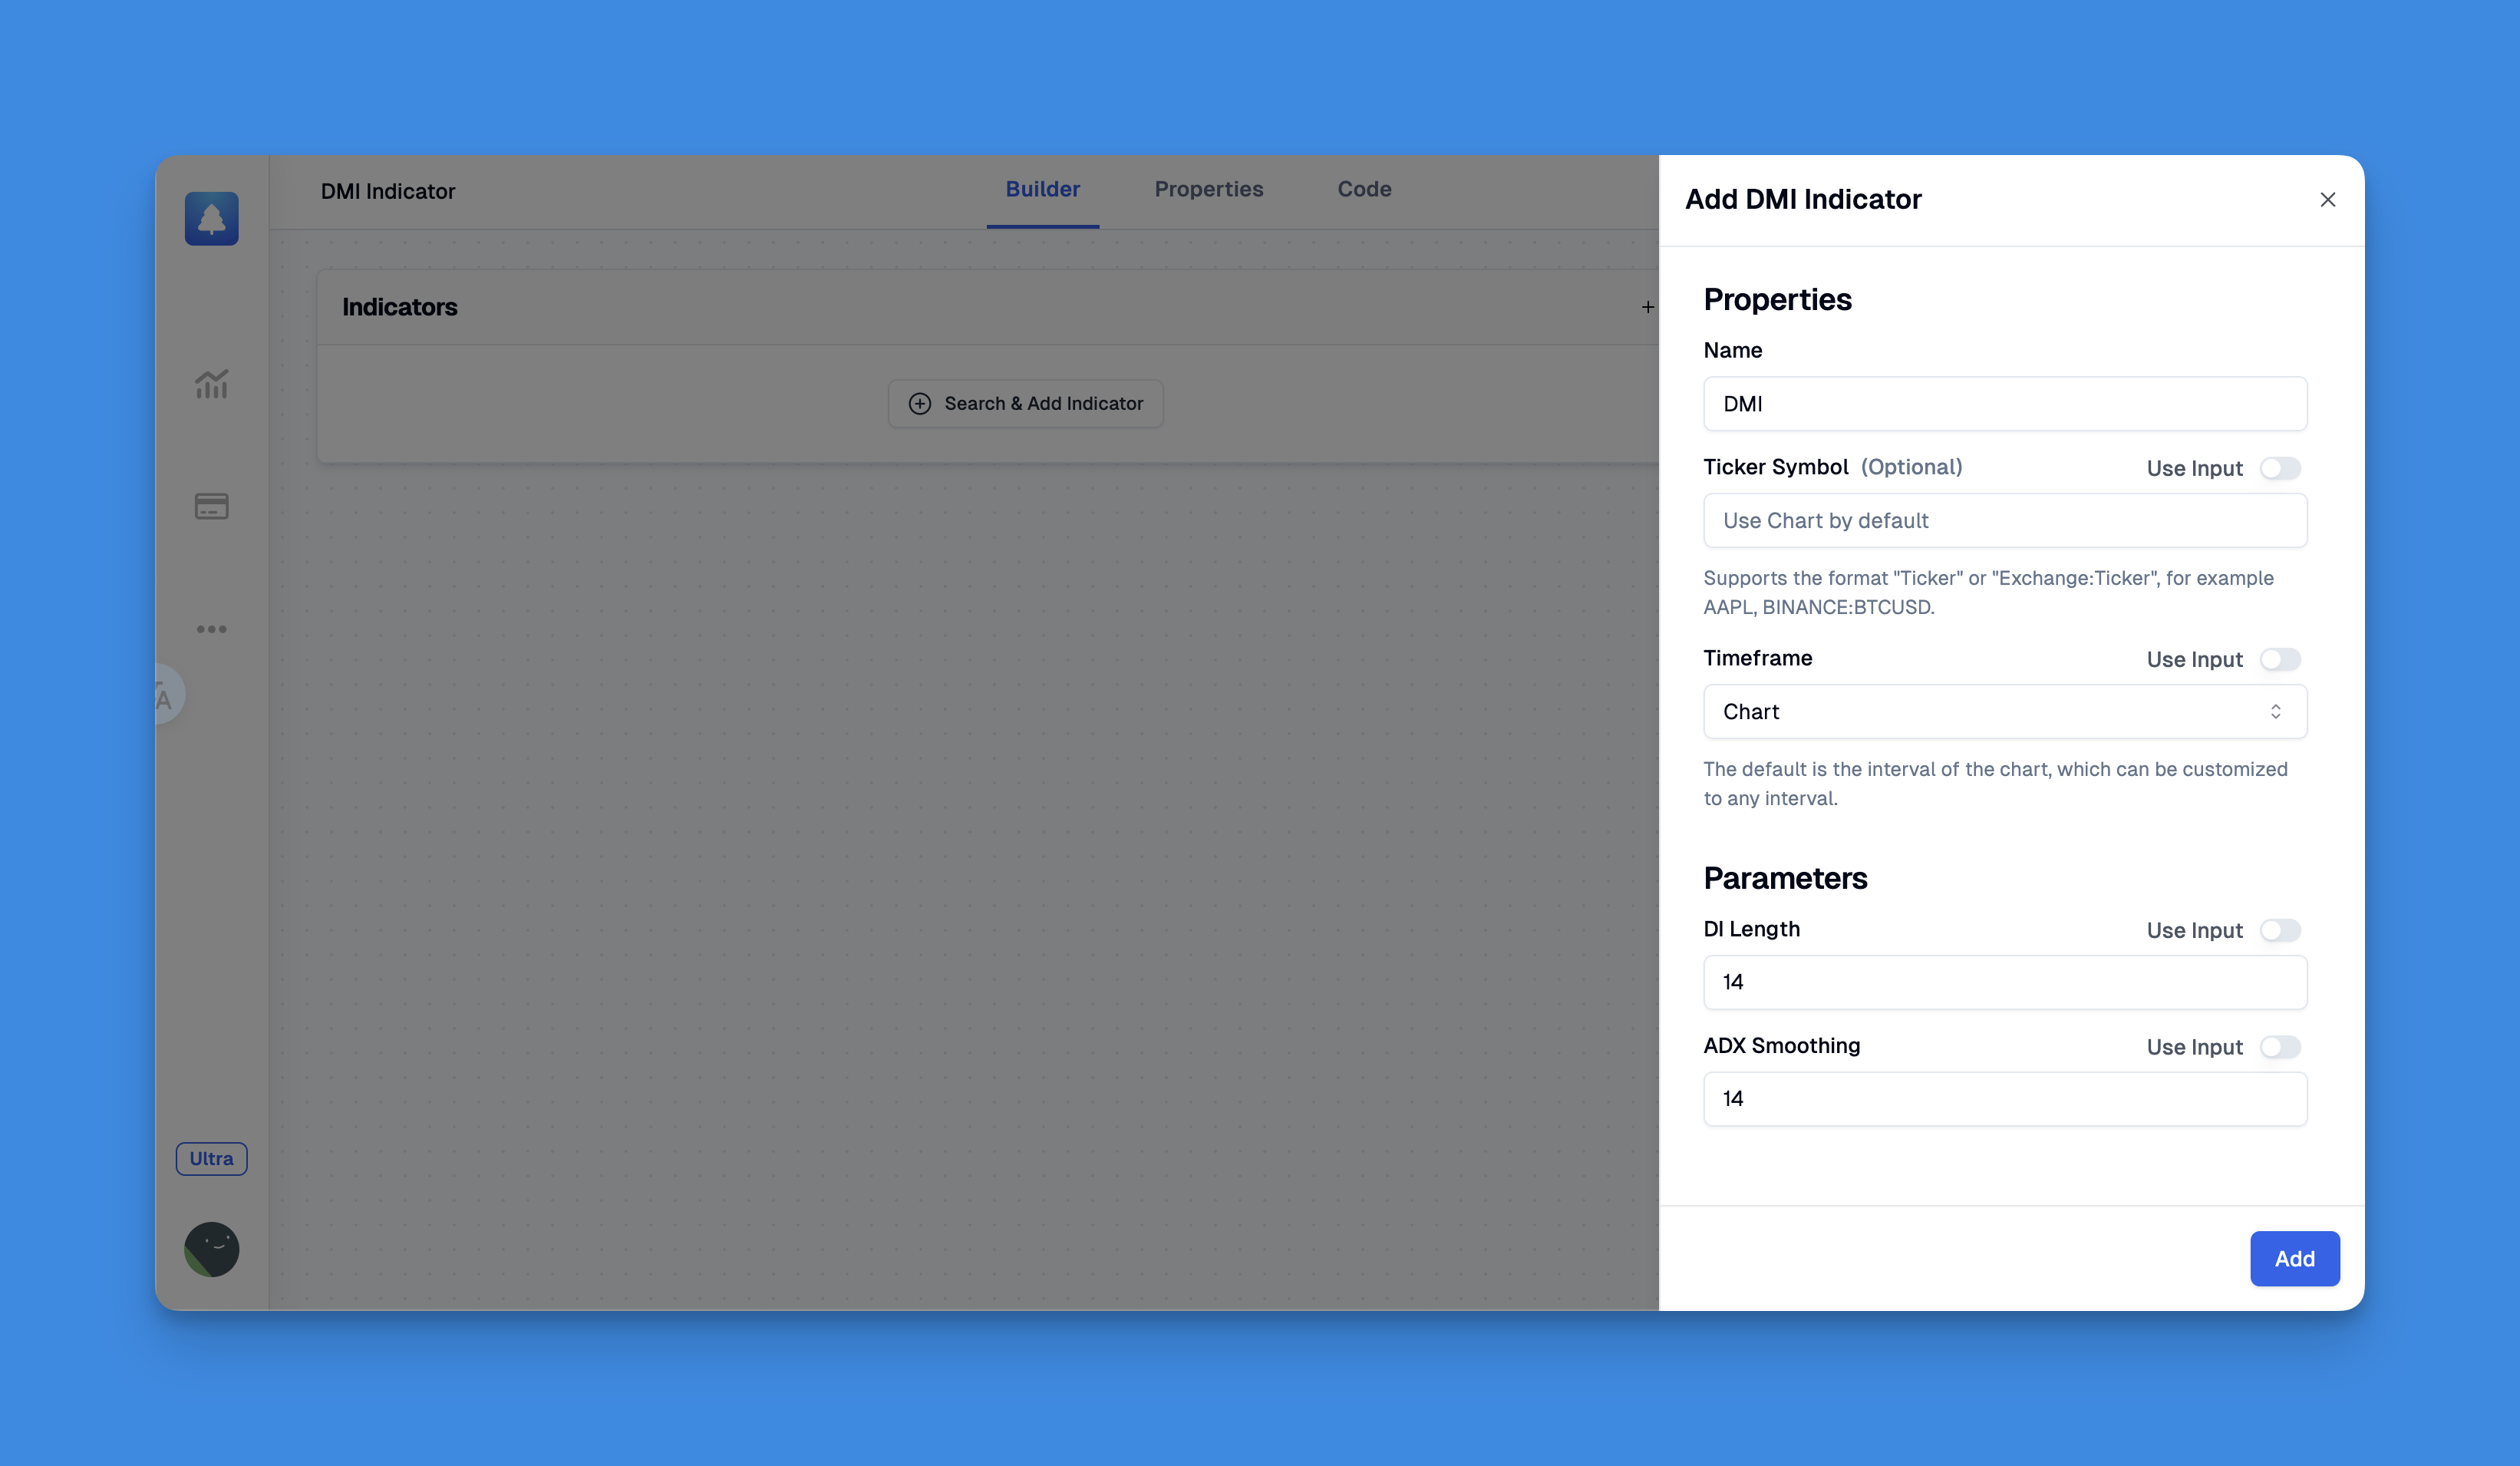
Generate DMI Indicator with Pineify

Website: Pineify
Creating advanced trading indicators like the Directional Movement Index (DMI) can be a challenging task for individuals unfamiliar with Pine Script coding. Pineify revolutionizes this process by enabling traders to design custom indicators, such as the DMI, without writing a single line of code.
 Click here to view all the features of Pineify.
Conclusion
The ta.dmi() function in Pine Script is an essential tool for traders looking to harness the power of the Directional Movement Index in their trading strategies. By understanding its components (+DI, -DI, and ADX) and applying them effectively through custom scripts, traders can gain valuable insights into market trends and improve their decision-making process.
Whether you're building a simple crossover strategy or combining it with other indicators for advanced setups, mastering ta.dmi() opens up a world of possibilities in technical analysis.
References:
- https://www.youtube.com/watch?v=O2cqSkot0jg
- https://github.com/yaoyao-wang/dmi_and_adx
- https://www.investopedia.com/terms/d/dmi.asp
- https://pineify.app/resources/blog/tradingview-pine-script-editor-guide
- https://www.tradingview.com/scripts/directionalmovement/
- https://www.forex.com/en/learn-trading/pine-script-user-guide-tradingview/