Understanding Pine Script's plotarrow Function
In the world of trading and technical analysis, visual indicators can significantly enhance chart interpretation. Pine Script, TradingView’s proprietary programming language, offers a powerful function called plotarrow() that allows traders to visually represent market data changes through directional arrows on their charts.
What is the plotarrow Function?
The plotarrow() function draws arrows on your chart based on data values:
- Up arrows appear for positive values
- Down arrows appear for negative values
- No arrows are displayed when the value is zero or
na
The height of each arrow is proportional to the absolute value of the data—larger values create longer arrows, making significant market movements immediately visible.
Syntax and Parameters

The basic syntax for the plotarrow() function is:
plotarrow(series, title, colorup, colordown, offset, minheight, maxheight, editable, show_last, display)
Let’s break down the key parameters:
- series: Required parameter that contains the data to be plotted as arrows
- title: The name of your plot
- colorup: Sets the color for up arrows
- colordown: Sets the color for down arrows
- minheight: Sets the minimum arrow height in pixels (default is 5)
- maxheight: Sets the maximum arrow height in pixels (default is 100)
- offset: Shifts arrows left or right by the specified number of bars
Visualizing Trade Signals with plotarrow: A No-Code Approach
The plotarrow function in Pine Script creates visual up or down arrows on TradingView charts to mark entry and exit points. While traditionally requiring code, tools like Pineify now make it possible to add these arrows without programming.
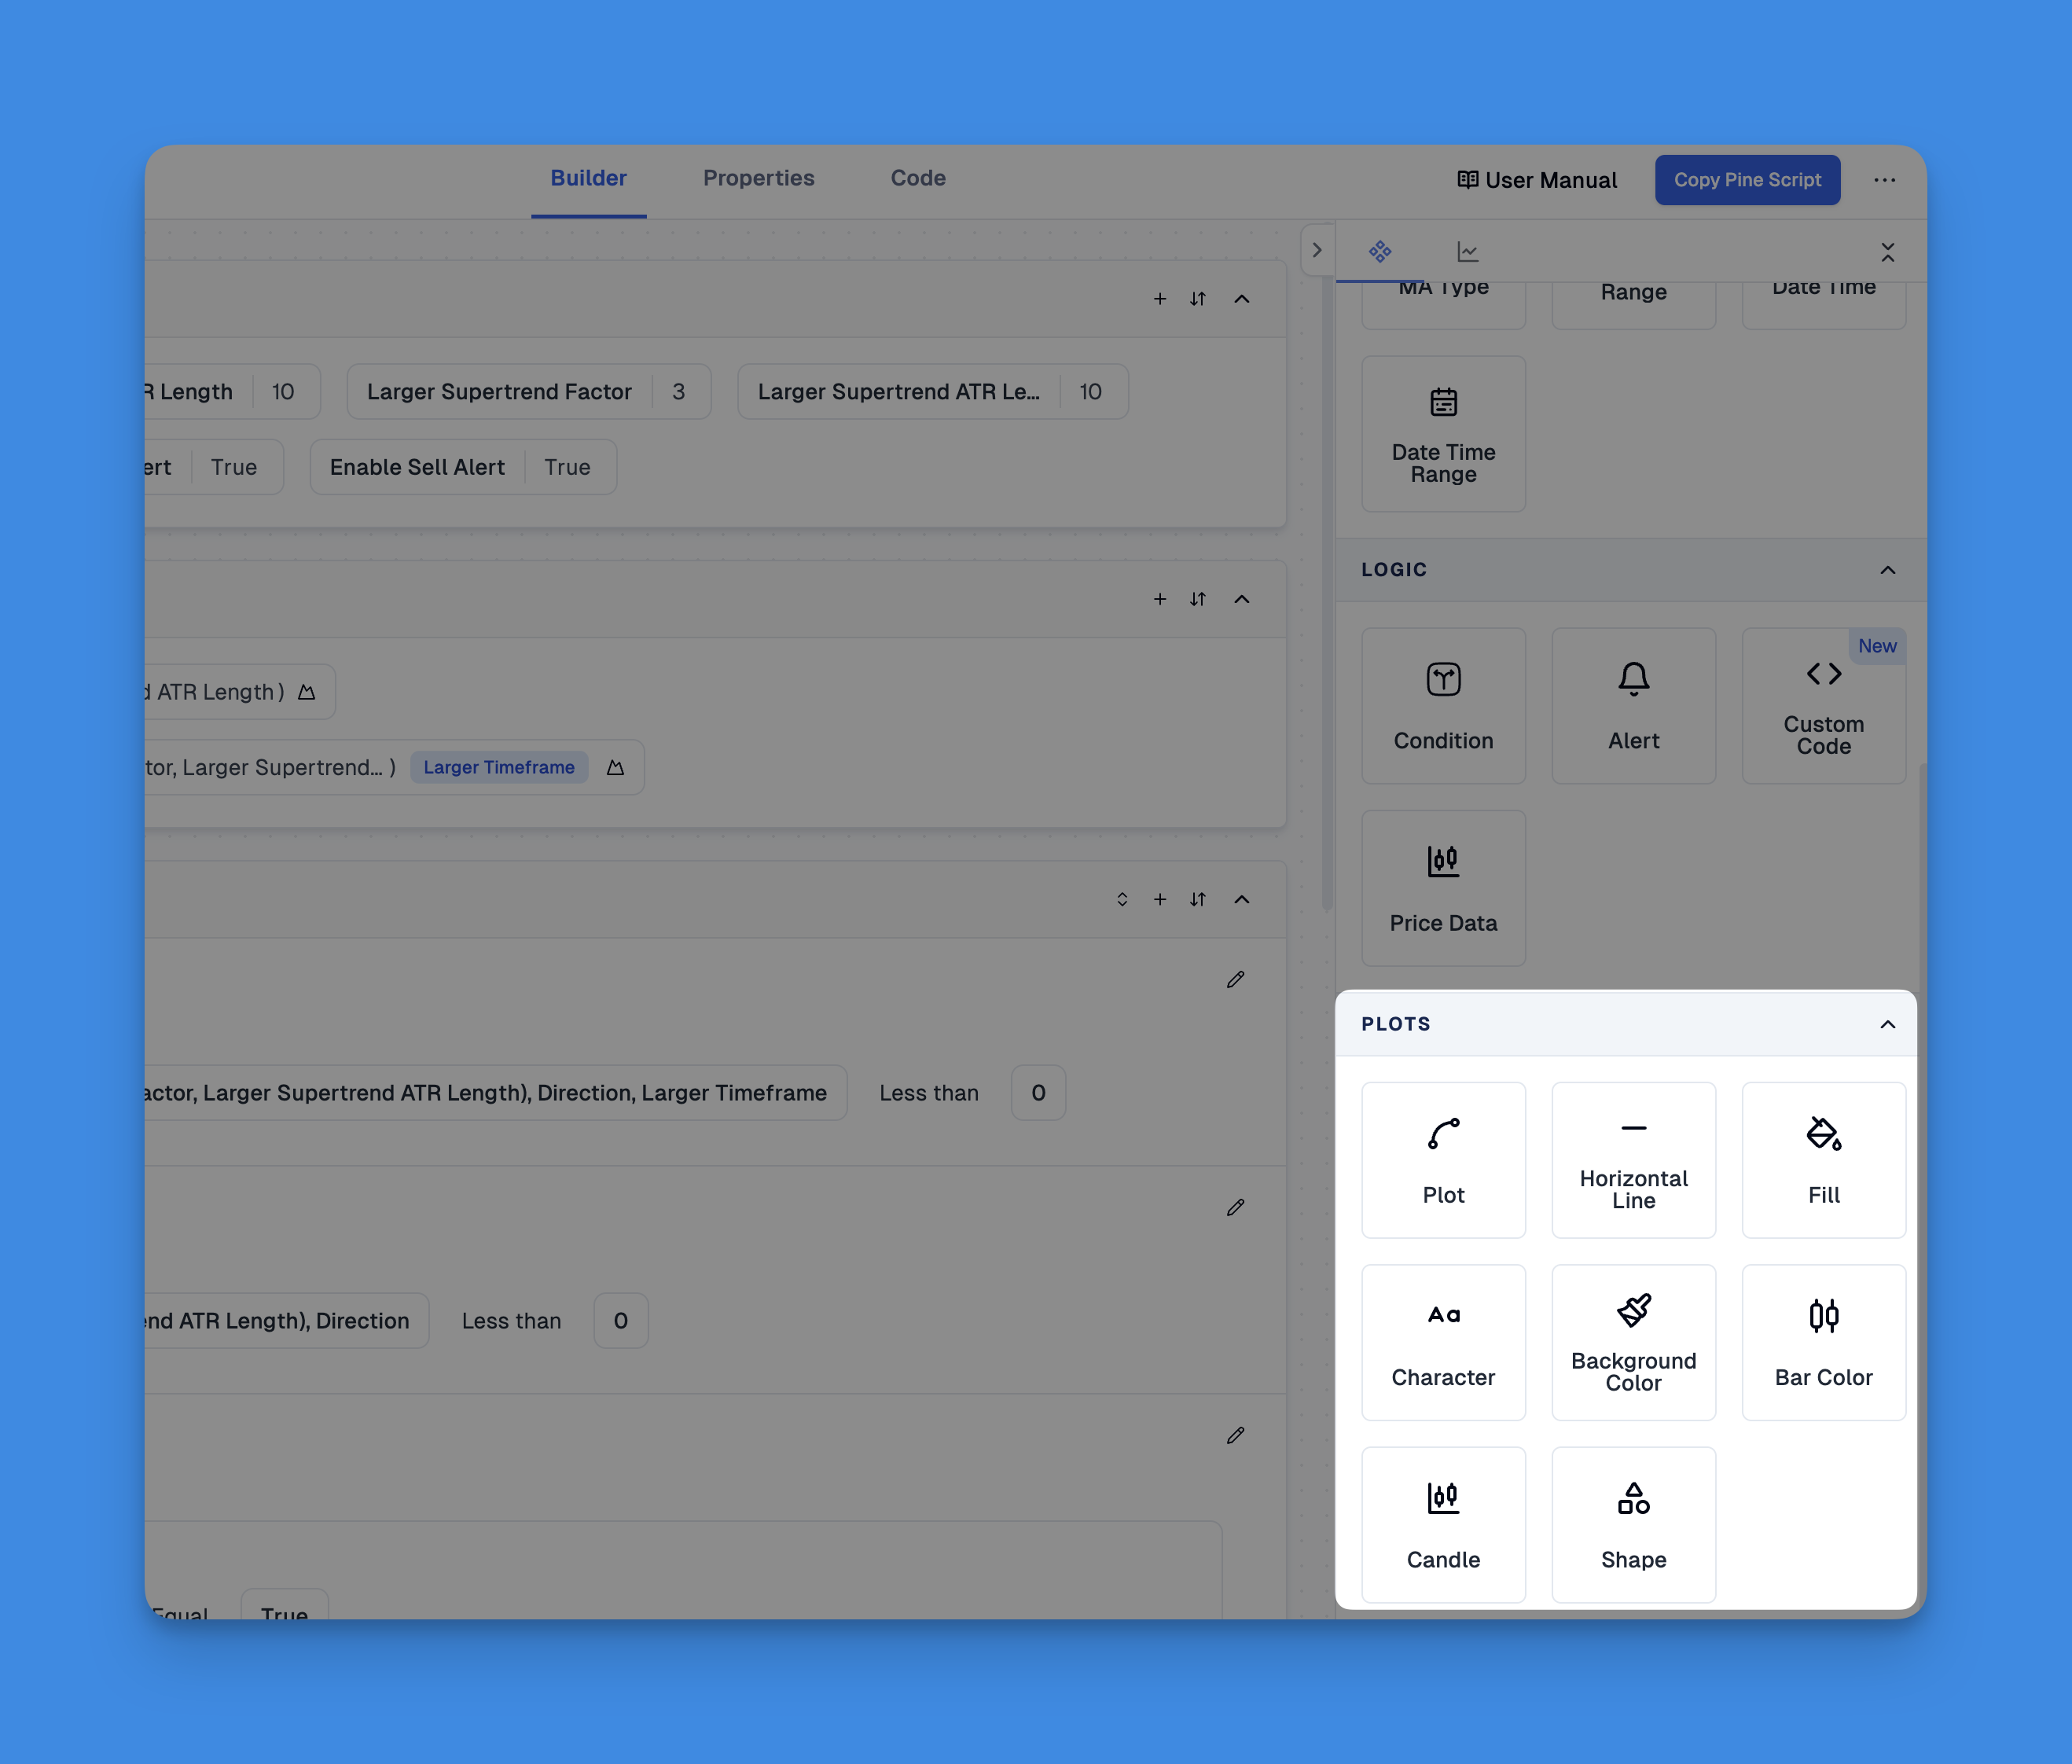
Pineify's visual editor lets you create conditions that automatically generate arrow signals, along with other visualization methods like lines, histograms, and shapes. Website: Pineify
Click here to view all the features of Pineify.Practical Example
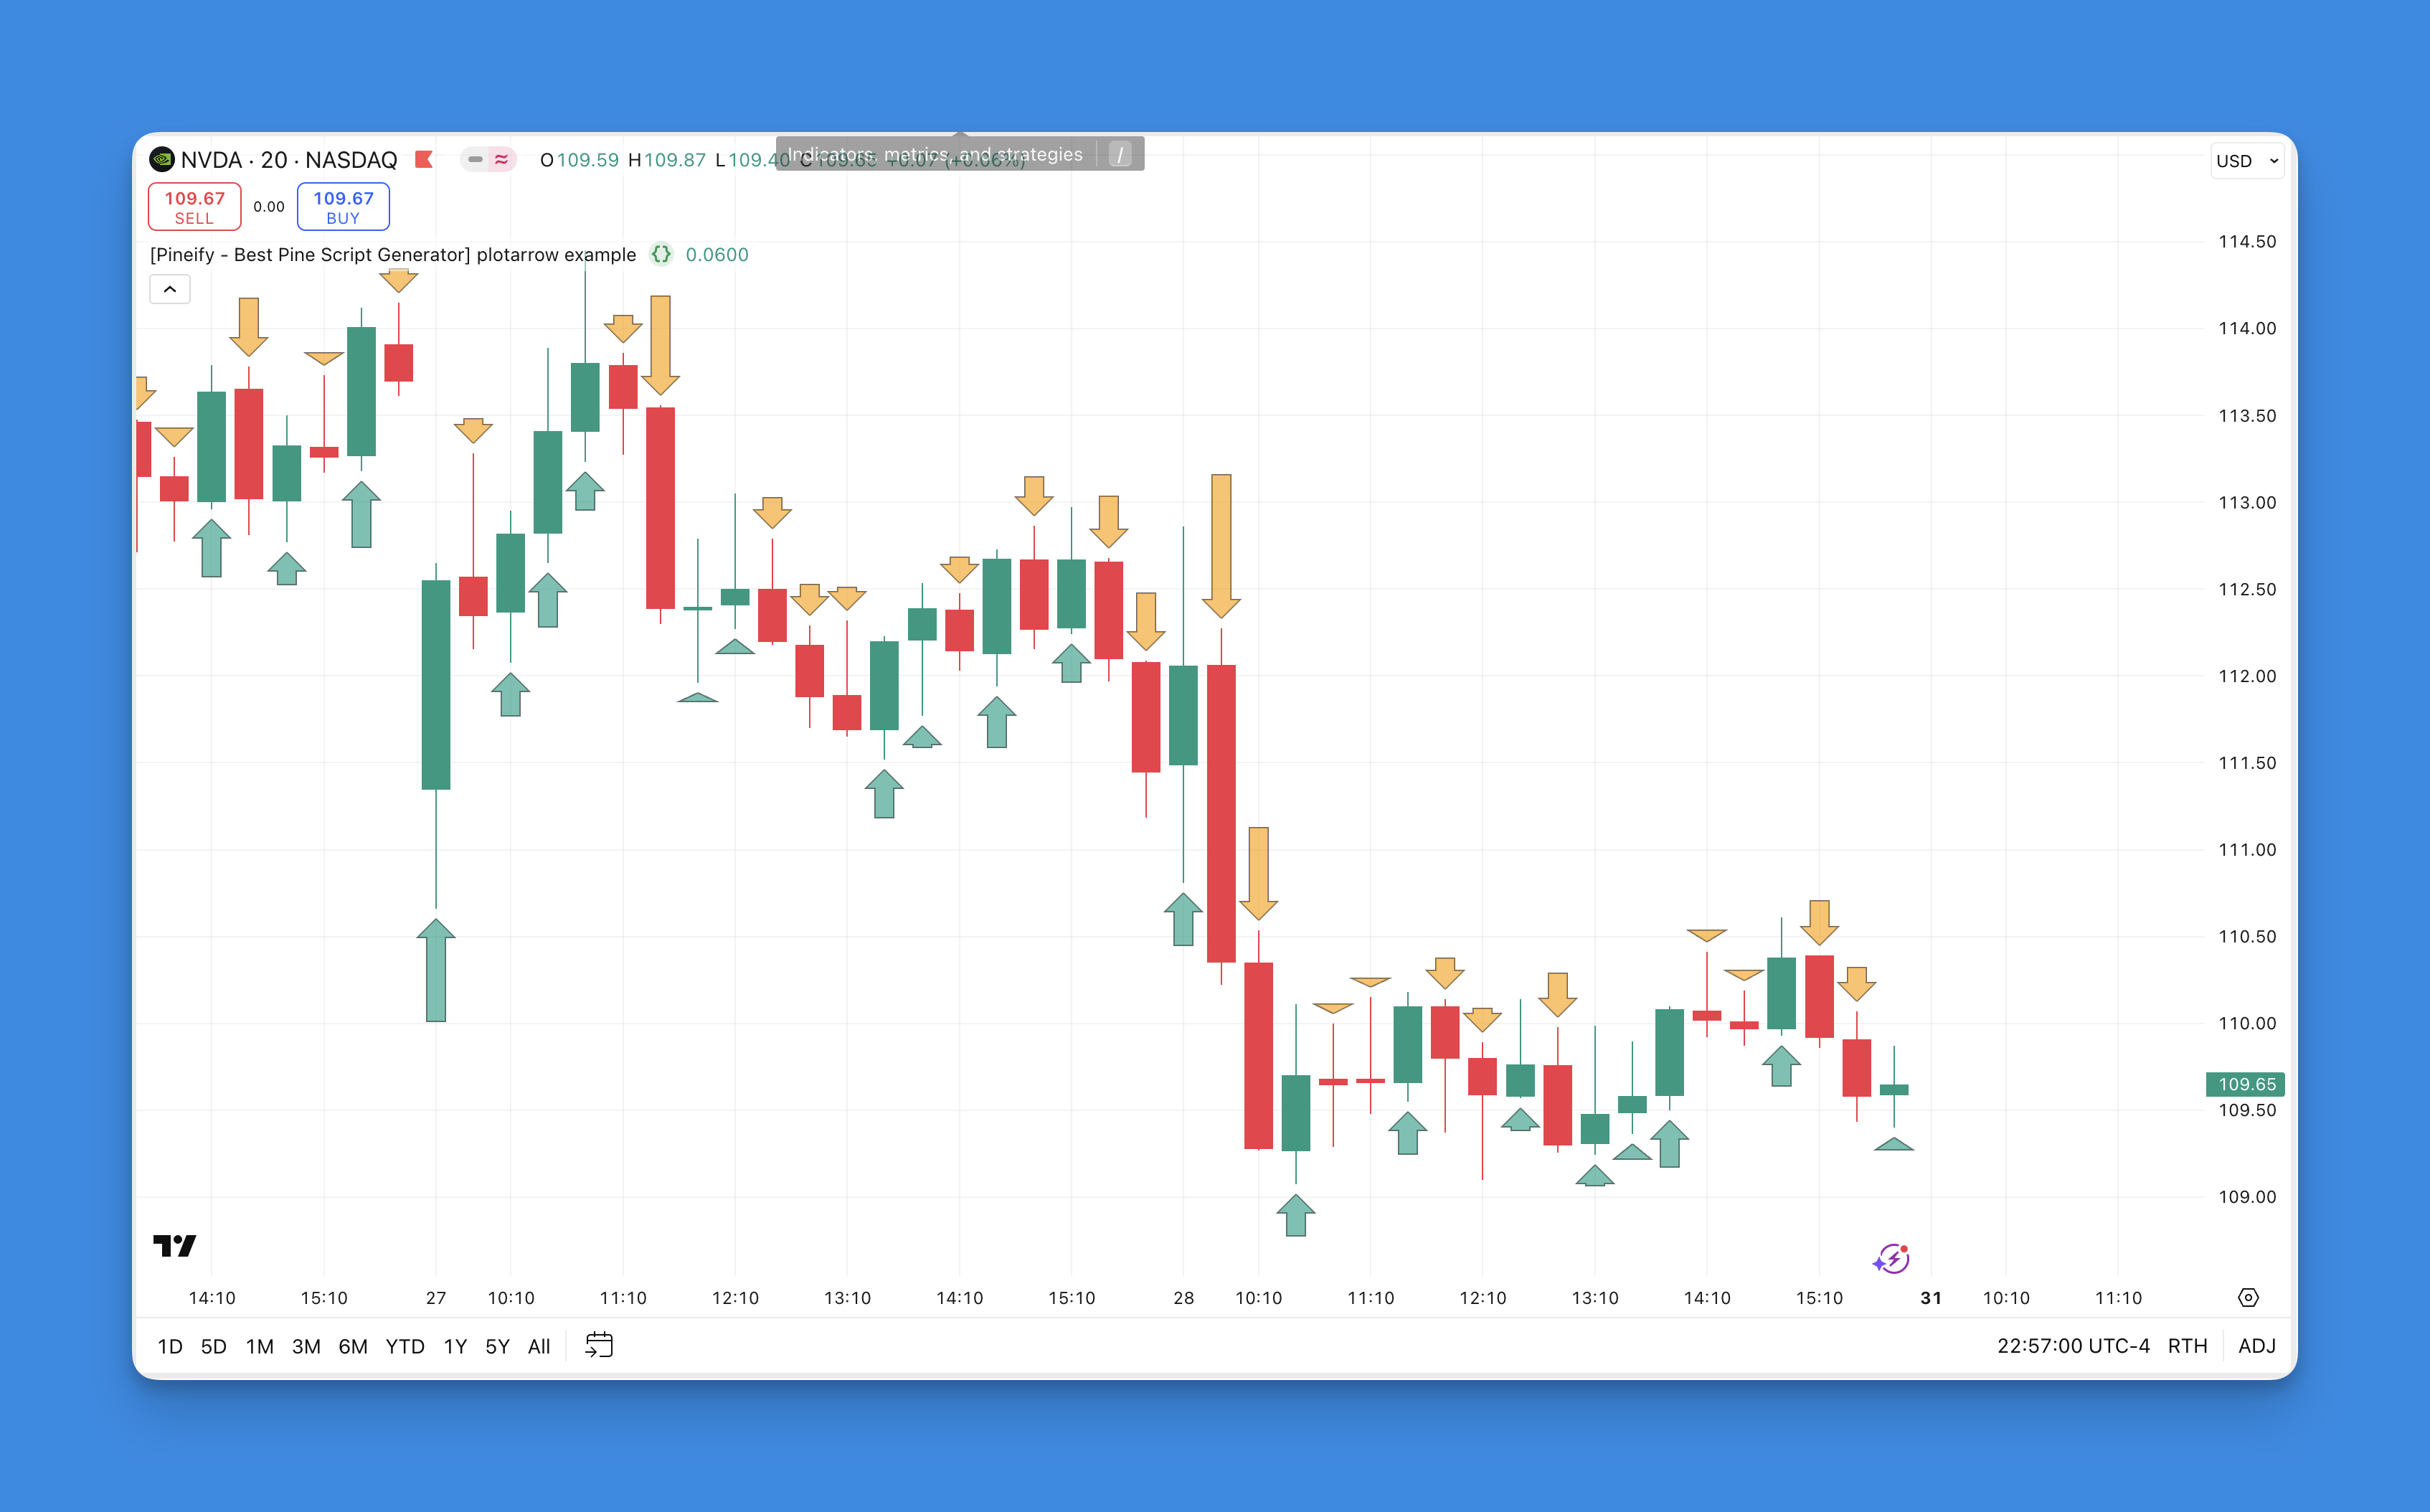
Here’s a simple example that plots arrows based on the difference between closing and opening prices:
//@version=5
indicator("plotarrow example", overlay=true)
codiff = close - open
plotarrow(codiff, colorup=color.new(color.teal,40), colordown=color.new(color.orange, 40))
In this script:
- We calculate the difference between closing and opening prices
- Positive differences (price closed higher than it opened) display teal up arrows
- Negative differences (price closed lower than it opened) display orange down arrows
- The arrow length varies based on the magnitude of the price difference
When to Use plotarrow
The plotarrow() function is particularly useful for:
- Visualizing buy/sell signals
- Highlighting significant price movements
- Marking trend reversals
- Creating custom indicators that show direction and strength in one visual element
Best Practices for Implementation
When implementing the plotarrow() function in your Pine Script code:
- Choose meaningful data: Ensure the series you’re plotting provides valuable trading insights
- Select appropriate colors: Use intuitive colors (green/red or blue/red) for directional clarity
- Adjust arrow heights: Fine-tune the minheight and maxheight parameters to ensure arrows are visible without overwhelming the chart
- Combine with other indicators: For maximum effectiveness, use arrows alongside other technical indicators for confirmation
Conclusion
The plotarrow() function is a versatile tool in Pine Script that transforms numerical data into intuitive visual signals on your trading charts. By representing positive and negative changes with directional arrows, it allows traders to quickly interpret market movements and potential trading opportunities.
Ready to enhance your trading charts with custom arrow indicators? Start experimenting with the plotarrow() function in your Pine Script code today and discover new ways to visualize your trading strategies.