Bollinger Band Squeeze: Trade Breakouts With Higher Win Rates
Ever watched the market just... sit there? Like it's holding its breath before something big happens? A Bollinger Band squeeze is exactly that — a volatility compression pattern where the upper and lower bands contract tightly around price, signaling that a sharp move is coming. I've been trading this setup for years, and it's one of the few patterns that actually delivers when you get the timing right.
The trick is most traders either overcomplicate this indicator or skip the confirmation steps. I've made both mistakes. Here's what I've learned from catching a TSLA breakout in January 2025 and missing a BTC move in March because I ignored volume.
What a Bollinger Band Squeeze Is and How It Works

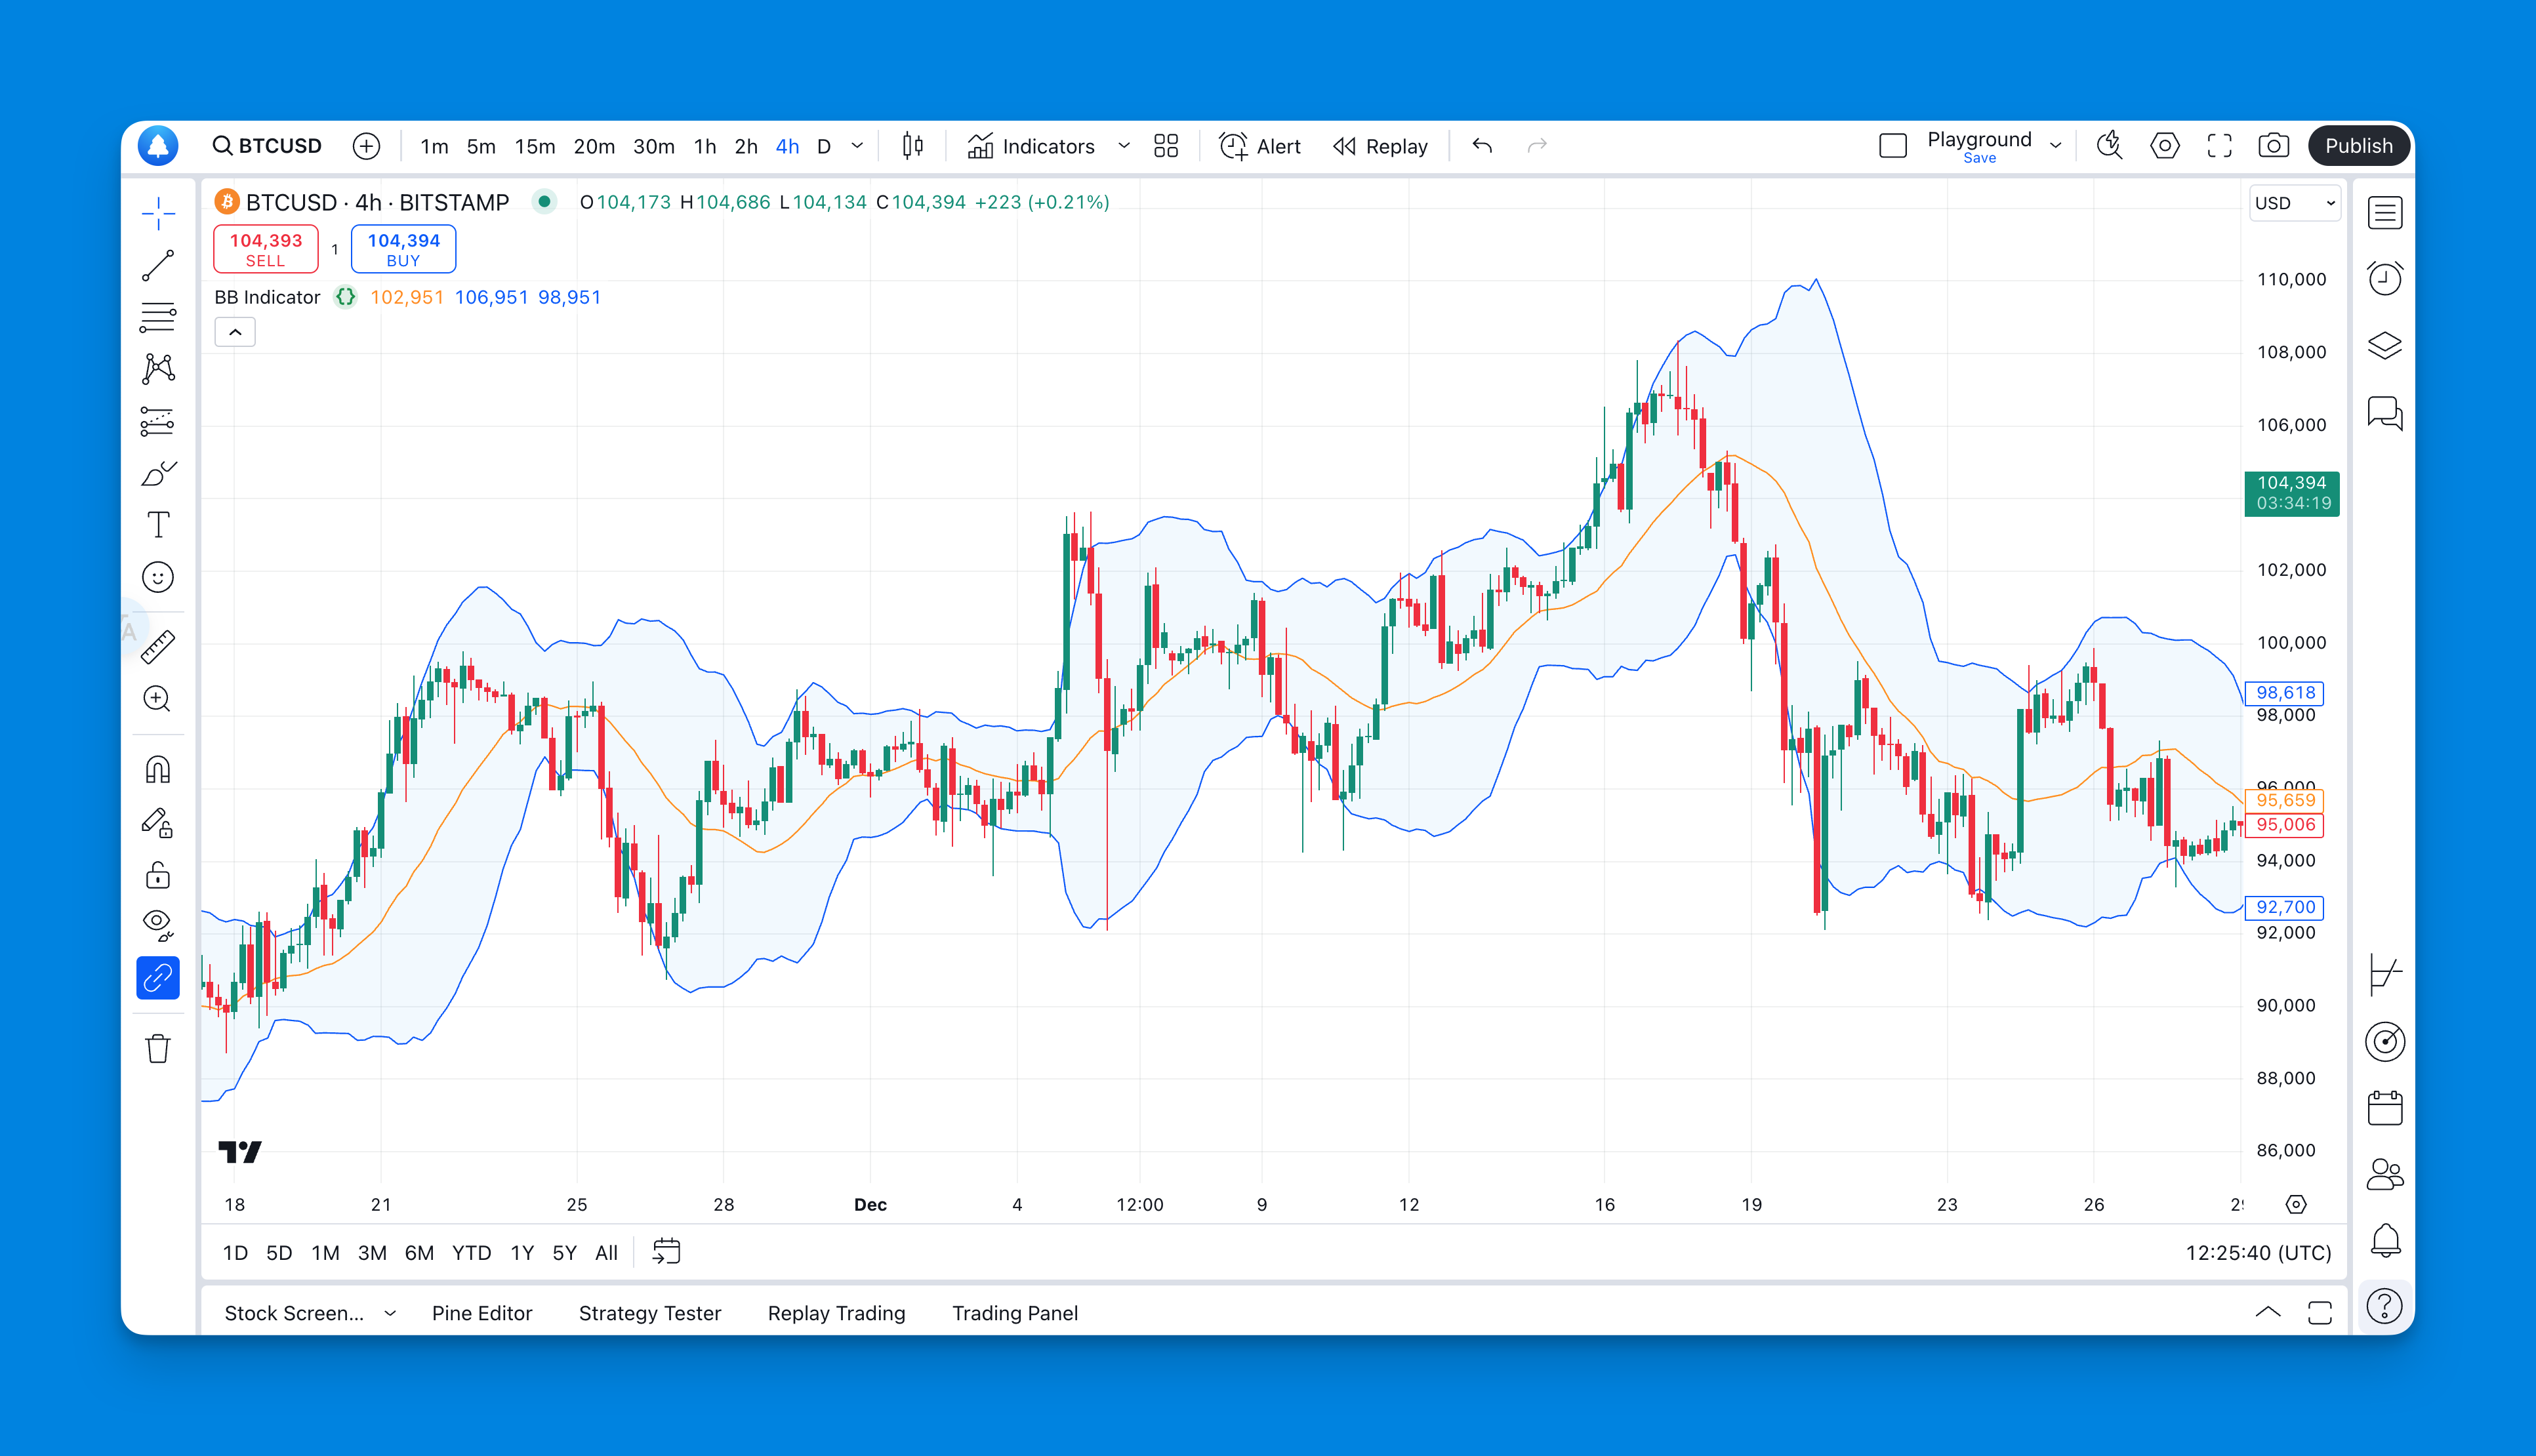
John Bollinger created this in the 1980s, and it's simpler than most people think. Three lines on your chart:
- A middle line: a simple moving average, usually 20 periods
- Two outer bands: positioned at a set number of standard deviations from the middle
When volatility drops, the bands contract. When volatility spikes, they expand. The squeeze is the contraction phase — tight bands hugging price.
The formula is straightforward:
- Middle Band = SMA(close, 20)
- Upper Band = Middle + (2 * standard deviation of close over 20 periods)
- Lower Band = Middle - (2 * standard deviation)
- Squeeze = when BandWidth drops below a historical low (typically the lowest reading in the last 100 bars)
The market builds energy during contraction, then releases it in a breakout. You don't know the direction ahead of time, but you can position for either side.
Why the Squeeze Works and Where It Falls Short
The logic is sound. Markets cycle between quiet and active periods. After low volatility, you get high volatility. The squeeze catches that transition.
But not every squeeze produces a big move. I've seen AAPL fake out on November 12, 2025 — the bands tightened, price broke the upper band on weak volume, then reversed hard the next day. That trade cost me 2% before I closed it.
These false squeezes happen when the compression is driven by a holiday lull or an options expiration, not genuine consolidation. That's why I won't trade a squeeze without volume confirmation and a second indicator filter.
Setup and Configuration
You can code this in Pine Script manually, but I prefer using a visual builder to iterate faster. Here's what I run:
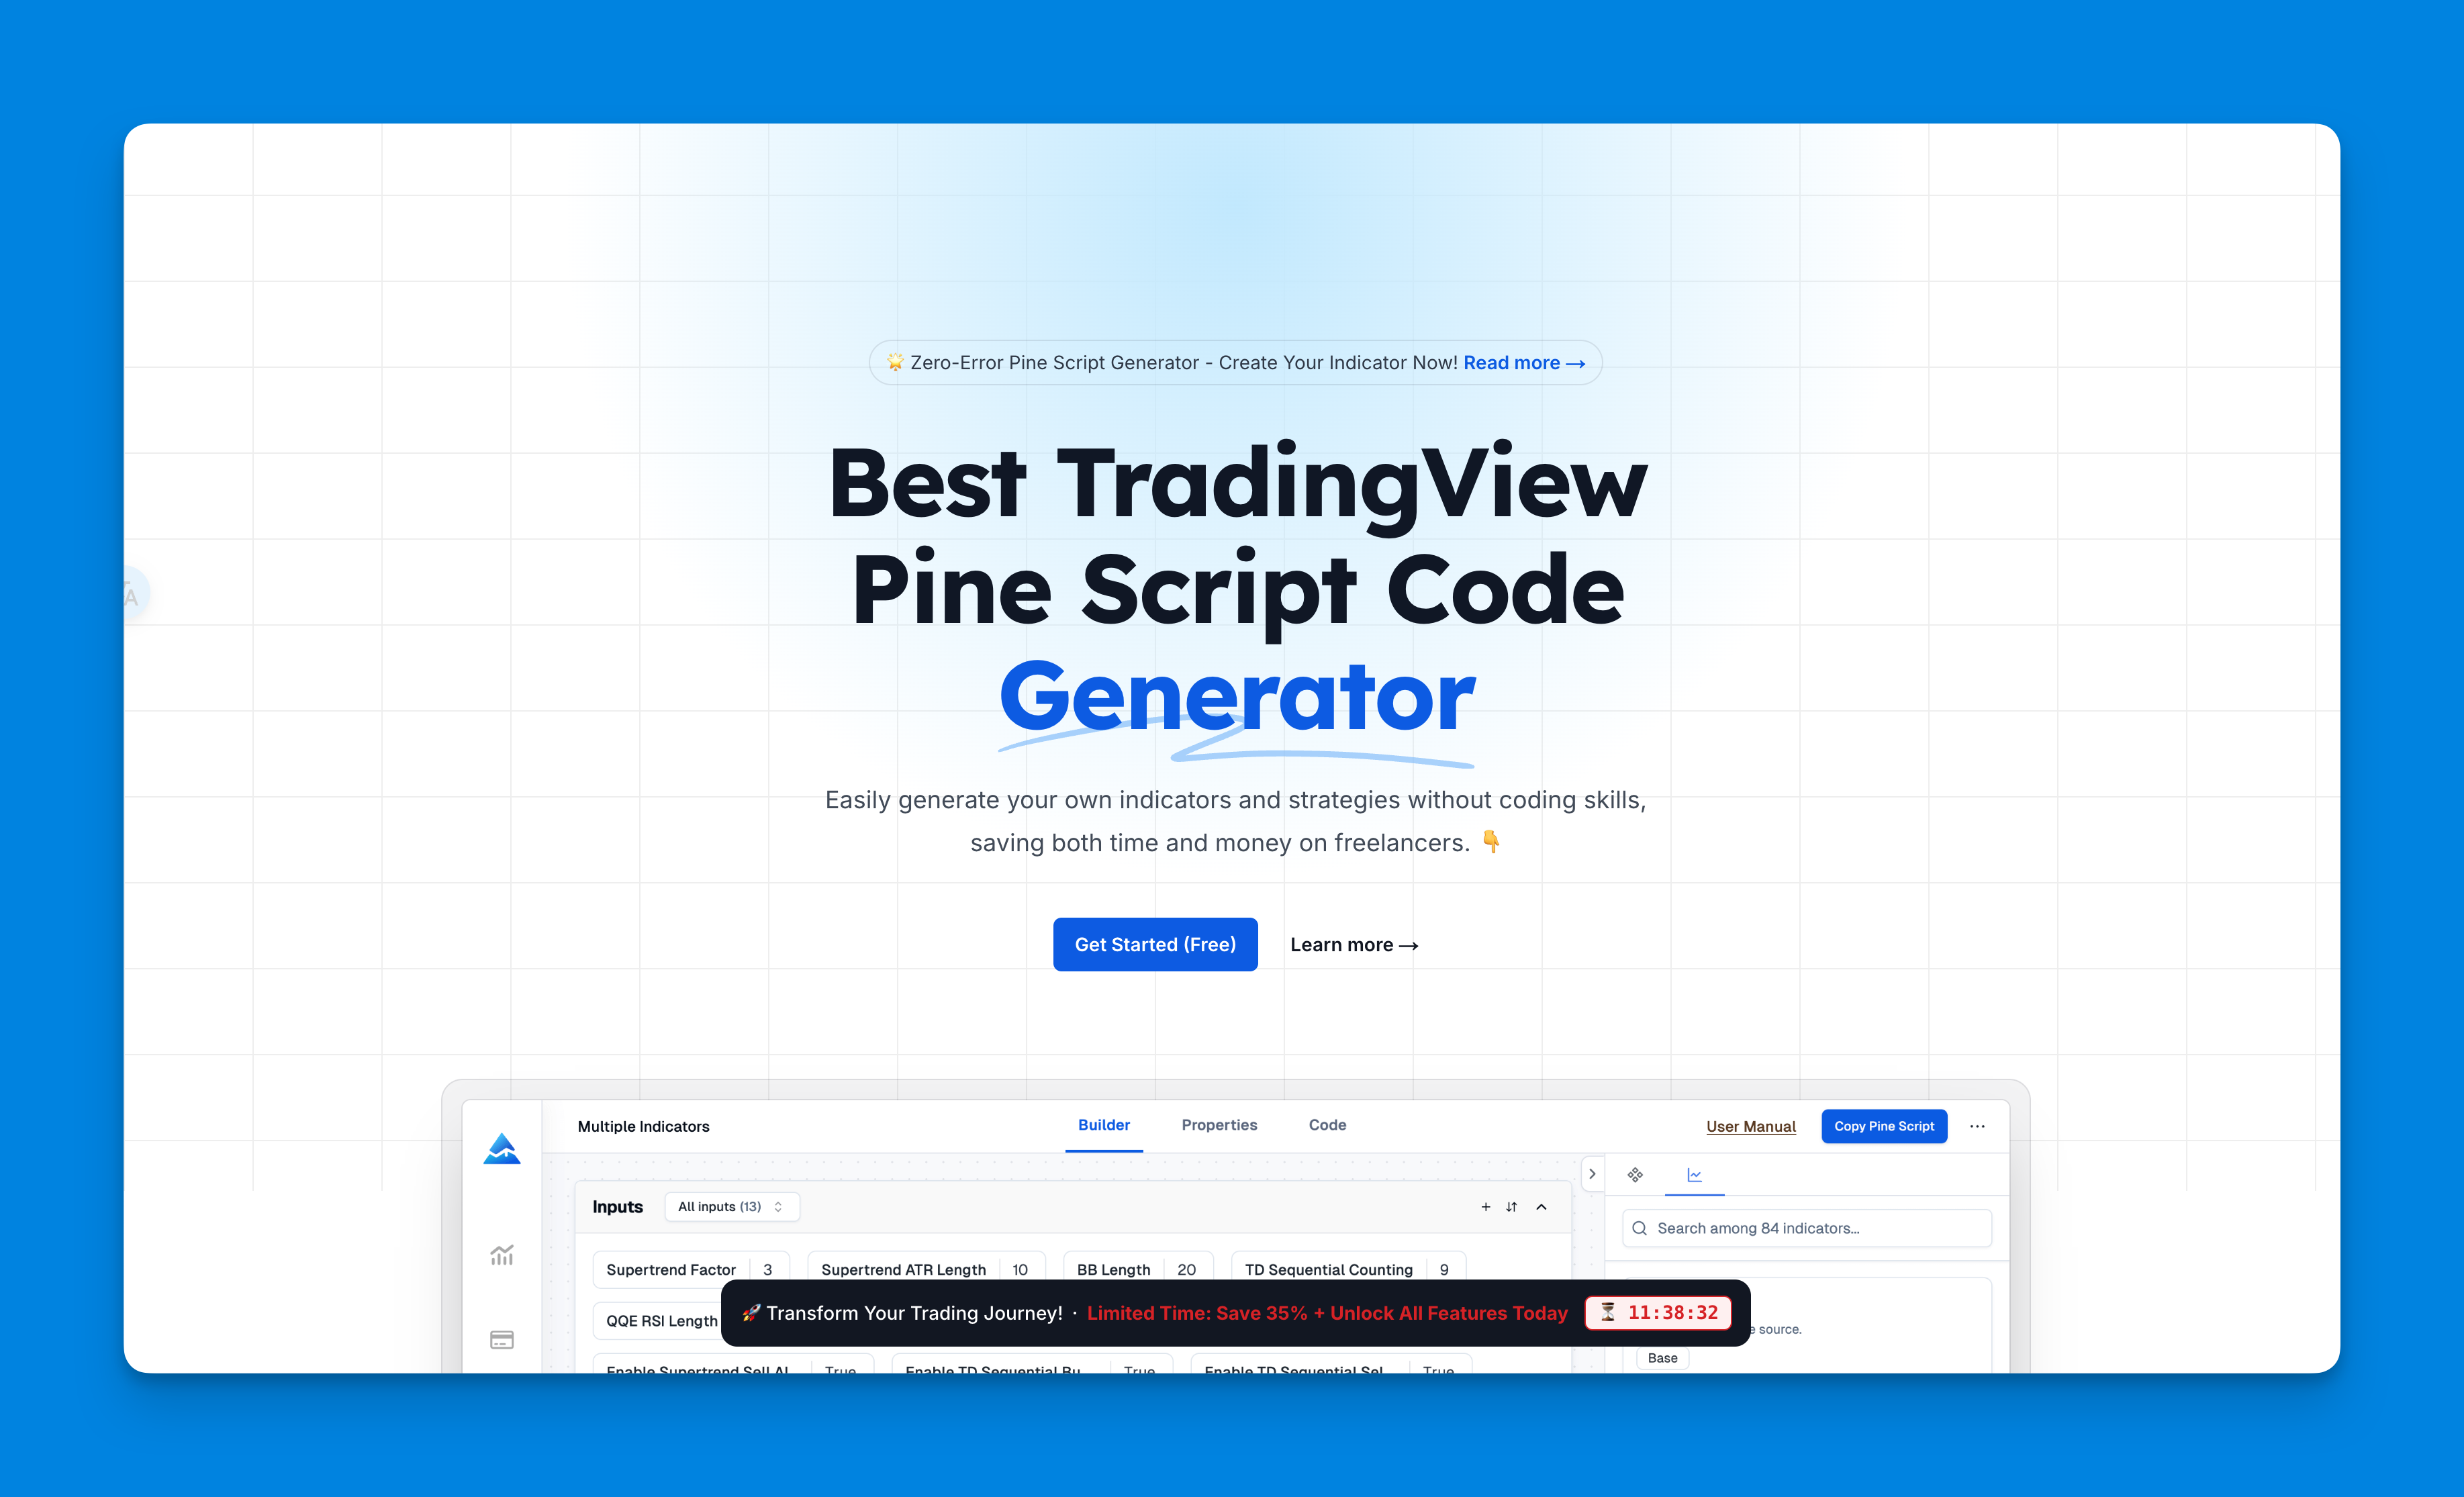
I've been building my indicators with Pineify because it lets me swap parameters in real time without touching code. It's not perfect — I've run into lag with very complex multi-indicator setups — but for the squeeze strategy it works well.
Parameters I use:
- Length: 20 periods
- Source: Close price
- Standard Deviation: 2.0 (captures about 95% of price action)
- Offset: 0
Settings by Timeframe
| Trading Style | Chart | Length | Std Dev | Trade-off |
|---|---|---|---|---|
| Swing trading | Daily | 20 | 2.0 | Fewer signals, higher reliability |
| Day trading | 1–4 hour | 20 | 1.8–2.0 | Balanced responsiveness |
| Scalping | 15–60 min | 14–20 | 1.5–2.0 | More signals, more false breakouts |
I tend to stick with the daily chart for swing trades. On lower timeframes the noise-to-signal ratio gets worse, and I haven't found a deviation adjustment that fixes it completely.
Trading the Squeeze Step by Step
Step 1: Spot the Squeeze Look for bands wrapped tight around price. The tighter the better — extreme compression tends to produce bigger breakouts. I measure this visually but you can also use the BandWidth indicator for a numeric read.
Step 2: Check Volume This is where most traders fail. A real breakout needs above-average volume. If volume is flat or declining when price breaks the band, I skip the trade. No exceptions.
Step 3: Let the Market Show Direction Don't guess. Wait for a full candle close outside the band. An intrabar spike that closes inside is a trap.
Step 4: Enter and Protect
- Long: price closes above upper band with volume
- Short: price closes below lower band with volume
- Stop loss: just inside the opposite band
- Take profit: aim for a 2:1 or 3:1 risk-reward ratio
Step 5: Review and Adjust I track every squeeze trade in a journal. If my win rate drops below 40% over 20 trades, I tighten the entry criteria — usually by requiring RSI confirmation on top of volume.
Adding Complementary Indicators
The squeeze works better with a second filter. My go-to combos:
RSI Confirmation. I use RSI to avoid entering when the market is already stretched. If you're building this in code, check How to Code RSI in Pine Script — it explains the logic step by step.
MACD Crossovers. A MACD crossover in the breakout direction adds momentum-based confidence. I've seen this combination catch a SPY swing in March 2026 that ran 4.2% over six days.
Volume Indicators. OBV or simple volume bars are non-negotiable for this setup. Without volume, you're guessing.
For traders who want to combine multiple signals, Introduction to Pine Script Buy/Sell Signals walks through the logic for building composite strategies.
Common Mistakes I've Made (And Seen Others Make)
Trading every squeeze. I went through a phase where I entered every band tightening I saw. My win rate dropped to 30%. Now I only take squeezes with volume confirmation and trend alignment.
Ignoring the broader trend. The squeeze works best when the breakout aligns with the daily trend. Fighting the trend with a squeeze breakout is a losing game. I know because I've tried it on AMD three times and lost twice.
Poor risk management. A breakout can reverse in two bars. If your stop loss isn't set before entry, you're gambling. I use a hard stop at 1% of account per trade.
Overcomplicating the chart. More indicators don't mean better signals. I ran a six-indicator setup once and froze at every decision point. Now I keep it to three: Bollinger Bands, volume, and one momentum filter.
Advanced Variations Worth Testing
Once the basic squeeze is consistent, you can experiment:
Multi-timeframe confirmation. Check if the squeeze on your entry timeframe aligns with a squeeze or trend on the higher timeframe. Multi-timeframe (MTF) Pine Script Guide covers how to structure this in code.
BandWidth indicator. This quantifies the squeeze instead of relying on visual judgment. Some traders set an alert when BandWidth hits its lowest value in six months.
Squeeze momentum oscillator. A variation that adds a momentum line to hint at breakout direction. I haven't tested this enough to recommend it, but early results look promising for range-bound markets.
What This Indicator Won't Do for You
I'll be straight with you. This indicator will not turn a losing month into a winning one. I've had stretches where the squeeze fired five times and only two trades worked out. That's trading.
What it does well: keeps you out of sideways chop. During low-volatility periods when most traders force bad entries, the squeeze strategy tells you to wait. That alone has saved me more money than any entry signal.
It also gives you clear, objective rules. When the band closes with volume, you act. When conditions aren't met, you sit. No ambiguity.
But I've found it underperforms in strongly trending markets — the bands widen with volatility and the squeeze rarely triggers. For trend-following, you're better off with a moving average crossover system.
Frequently Asked Questions
▶What does a Bollinger Band squeeze signal in trading?
A Bollinger Band squeeze happens when the upper and lower bands contract around price, showing very low volatility. It's like the market coiling before a move. The squeeze itself signals that a breakout is likely, but it won't tell you which direction — you need volume and price action for that.
▶How do I tell a real breakout from a false one on Bollinger Bands?
Volume is your best check. A real breakout closes outside the band on higher-than-average volume. If the breakout barely breaks the band and volume is flat, skip it. I also add RSI or MACD as a second filter when I'm unsure.
▶Which Bollinger Band settings work for swing trading versus day trading?
For swing trading on daily charts: 20-period length, 2.0 standard deviations. For day trading on 1-4 hour charts: 20-period length, 1.8-2.0 deviation. For scalping on 15-60 minute charts: 14-20 period length, 1.5-2.0 deviation. Lower timeframes give faster signals but more false ones.
▶Can I build a Bollinger Band squeeze without coding Pine Script myself?
Yes. Pineify has a visual indicator builder. You pick Bollinger Bands from the library, adjust the parameters, and push the indicator to TradingView without writing code. I use it because I'd rather spend time testing than debugging.
▶Which indicators work best alongside the Bollinger Band squeeze?
RSI keeps you out of overbought entries. MACD crossovers aligned with the breakout add momentum confirmation. Volume indicators (OBV or volume bars) are essential — the squeeze strategy relies on volume to filter fakeouts.
▶What's the right stop loss and take profit for Bollinger Band breakouts?
Put your stop just inside the band opposite to your entry. Set take profit at a 2:1 or 3:1 risk-reward ratio. Risk no more than 1-2% of your account per trade. And always wait for the candle to close outside the band before entering — intrabar entries burn accounts.