QQE Indicator: A Comprehensive Trading Guide
The Quantitative Qualitative Estimation (QQE) indicator is a powerful tool used in technical analysis to help traders identify market trends, overbought and oversold conditions, and potential entry and exit points. This article will delve into the intricacies of the QQE indicator, its applications in trading, and how it compares to other popular indicators like the Relative Strength Index (RSI).
What is the QQE Indicator?

The QQE indicator is derived from the Relative Strength Index (RSI), which is a well-known momentum oscillator. While the RSI provides valuable insights into price momentum, the QQE enhances this by offering a smoothed version of the RSI, making it more responsive to price changes. The QQE consists of two primary components:
- Smoothed RSI Line: This line reduces noise in price movements, providing a clearer view of market trends.
- Trailing Lines: There are two trailing lines—fast and slow—that interact with the smoothed RSI line to generate buy and sell signals.
The QQE values range from 0 to 100. A value above 50 indicates a bullish trend, while below 50 suggests a bearish trend. Levels above 70 indicate overbought conditions, and below 30 indicate oversold conditions.
How to Use the QQE Indicator in Trading
The QQE indicator can be utilized in various ways to enhance trading strategies:
1. Identifying Overbought and Oversold Levels
Traders often use QQE to determine when an asset is overbought or oversold.
- Overbought: A QQE value above 70 signals that an asset may be overbought, suggesting a potential price correction.
- Oversold: A value below 30 indicates oversold conditions, which could lead to a price rebound.
2. Trend Confirmation
By analyzing the QQE values, traders can confirm market trends:
- Bullish Trend: If the QQE line is above 50, it indicates a bullish market.
- Bearish Trend: Conversely, if the QQE line is below 50, it suggests a bearish market.
This trend confirmation can help traders make informed decisions about entering or exiting trades.
3. Divergence Signals
The QQE indicator excels at identifying divergence between price movements and its lines:
- Bullish Divergence: Occurs when prices make lower lows while the QQE makes higher lows, indicating potential upward momentum.
- Bearish Divergence: Happens when prices make higher highs while the QQE makes lower highs, signaling potential downward movement.
Recognizing these divergences can provide early warnings of trend reversals.
Adding the QQE Indicator to TradingView Chart Without Coding

Website: Pineify
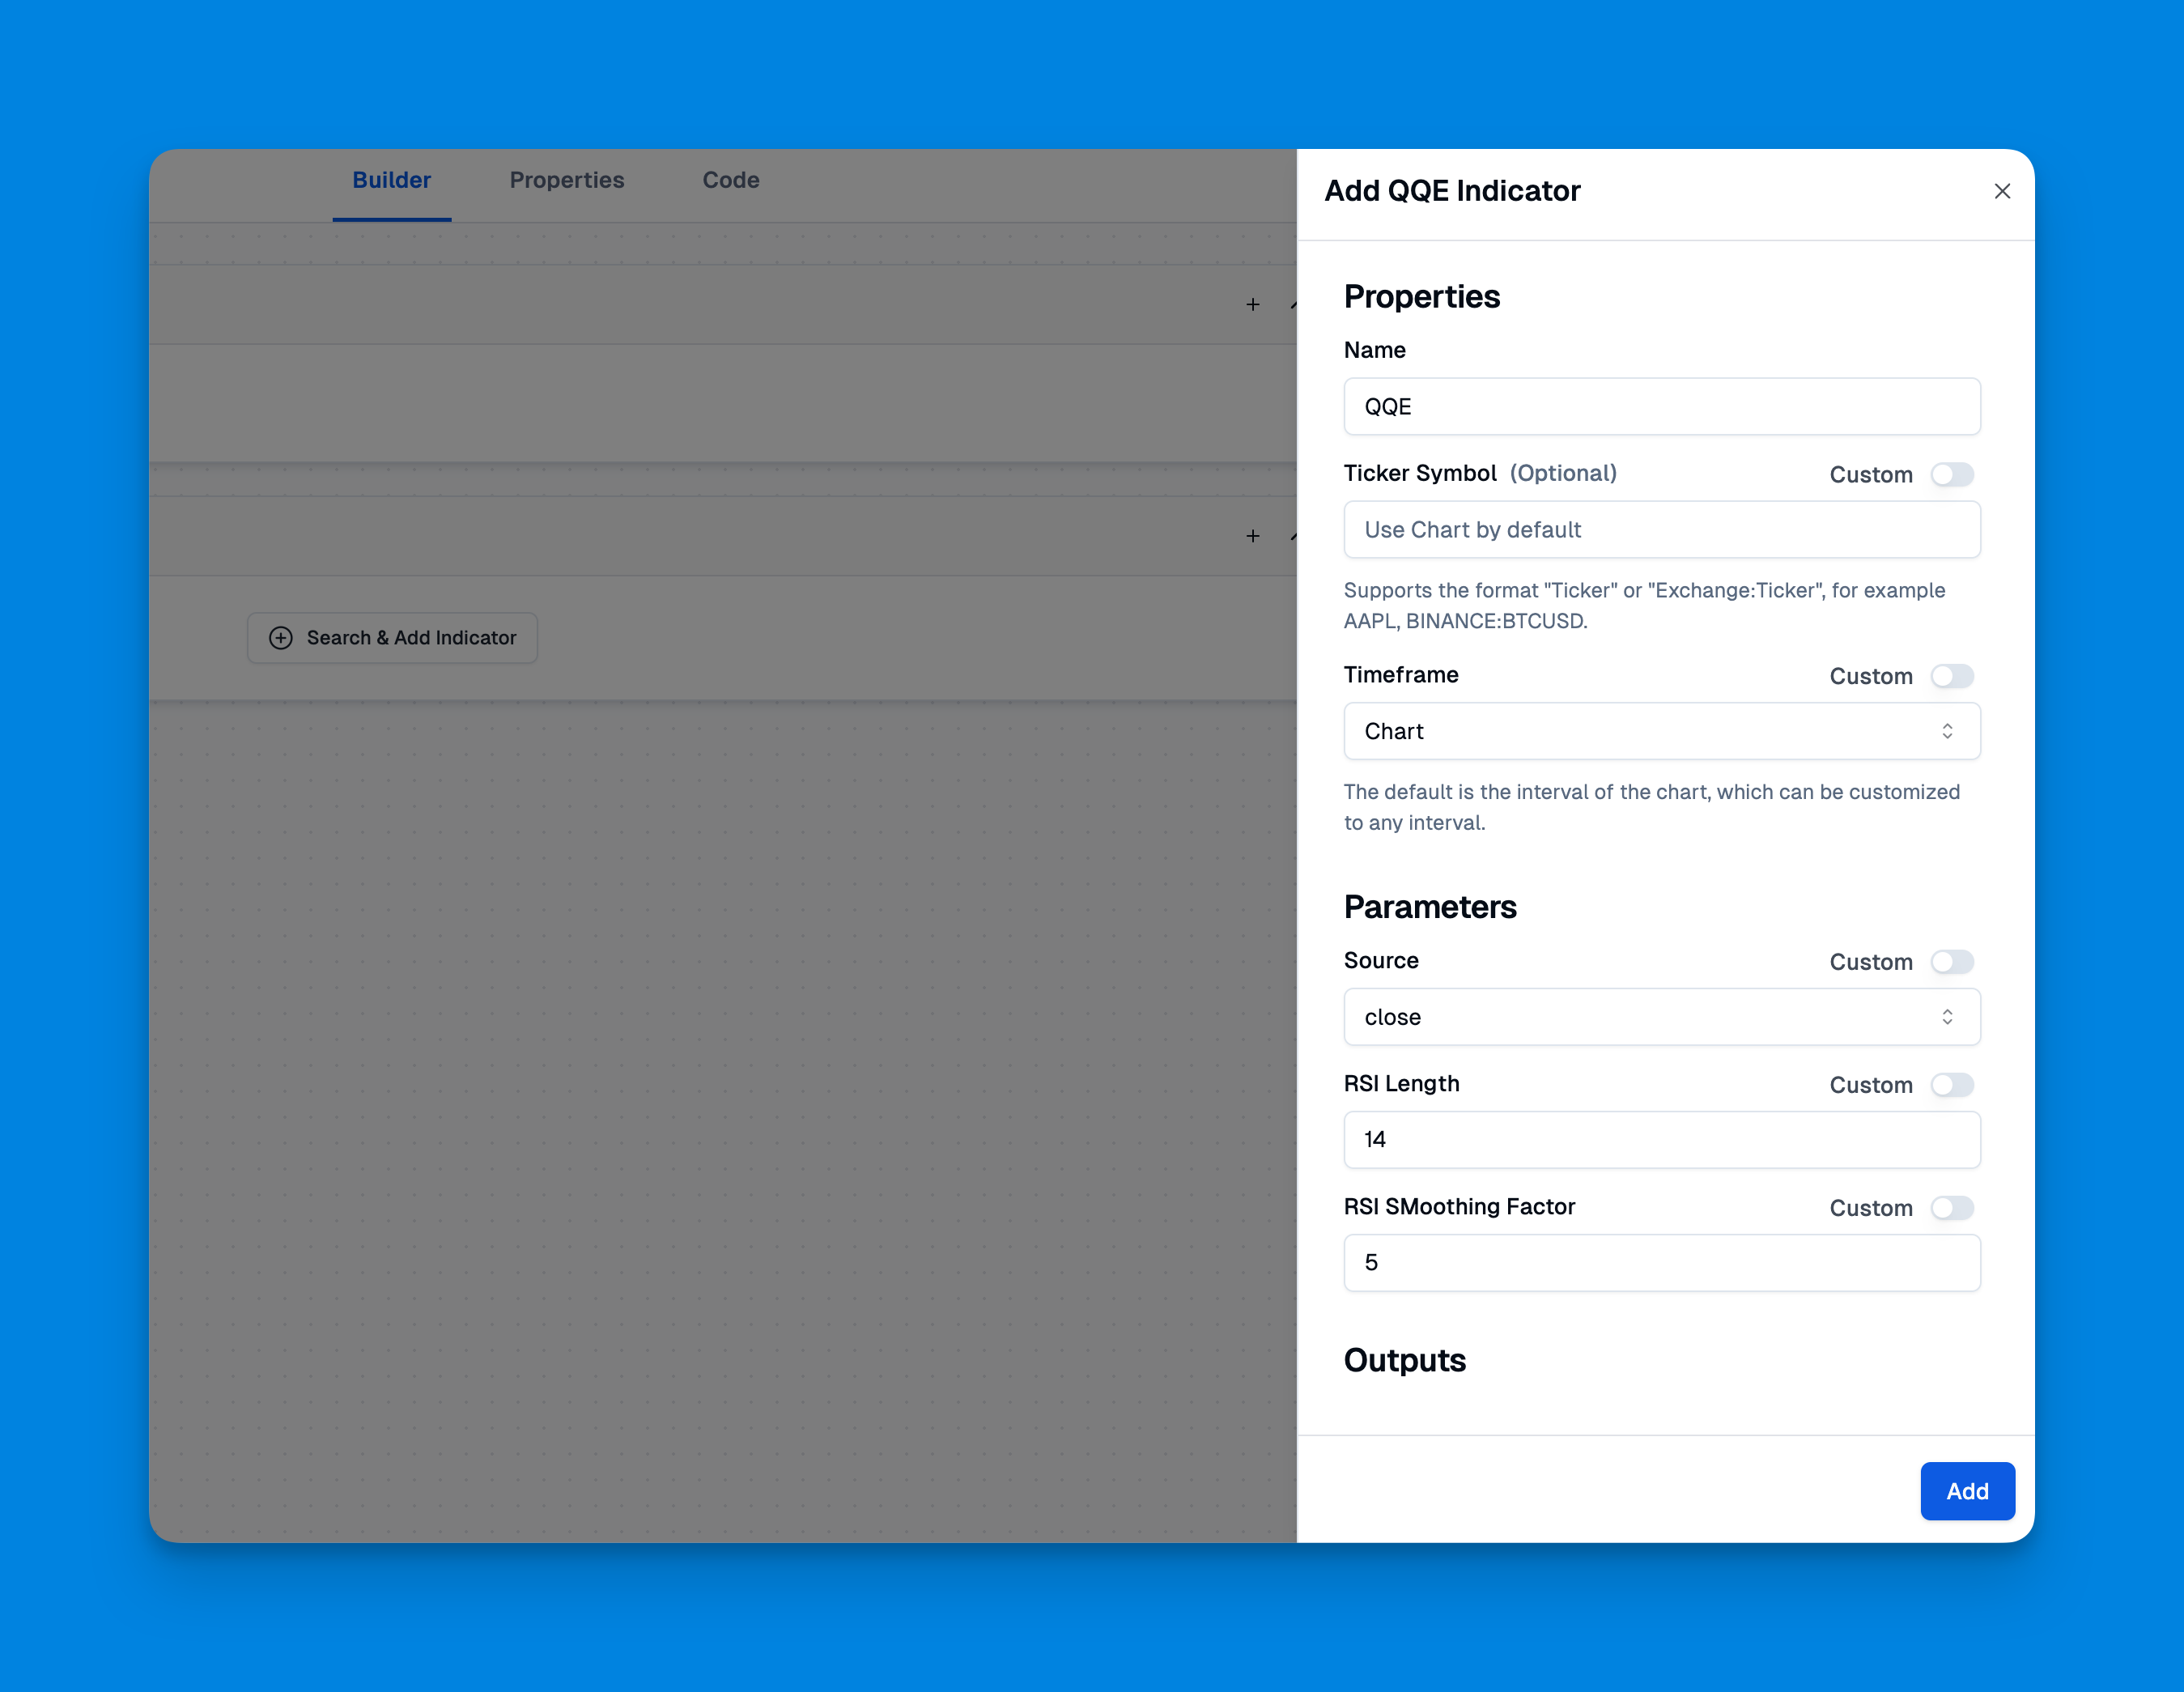
To add the QQE Indicator to your TradingView chart without coding, you can utilize Pineify, a user-friendly tool designed for traders who wish to create and manage indicators effortlessly. Pineify eliminates the need for programming knowledge, allowing you to generate custom indicators like the QQE Indicator through a visual interface.
Click here to view all the features of Pineify.
QQE Indicator Trading Strategy Tutorial
Implementing a trading strategy using the QQE indicator involves several steps:
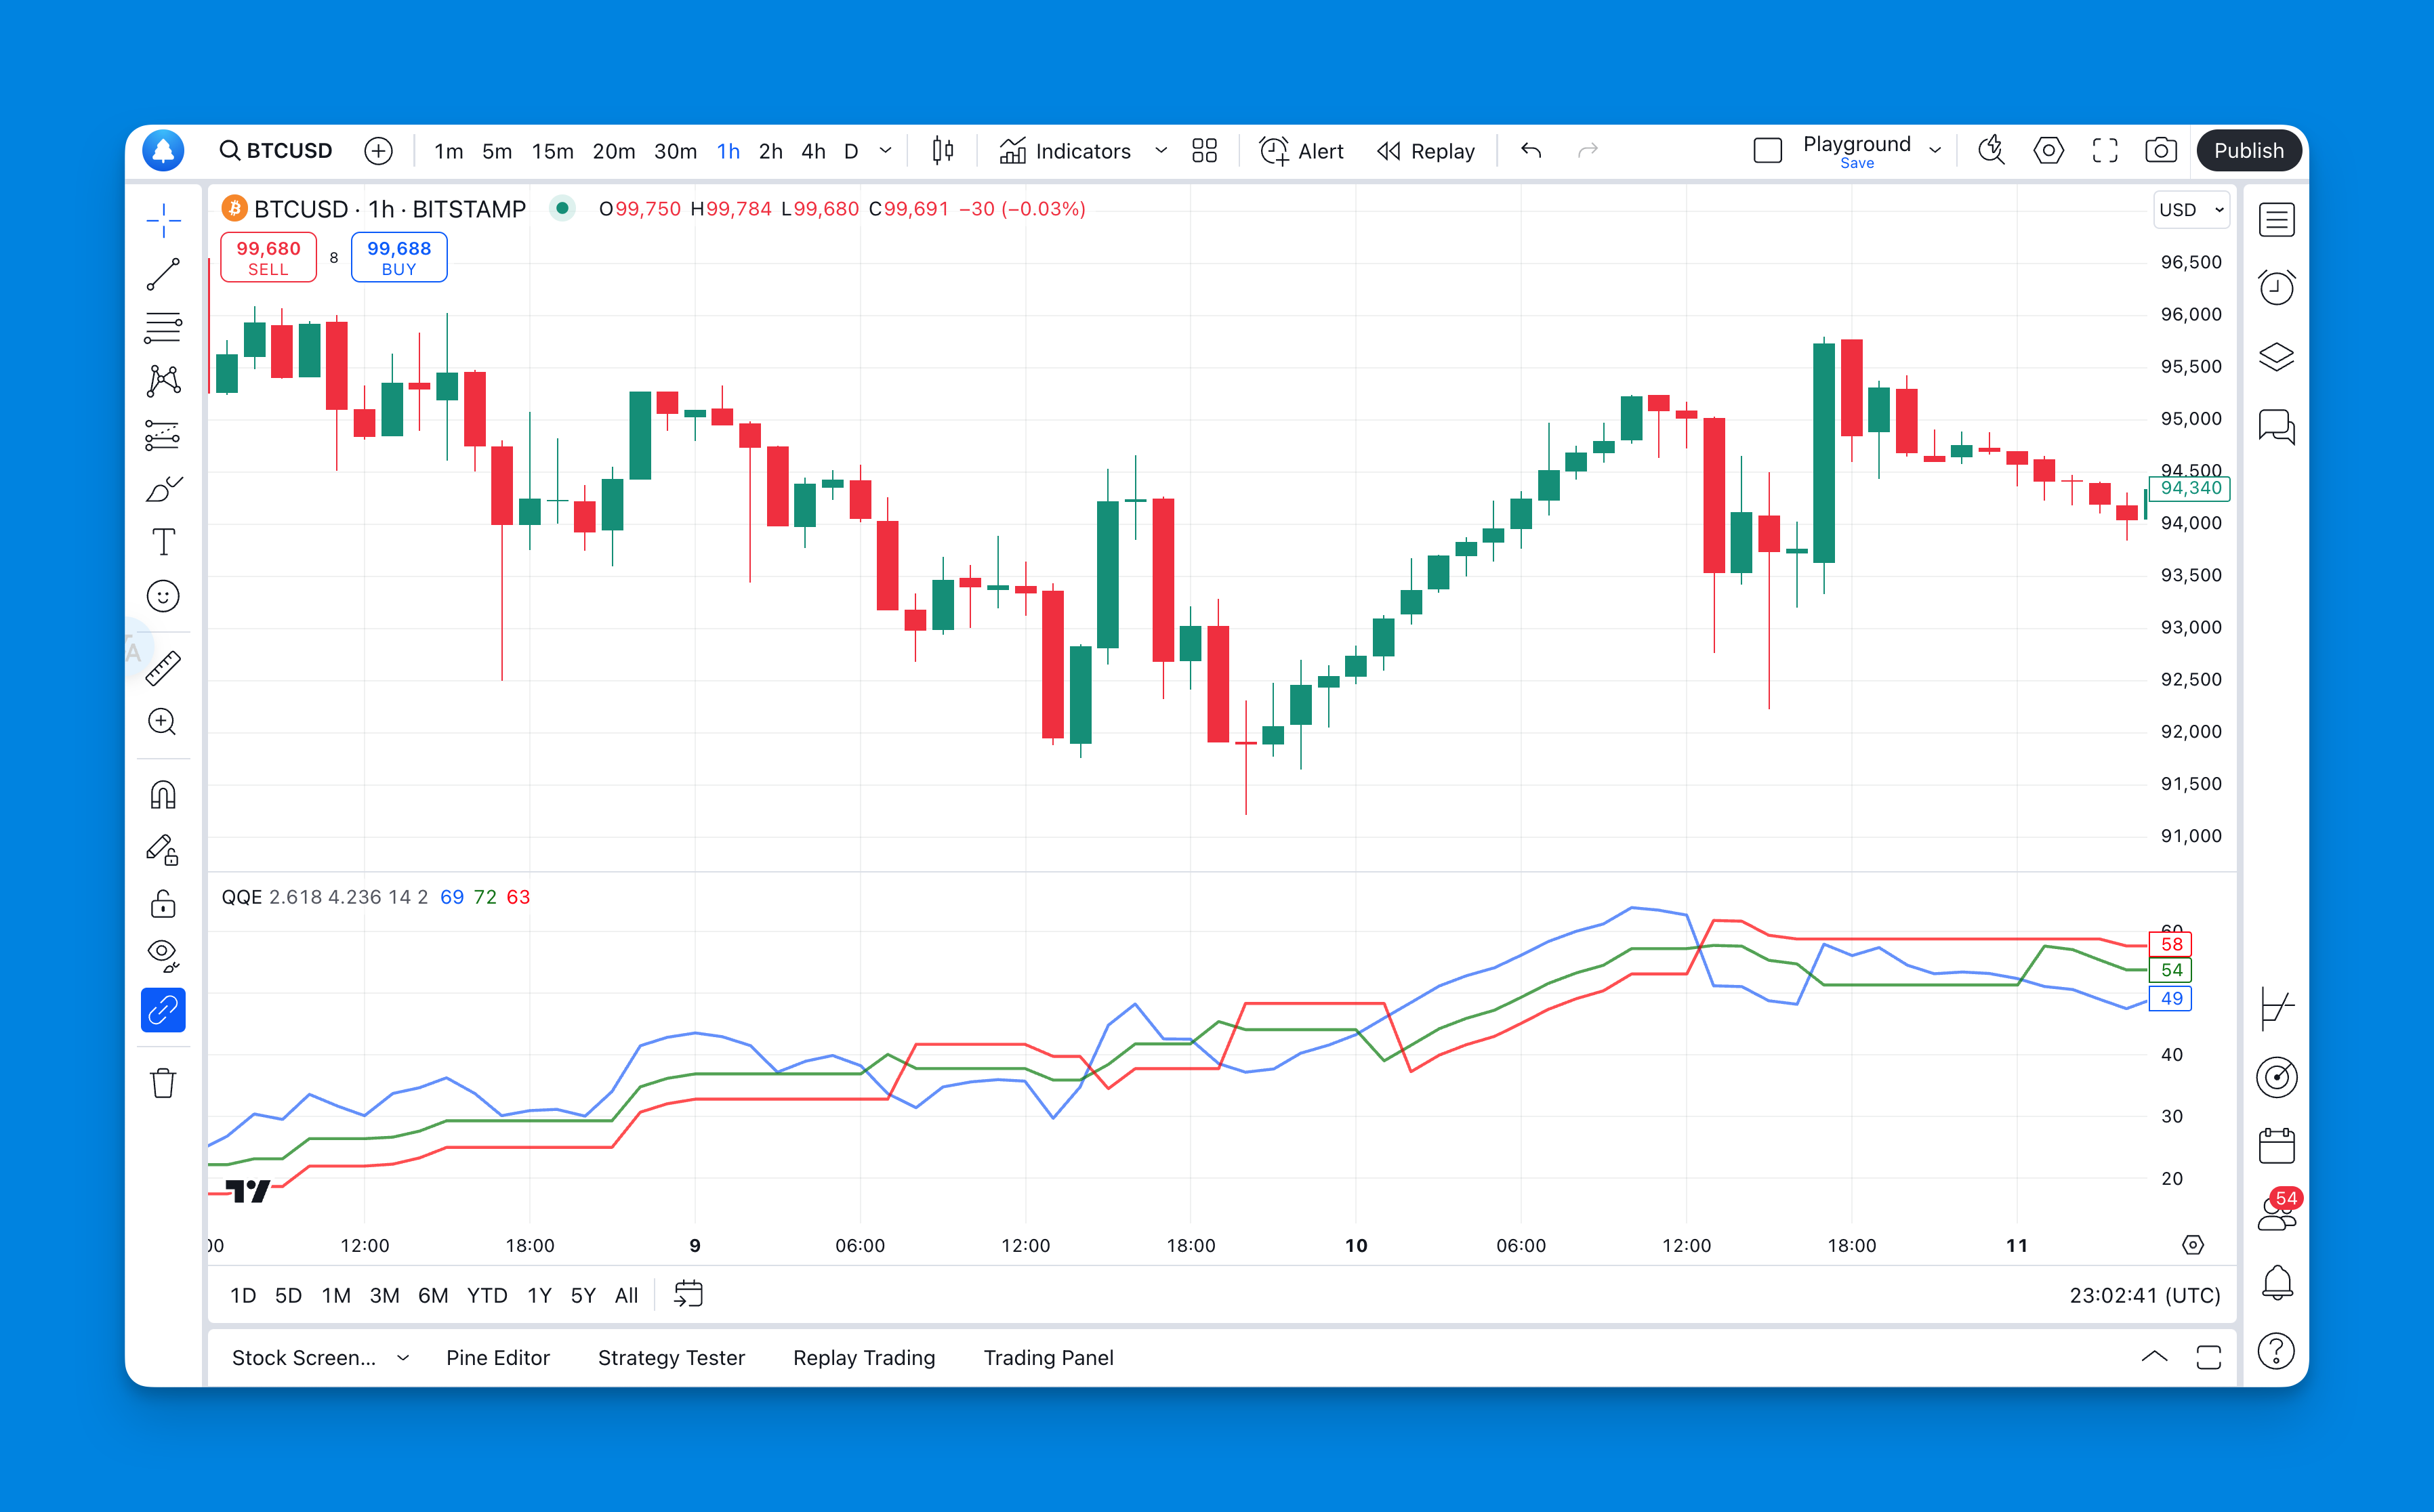
- Set Up Your Chart: Apply the QQE indicator on your trading platform (e.g., TradingView) for your preferred asset.
- Identify Trends: Look at the QQE values to determine whether you are in a bullish or bearish market.
- Watch for Crossover Signals:
- A buy signal occurs when the fast trailing line crosses above the smoothed RSI line.
- A sell signal occurs when it crosses below.
- Confirm with Divergence: Always check for divergence signals to validate your entry or exit points.
- Risk Management: Set stop-loss orders based on recent highs or lows to protect against adverse movements.
- Monitor Overbought/Oversold Levels: Use these levels as additional confirmation for your trades.
Benefits and Limitations of the QQE Indicator
Benefits
- Enhanced Responsiveness: The smoothing technique used in QQE makes it more responsive than traditional RSI.
- Multiple Trading Signals: Provides various signals through crossover points and divergence analysis.
- Versatile Application: Can be applied across different markets including forex, stocks, and commodities.
Limitations
- Lagging Indicator: Like many technical indicators, it may lag behind actual price movements.
- False Signals: In volatile markets, the QQE can produce false signals that may mislead traders if not confirmed with other tools.
Comparing QQE with Other Indicators
To understand where the QQE stands among other indicators, here’s a brief comparison with RSI and Stochastic Oscillator:
| Feature | QQE Indicator | RSI | Stochastic Oscillator |
|---|---|---|---|
| Type | Smoothed Momentum | Momentum Oscillator | Momentum Oscillator |
| Overbought Level | >70 | >70 | >80 |
| Oversold Level | <30 | <30 | <20 |
| Trend Confirmation | Yes | Yes | Yes |
| Divergence Detection | Strong | Moderate | Moderate |
The QQE indicator offers unique advantages in trend detection and responsiveness compared to traditional indicators like RSI and Stochastic Oscillator.
Conclusion
The Quantitative Qualitative Estimation (QQE) indicator is an invaluable tool for traders seeking to enhance their market analysis capabilities. By understanding its components and applications, traders can effectively utilize this indicator to identify trends, overbought/oversold conditions, and potential reversal points.
If you are looking to add the QQE indicator to your trading arsenal, consider using Pineify, a powerful tool that simplifies the process of creating custom indicators without coding. With Pineify, you can effortlessly generate the QQE Indicator and other custom indicators to optimize your trading strategies.
References
- https://howtotrade.com/indicators/qqe-indicator/
- https://www.earnforex.com/metatrader-indicators/QQE/
- https://news.arihantwebtech.com/seo-best-practices-for-stock-market-websites/
- https://www.shopify.com/sg/blog/keyword-research-tools
- https://forexbee.co/qqe-indicator/
- https://aicontentfy.com/en/blog/crafting-seo-article-tips-tricks-and-best-practices
- https://tradingtact.com/qqe-indicator/
- https://market-bulls.com/qqe-indicator/