Best QQE Indicator Strategies for Beginner
In the world of trading, having the right tools and indicators can significantly enhance your decision-making process. One such powerful tool is the Quantitative Qualitative Estimation (QQE) Indicator. This article will explore what the QQE Indicator is, how to integrate it using Pineify, and provide insights into optimal settings and trading strategies.

What is QQE Indicator?

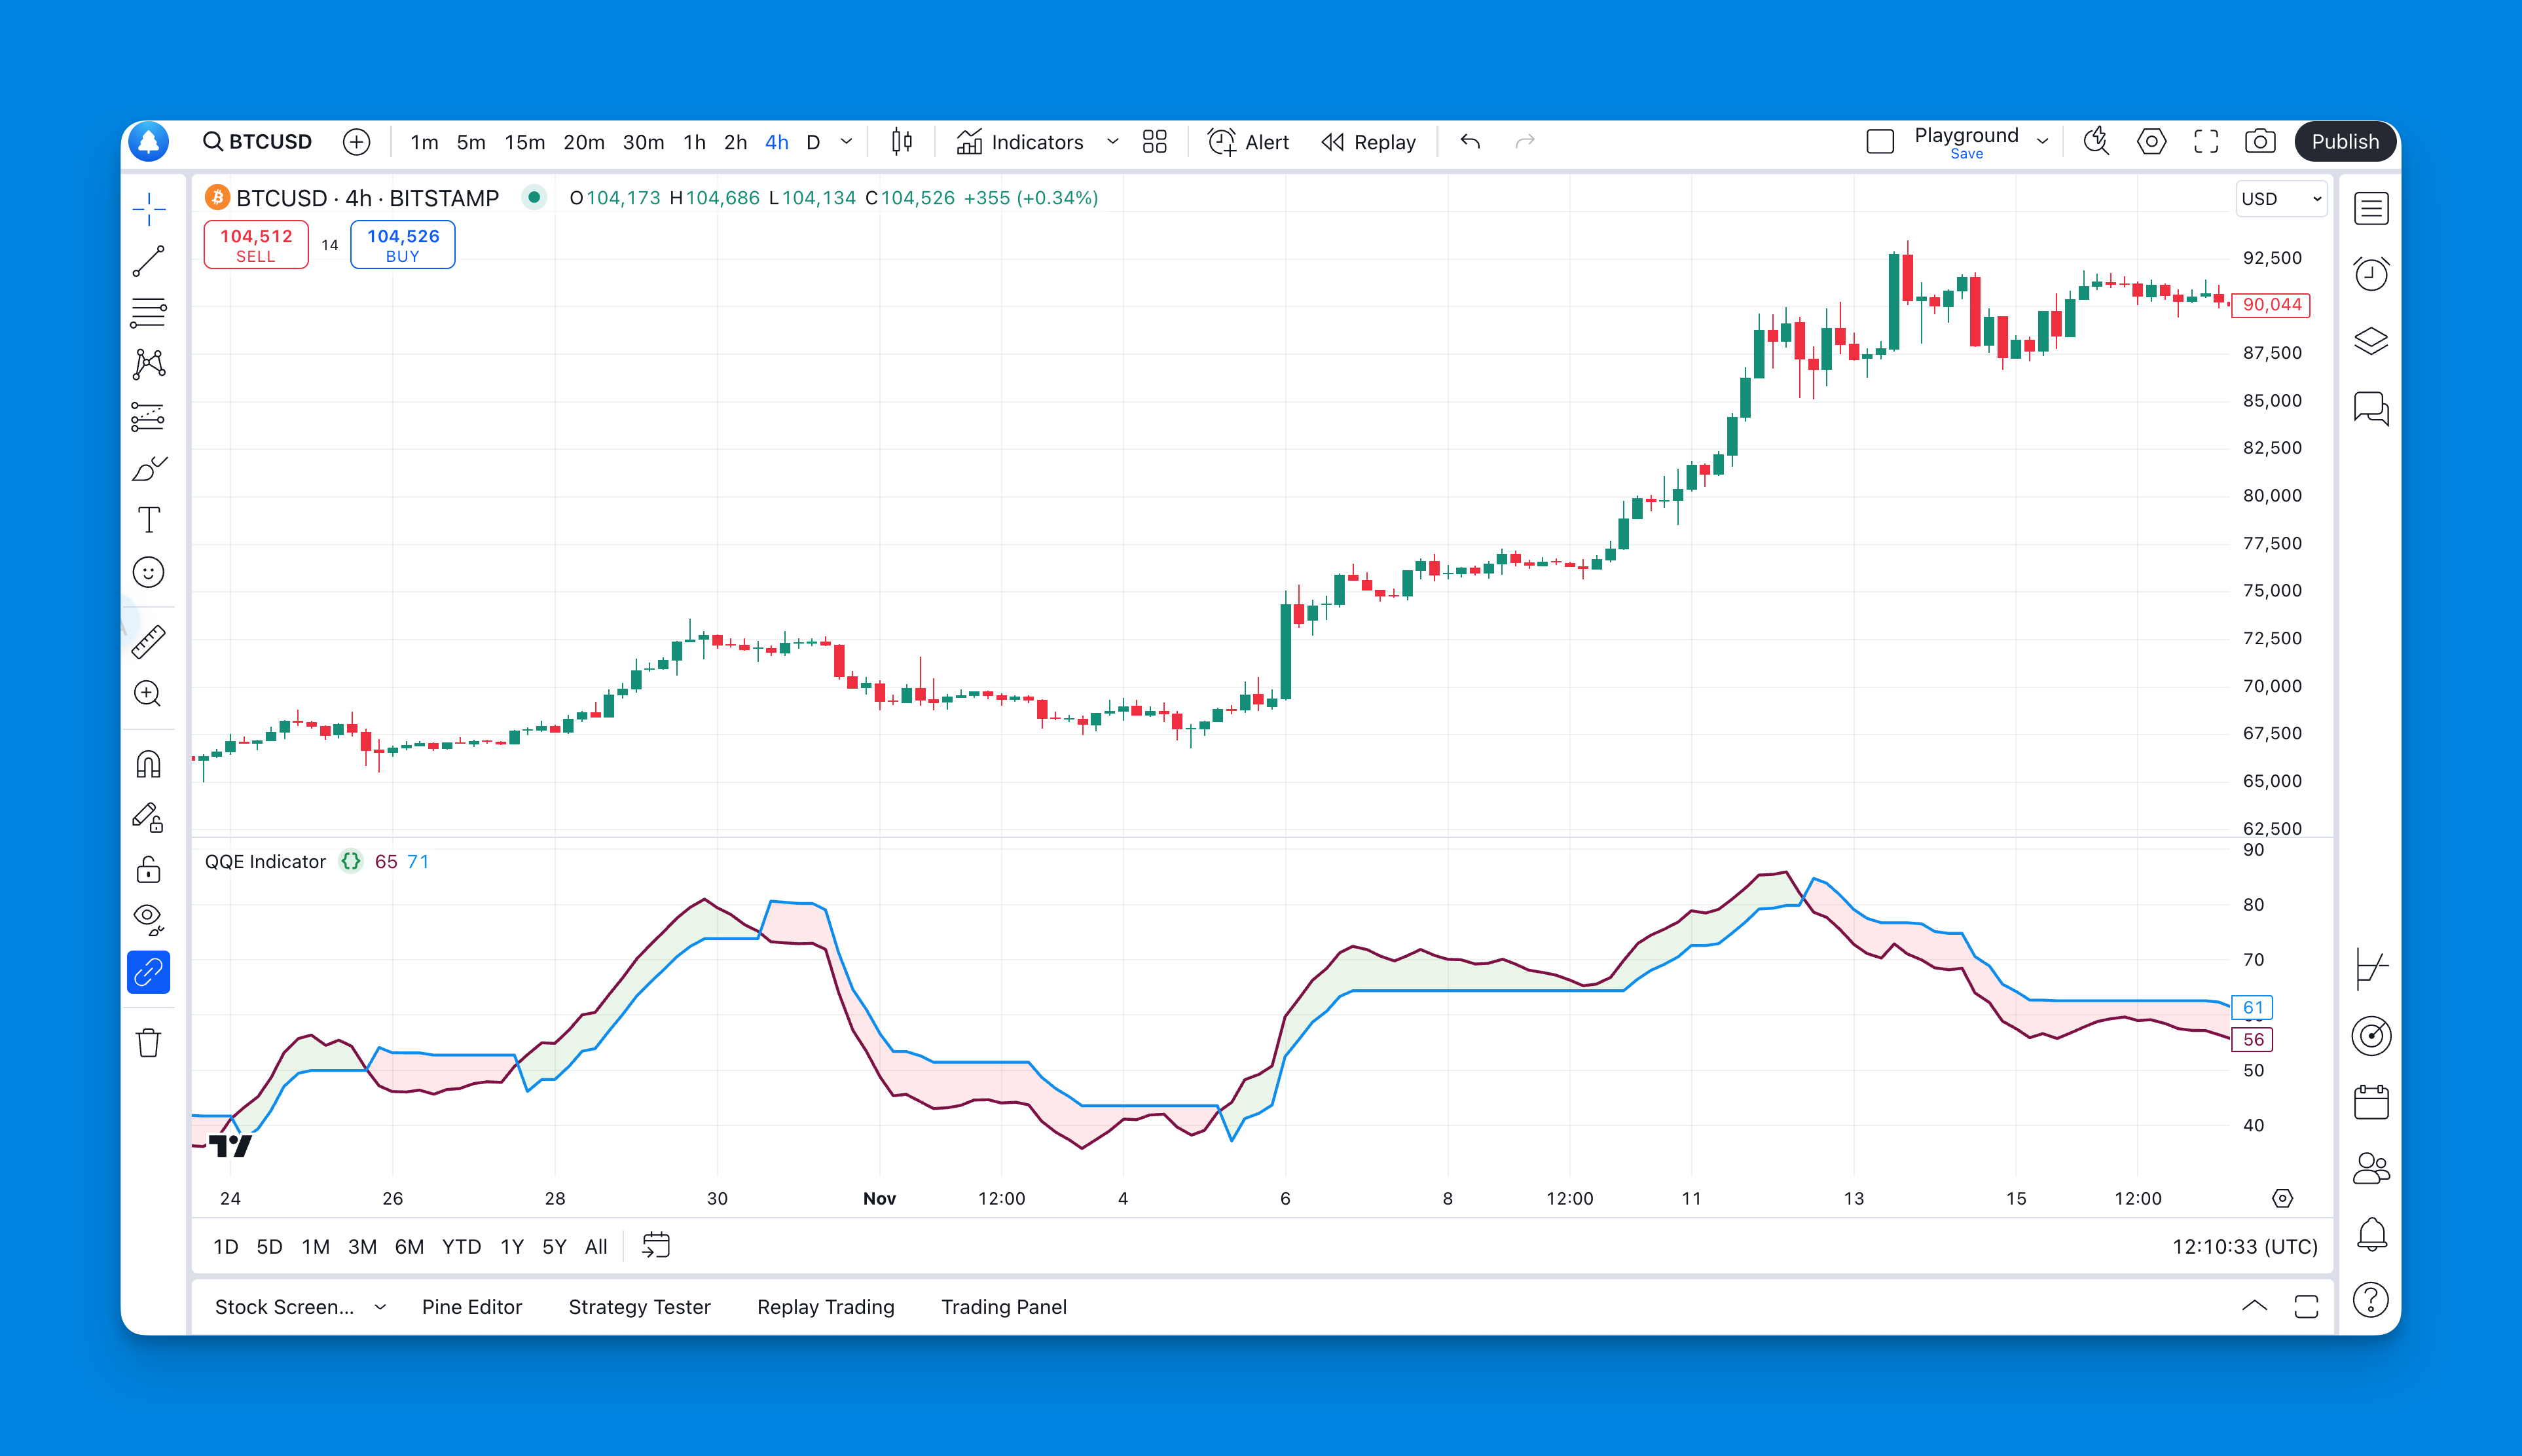
The QQE Indicator is a sophisticated technical analysis tool derived from the well-known Relative Strength Index (RSI). It enhances the traditional RSI by applying a smoothing technique that reduces noise and improves responsiveness to price changes.

Key Features of the QQE Indicator:
- Smoothing Mechanism: The QQE uses Wilder’s smoothing method on the RSI, resulting in a more stable line that better reflects market trends.
- Dual Lines: The QQE consists of two main lines:
- The smoothed RSI line, which indicates momentum.
- The slow trailing line, which helps identify potential buy or sell signals.
- Value Ranges: The QQE values range from 0 to 100:
- Values above 50 suggest a bullish trend.
- Values below 50 indicate a bearish trend.
- Levels above 70 signal overbought conditions, while levels below 30 indicate oversold conditions.
Applications of the QQE Indicator:
- Trend Detection: Traders can use QQE to confirm market trends, with values above or below 50 guiding their trading decisions.
- Overbought/Oversold Conditions: The QQE helps identify potential reversals by signaling when an asset is overbought or oversold.
- Divergence Signals: By comparing price movement with QQE lines, traders can spot divergences that may indicate impending trend reversals.
What is Pineify?
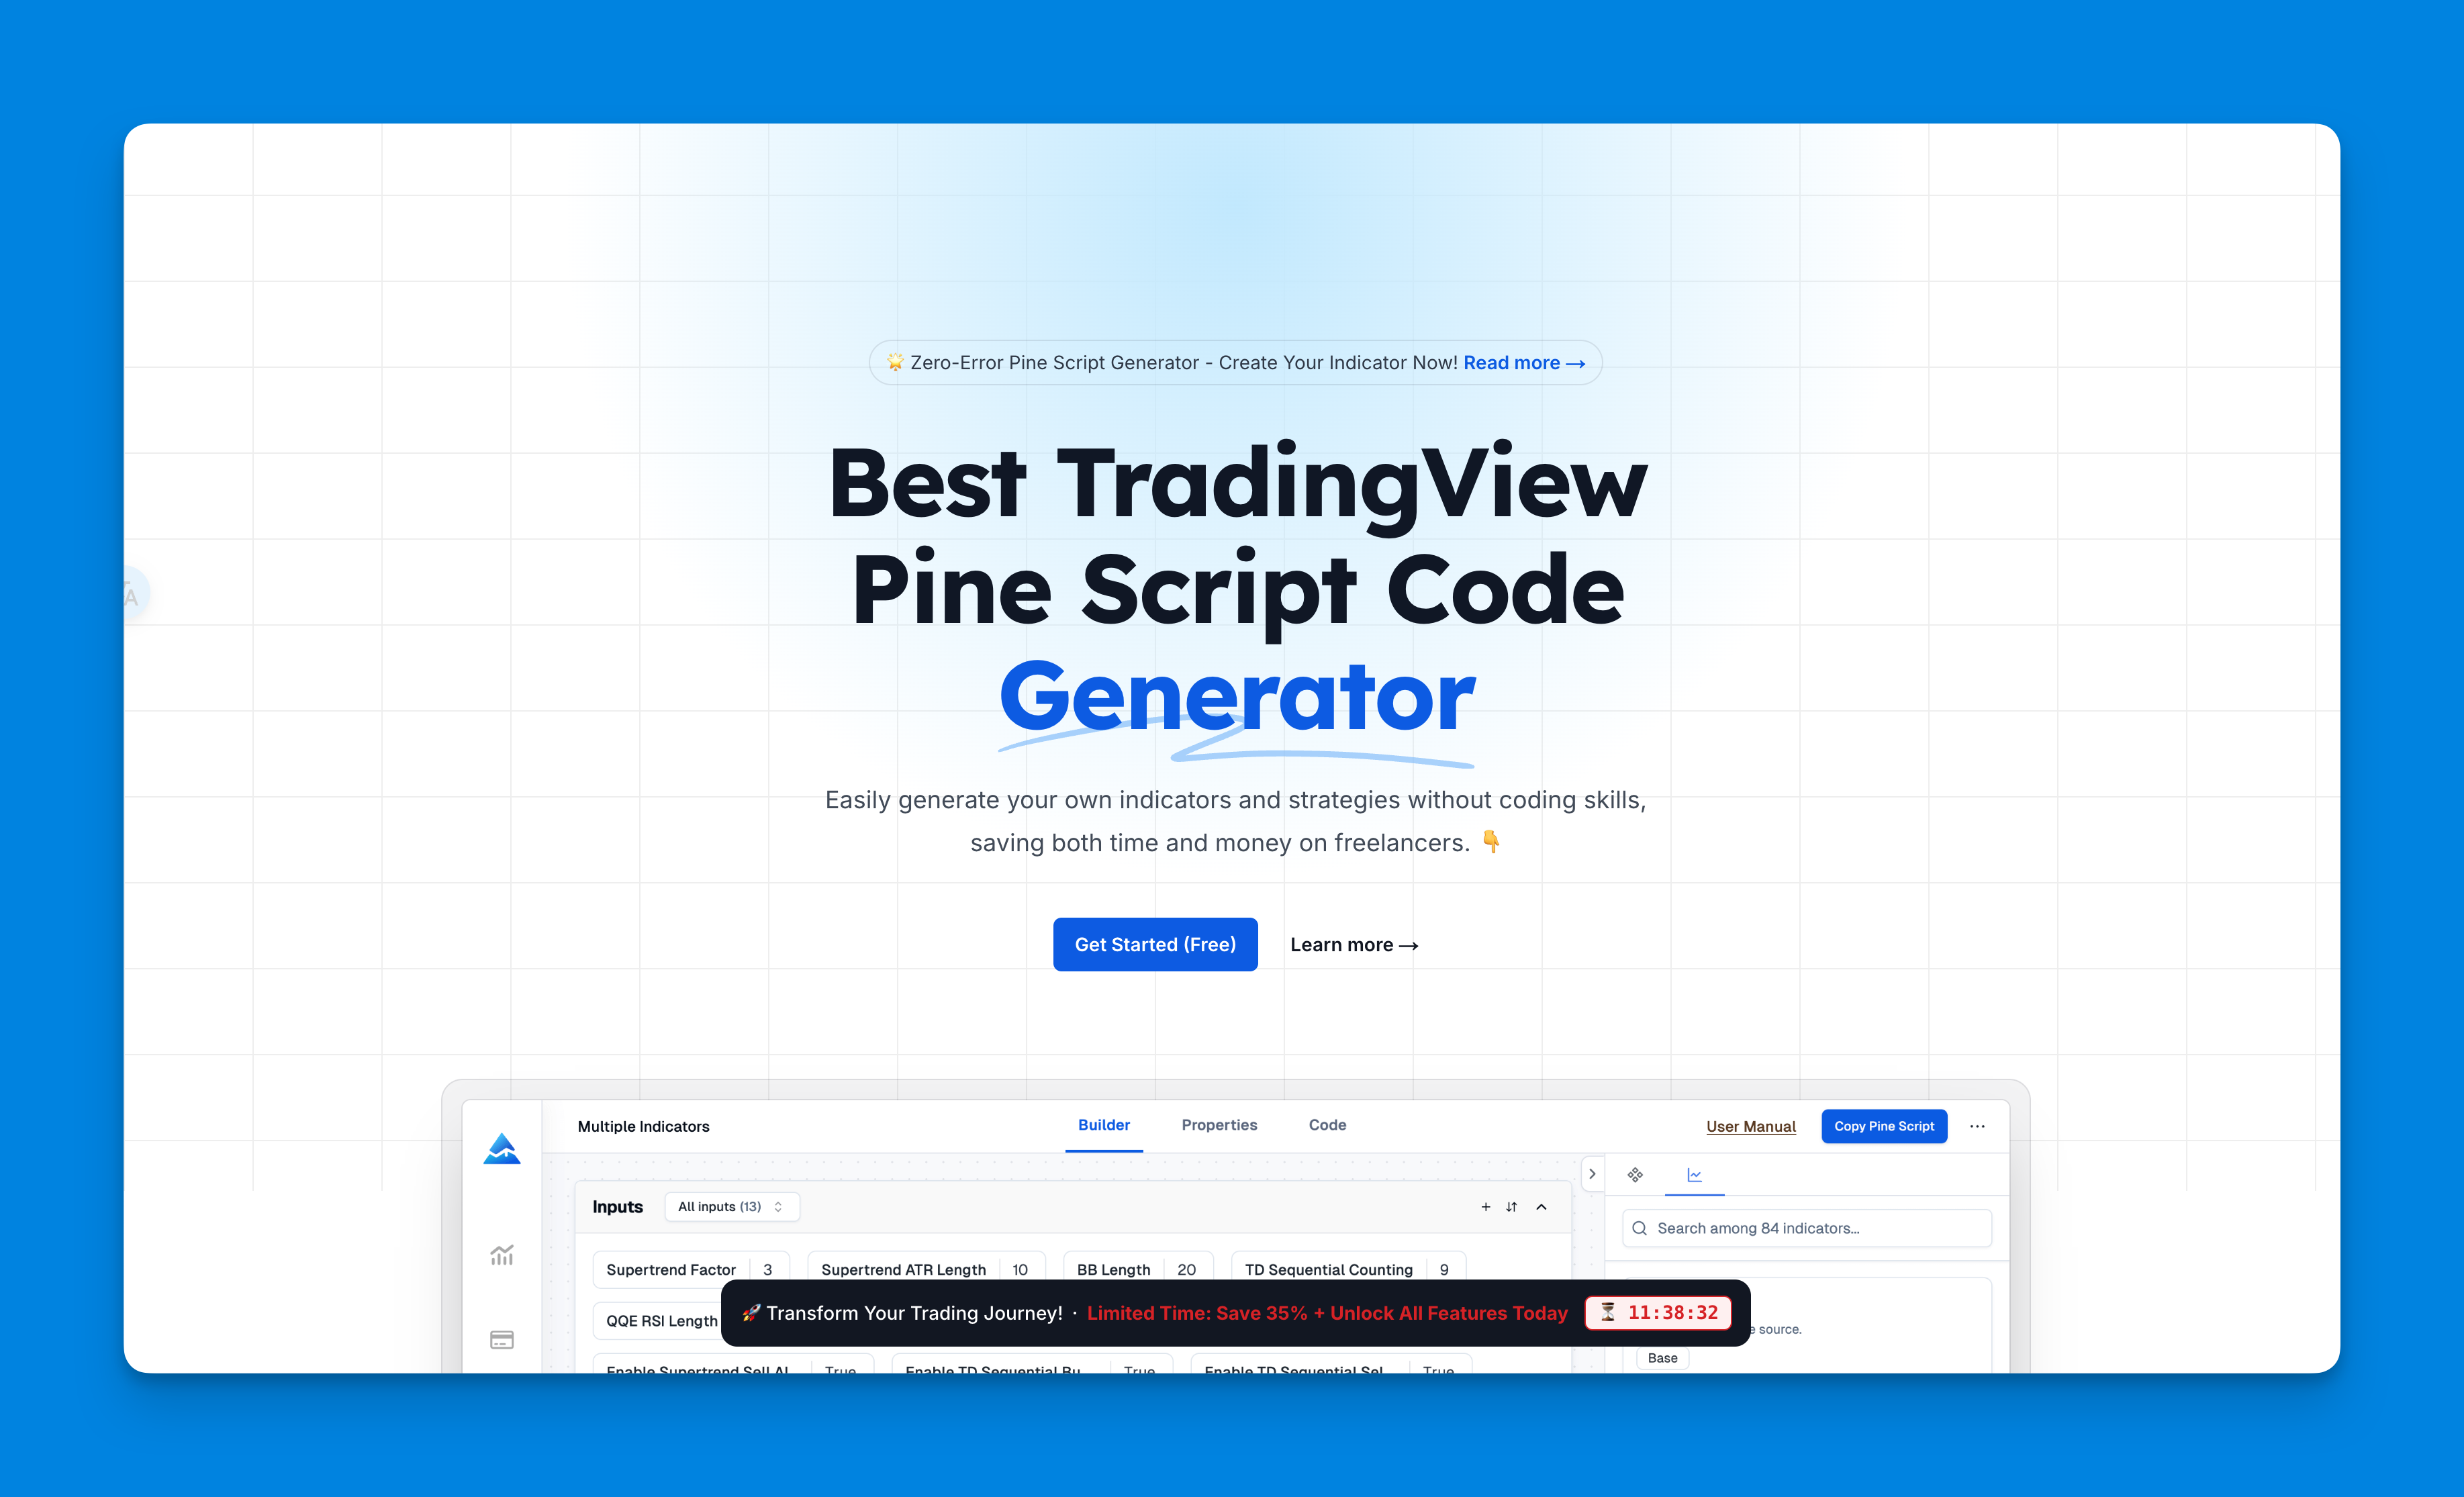
Pineify is an innovative no-code tool designed specifically for traders using TradingView. It allows users to create and manage custom indicators and strategies without any programming knowledge.

Key Features of Pineify:
- Unlimited Indicators: Unlike TradingView's limitation of two indicators per chart, Pineify allows users to add as many indicators as needed.
- Visual Interface: Pineify offers a user-friendly visual interface that simplifies the process of creating complex trading strategies.
- Backtesting Capabilities: Users can backtest their strategies against historical data to ensure effectiveness before live deployment.
- Import Custom Code: Traders can import their own Pine Script code into Pineify for further customization.
Add QQE Indicator Using Pineify
Integrating the QQE Indicator into your TradingView charts using Pineify is straightforward and requires no coding skills. Here’s how you can do it:
- Access Pineify: Sign up for an account on Pineify and navigate to the dashboard.
- Create New Indicator:
- Select "Create Indicator" from the menu.
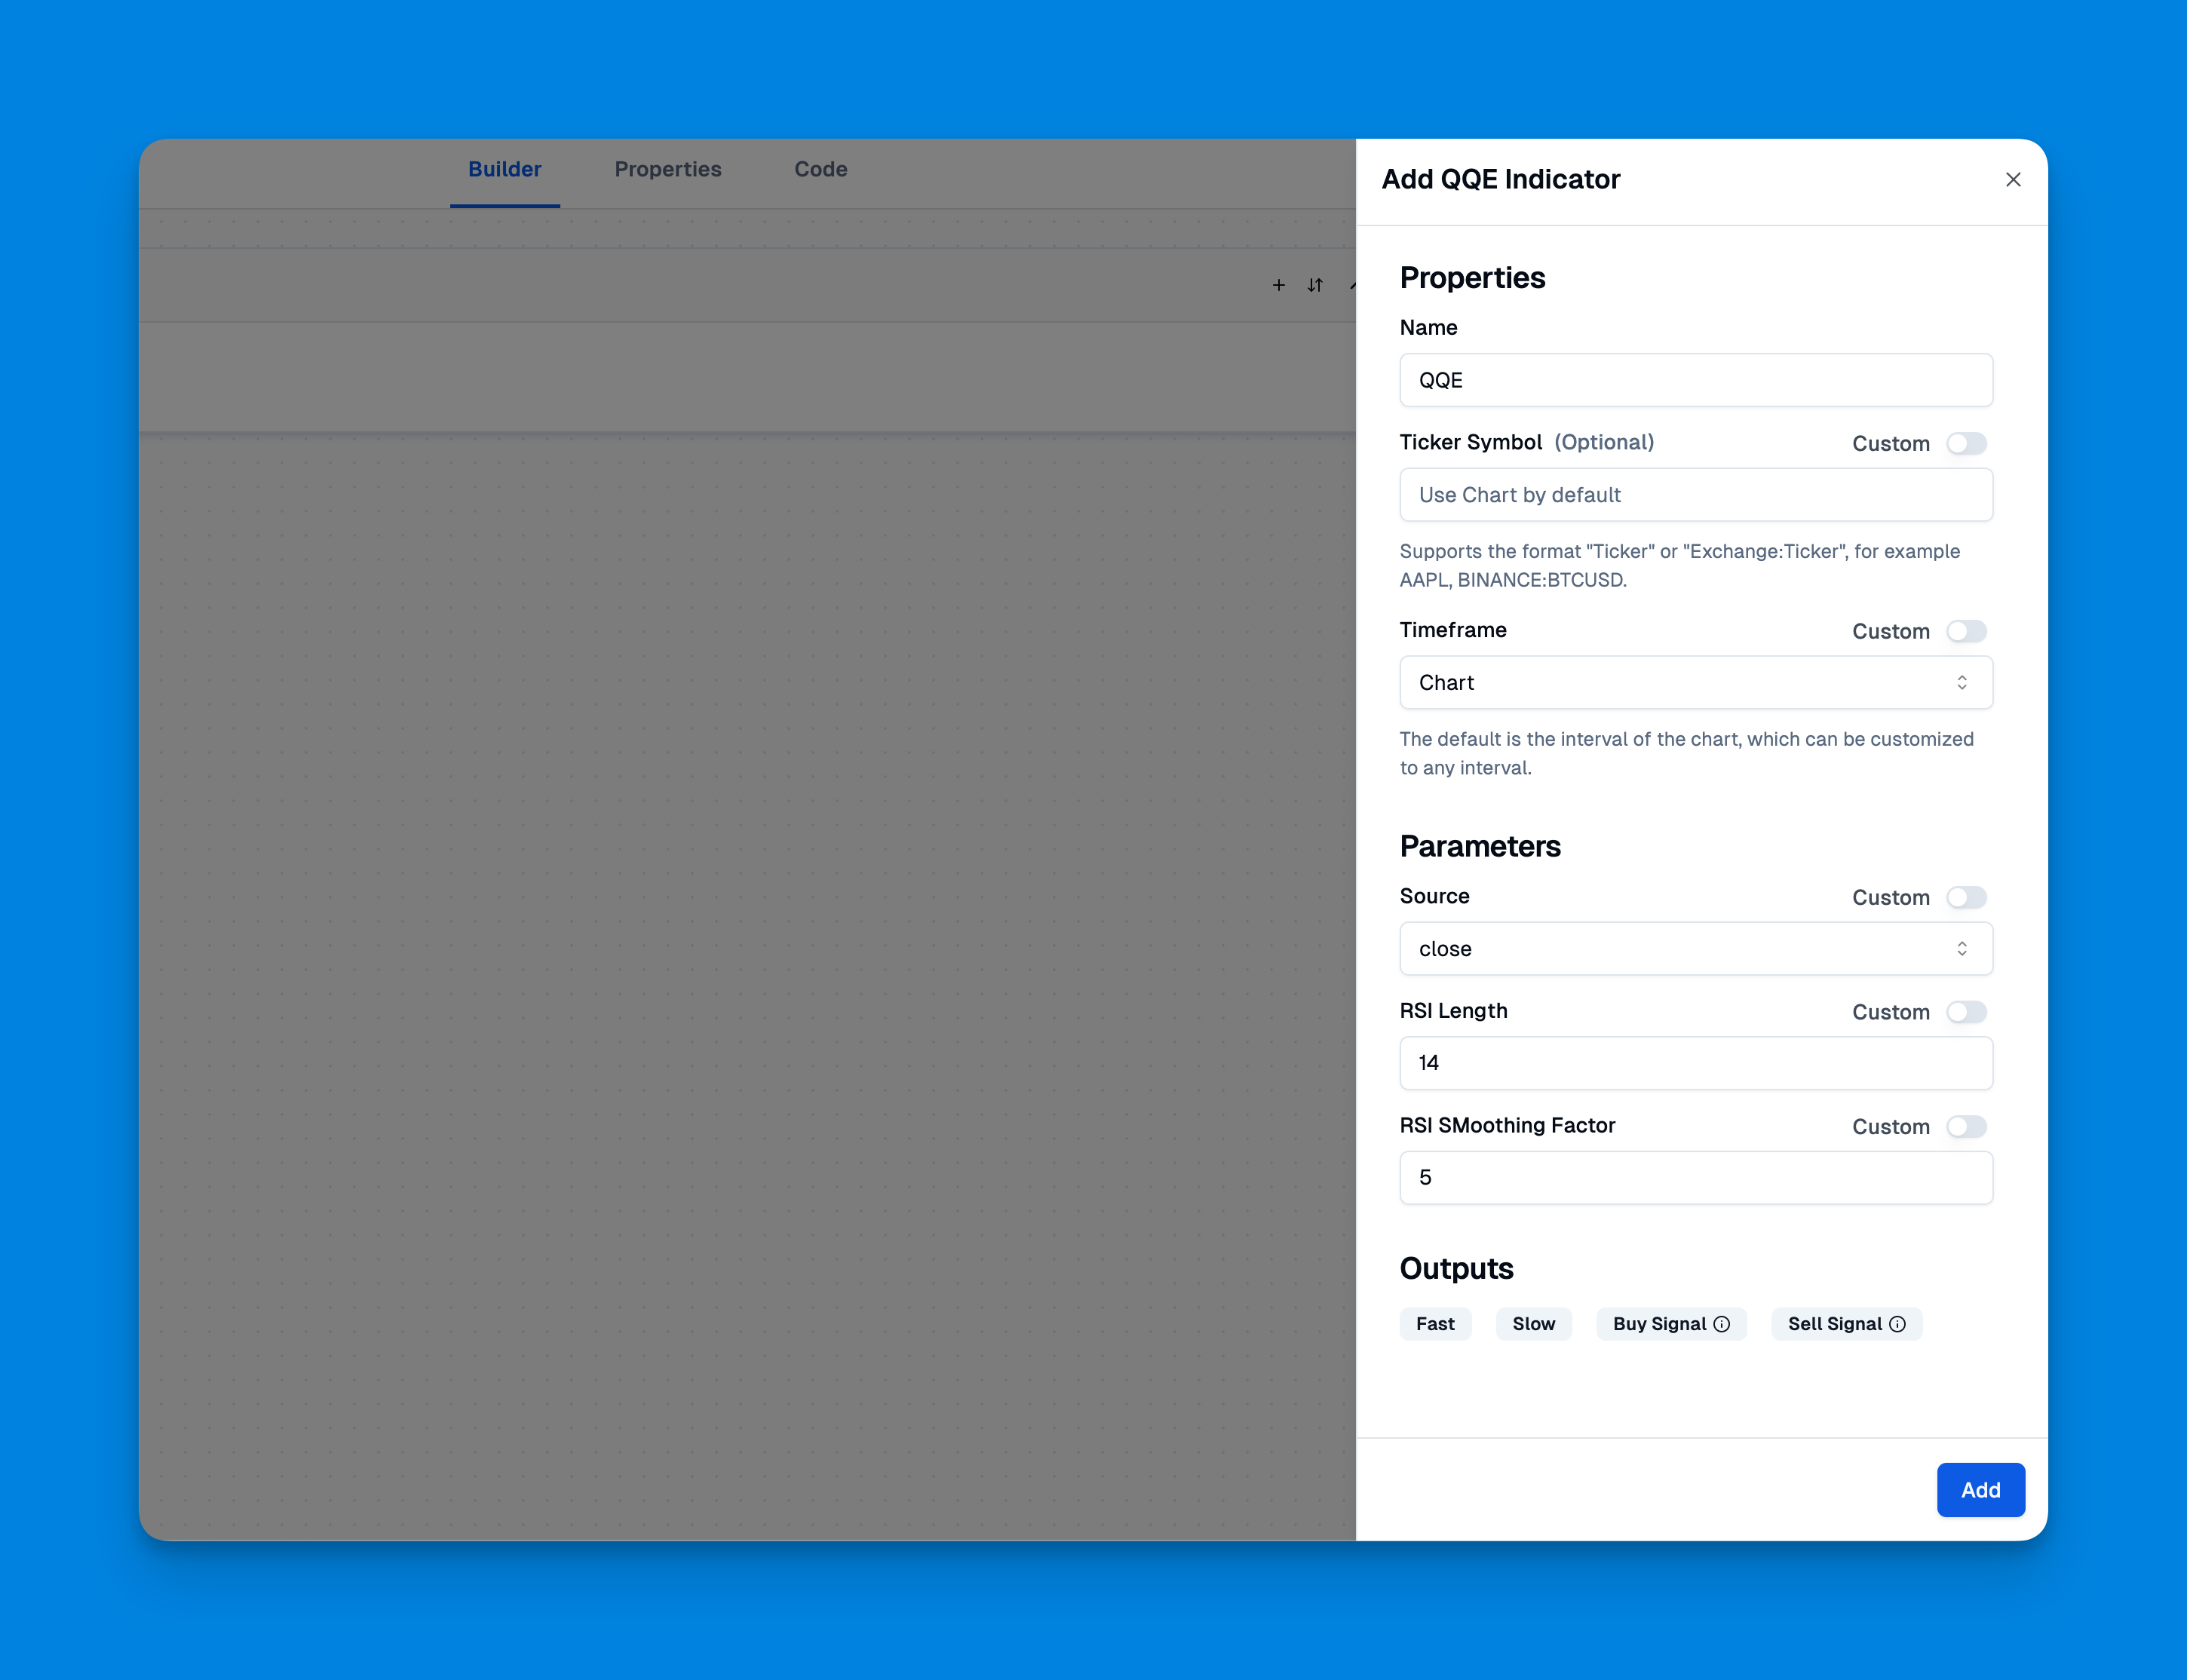
- Search "QQE" from the list of available indicators.
- Customize Settings:
- Adjust parameters such as RSI length, smoothing factor, and Fibonacci value according to your preferences or recommended settings.

- Generate Code:
- Once you’ve configured your QQE settings, click on "Copy Pine Script."
- Copy the generated code into TradingView's Pine Editor.
- Add to Chart:
- Click "Add to Chart" in TradingView to visualize your QQE Indicator alongside other technical analysis tools.

Click here to view all the features of Pineify.
Best QQE Indicator Settings
Finding the optimal settings for the QQE Indicator can enhance its effectiveness in trading strategies. Here are some commonly recommended settings:
| Input | Value |
|---|---|
| RSI Length | 14 |
| Exponential Moving Average | 5 |
These settings help balance sensitivity and reliability, allowing traders to capture significant market movements while minimizing false signals.
How to Trade with QQE Indicator
Trading with the QQE Indicator involves several key strategies that leverage its unique features:
Trend Following Strategy:
- Identify Trend Direction:
- Use the QQE value to determine if you are in a bullish (above 50) or bearish (below 50) market.
- Signal Confirmation:
- A buy signal occurs when the smoothed RSI line crosses above the slow trailing line.
- A sell signal happens when it crosses below.
- Divergence Analysis:
- Look for divergences between price action and QQE lines to identify potential reversals.
Overbought/Oversold Strategy:
- Monitor QQE levels:
- Enter long positions when QQE crosses above 30 (oversold).
- Consider short positions when it crosses below 70 (overbought).
- Confirm with Candlestick Patterns:
- Look for bullish candlestick patterns at oversold levels or bearish patterns at overbought levels before entering trades.
Risk Management:
- Always set stop-loss orders based on recent highs or lows to protect against adverse movements.
- Consider using trailing stops as trends develop to lock in profits while allowing for further gains.
Conclusion
The QQE Indicator is a powerful tool that can enhance your trading strategy by providing clear signals for market trends and potential reversals. When combined with Pineify's user-friendly interface, traders can easily implement this indicator without needing extensive coding knowledge.
By understanding how to effectively use the QQE Indicator alongside optimal settings and trading strategies, you can improve your trading outcomes significantly.
Ready to elevate your trading game? Explore Pineify today and start creating custom indicators like the QQE without any coding hassle!
