Unlocking the Power of Pine Script: A Deep Dive into ta.change()
As a trader or developer working with financial charts, understanding how to leverage Pine Script functions is crucial for creating effective trading indicators and strategies. One of the most versatile and powerful functions in Pine Script is ta.change(), which allows users to track changes in data points over time. In this article, we’ll explore the syntax, applications, and benefits of using ta.change() in your trading analysis.
What is ta.change()?
The ta.change() function is designed to detect changes in a series of values, whether they are integers, floats, or boolean values. It is particularly useful for identifying shifts in market trends or the start of new time periods, such as the beginning of a new trading day.
Syntax and Overloads
ta.change() offers several overloads, allowing it to adapt to different data types and scenarios:
ta.change(source): Compares the current value with its previous value.ta.change(source, length): Allows specifying the number of bars ago to compare with the current value.

This flexibility makes ta.change() a go-to tool for various trading strategies and indicators.
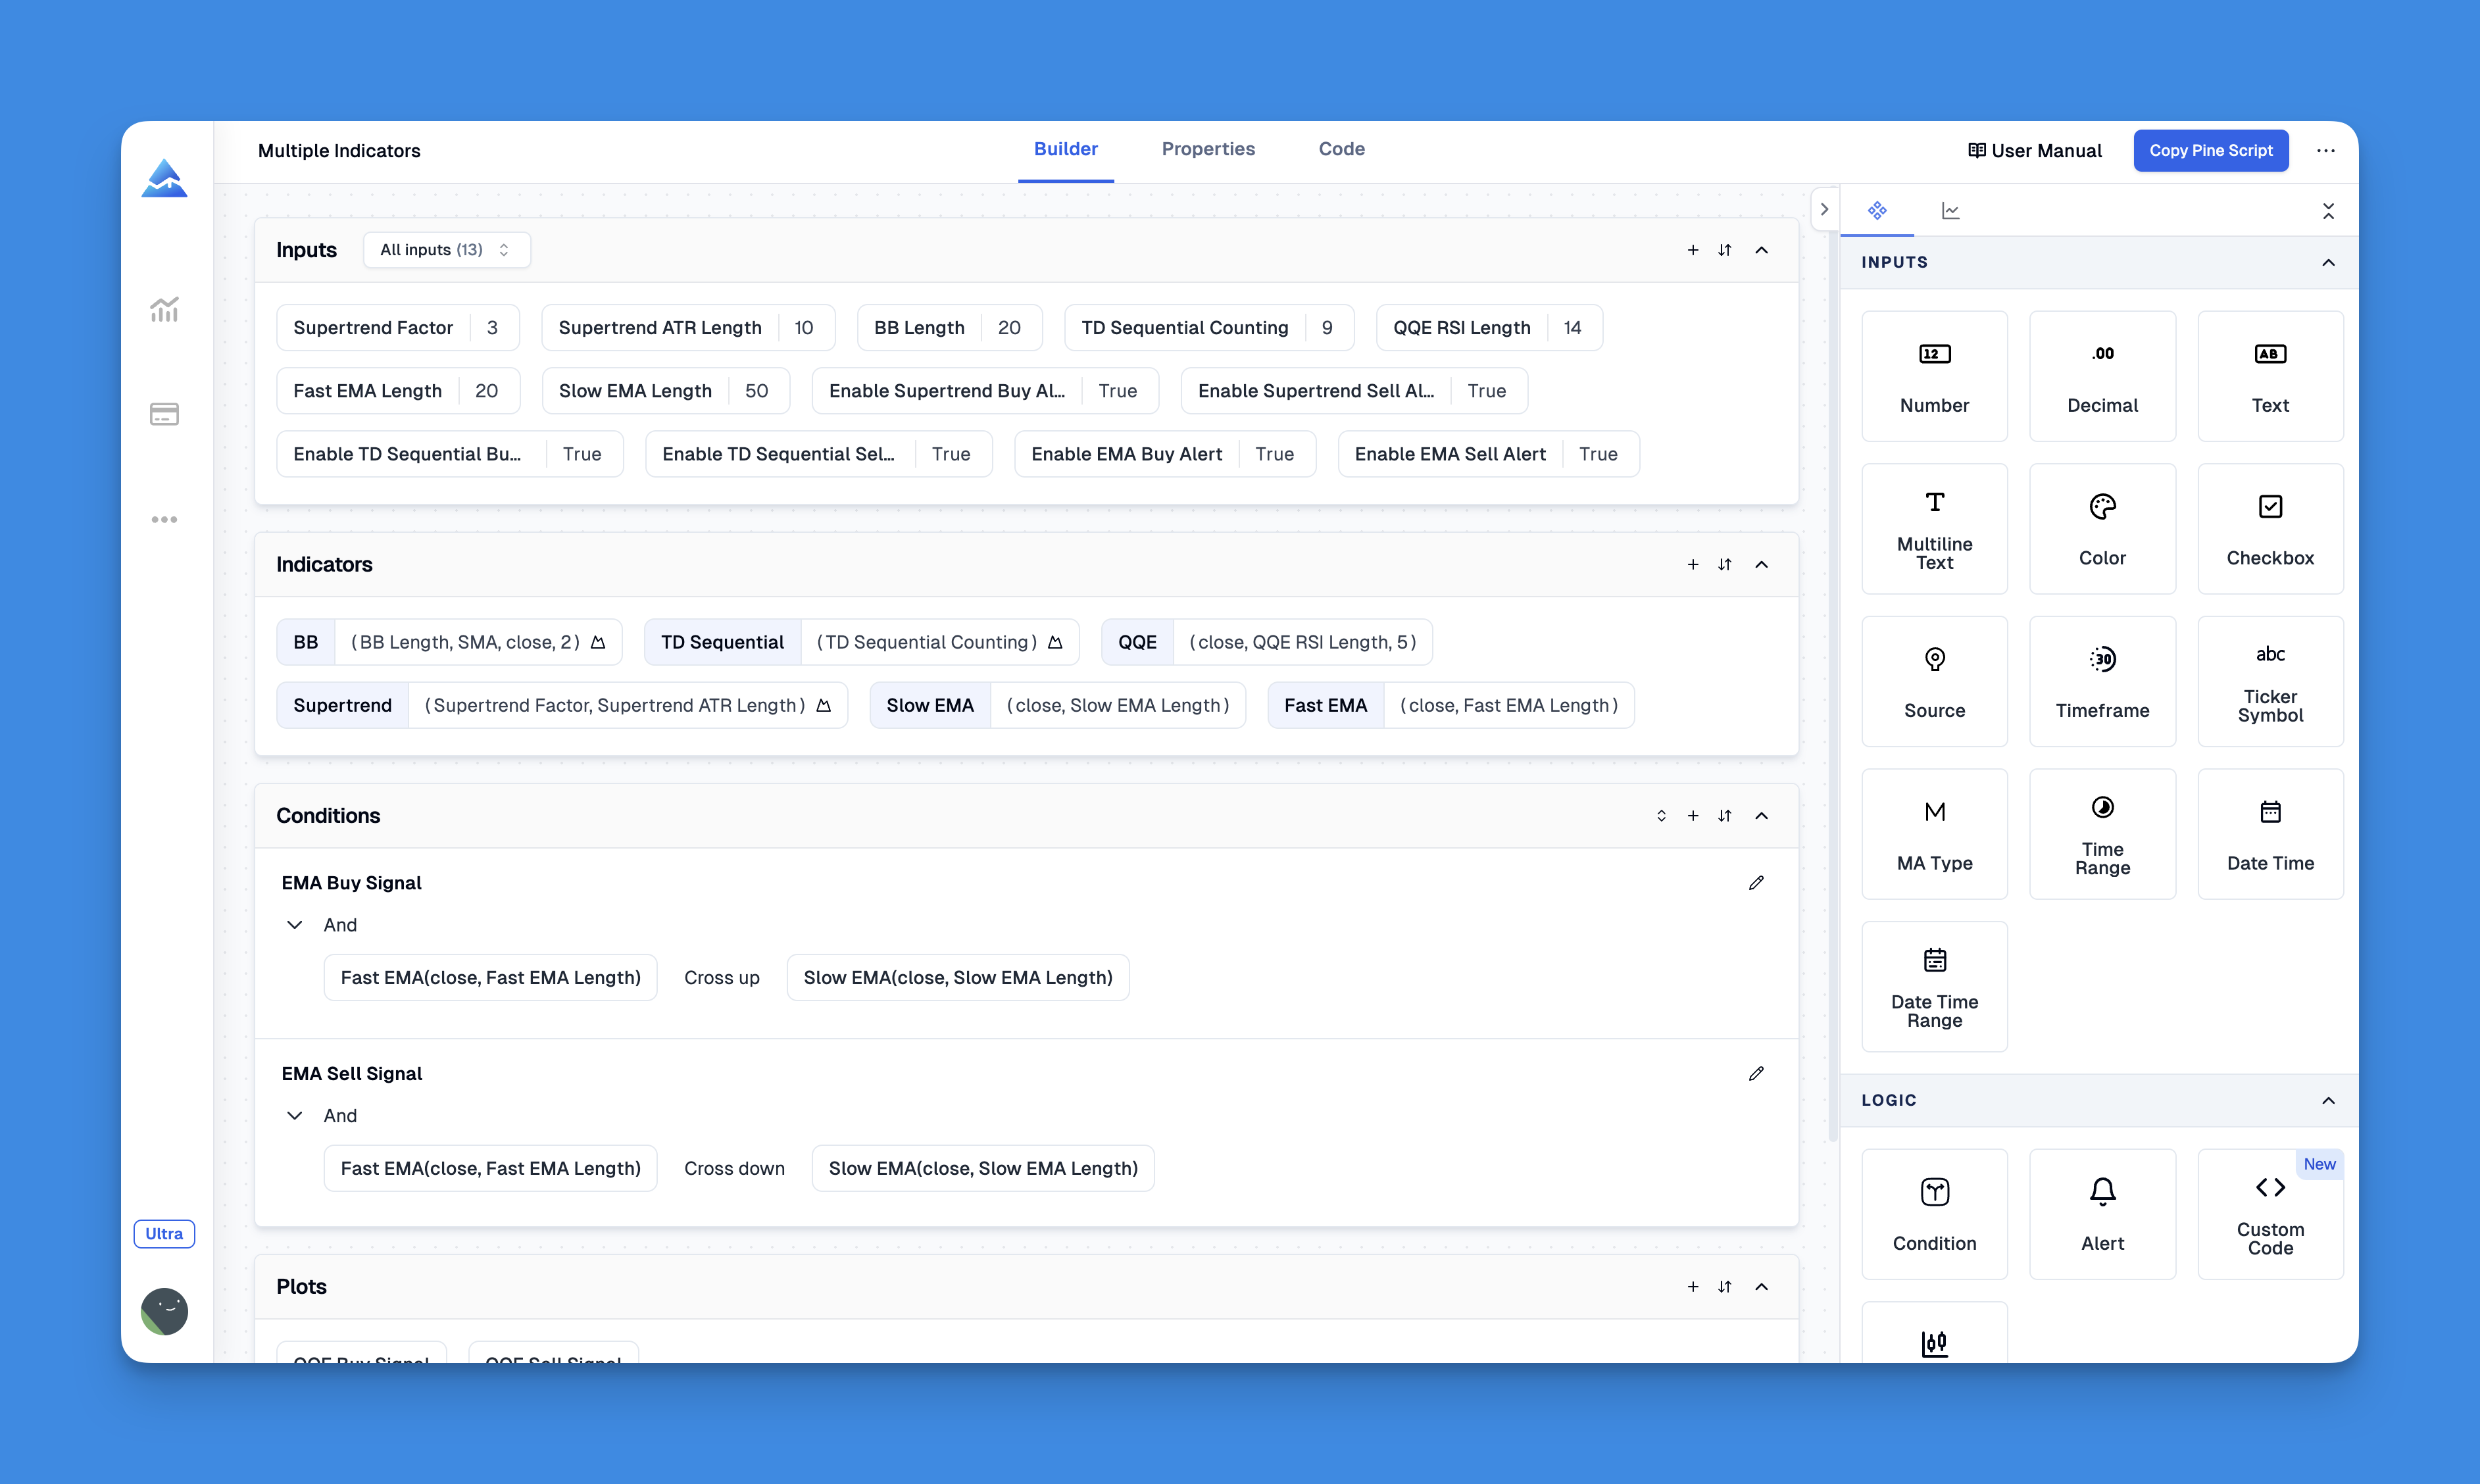
Simplifying Complex Indicators: How Pineify Transforms ta.change() Implementation
The ta.change() function stands as one of Pine Script's most versatile tools for detecting price movements and developing momentum-based trading strategies. However, implementing this function effectively often requires substantial coding knowledge that many traders lack.

Pineify addresses this challenge by providing an intuitive, code-free environment where traders can harness the power of technical functions like ta.change() without writing a single line of code.
Website: Pineify
Click here to view all the features of Pineify.Practical Applications of ta.change()
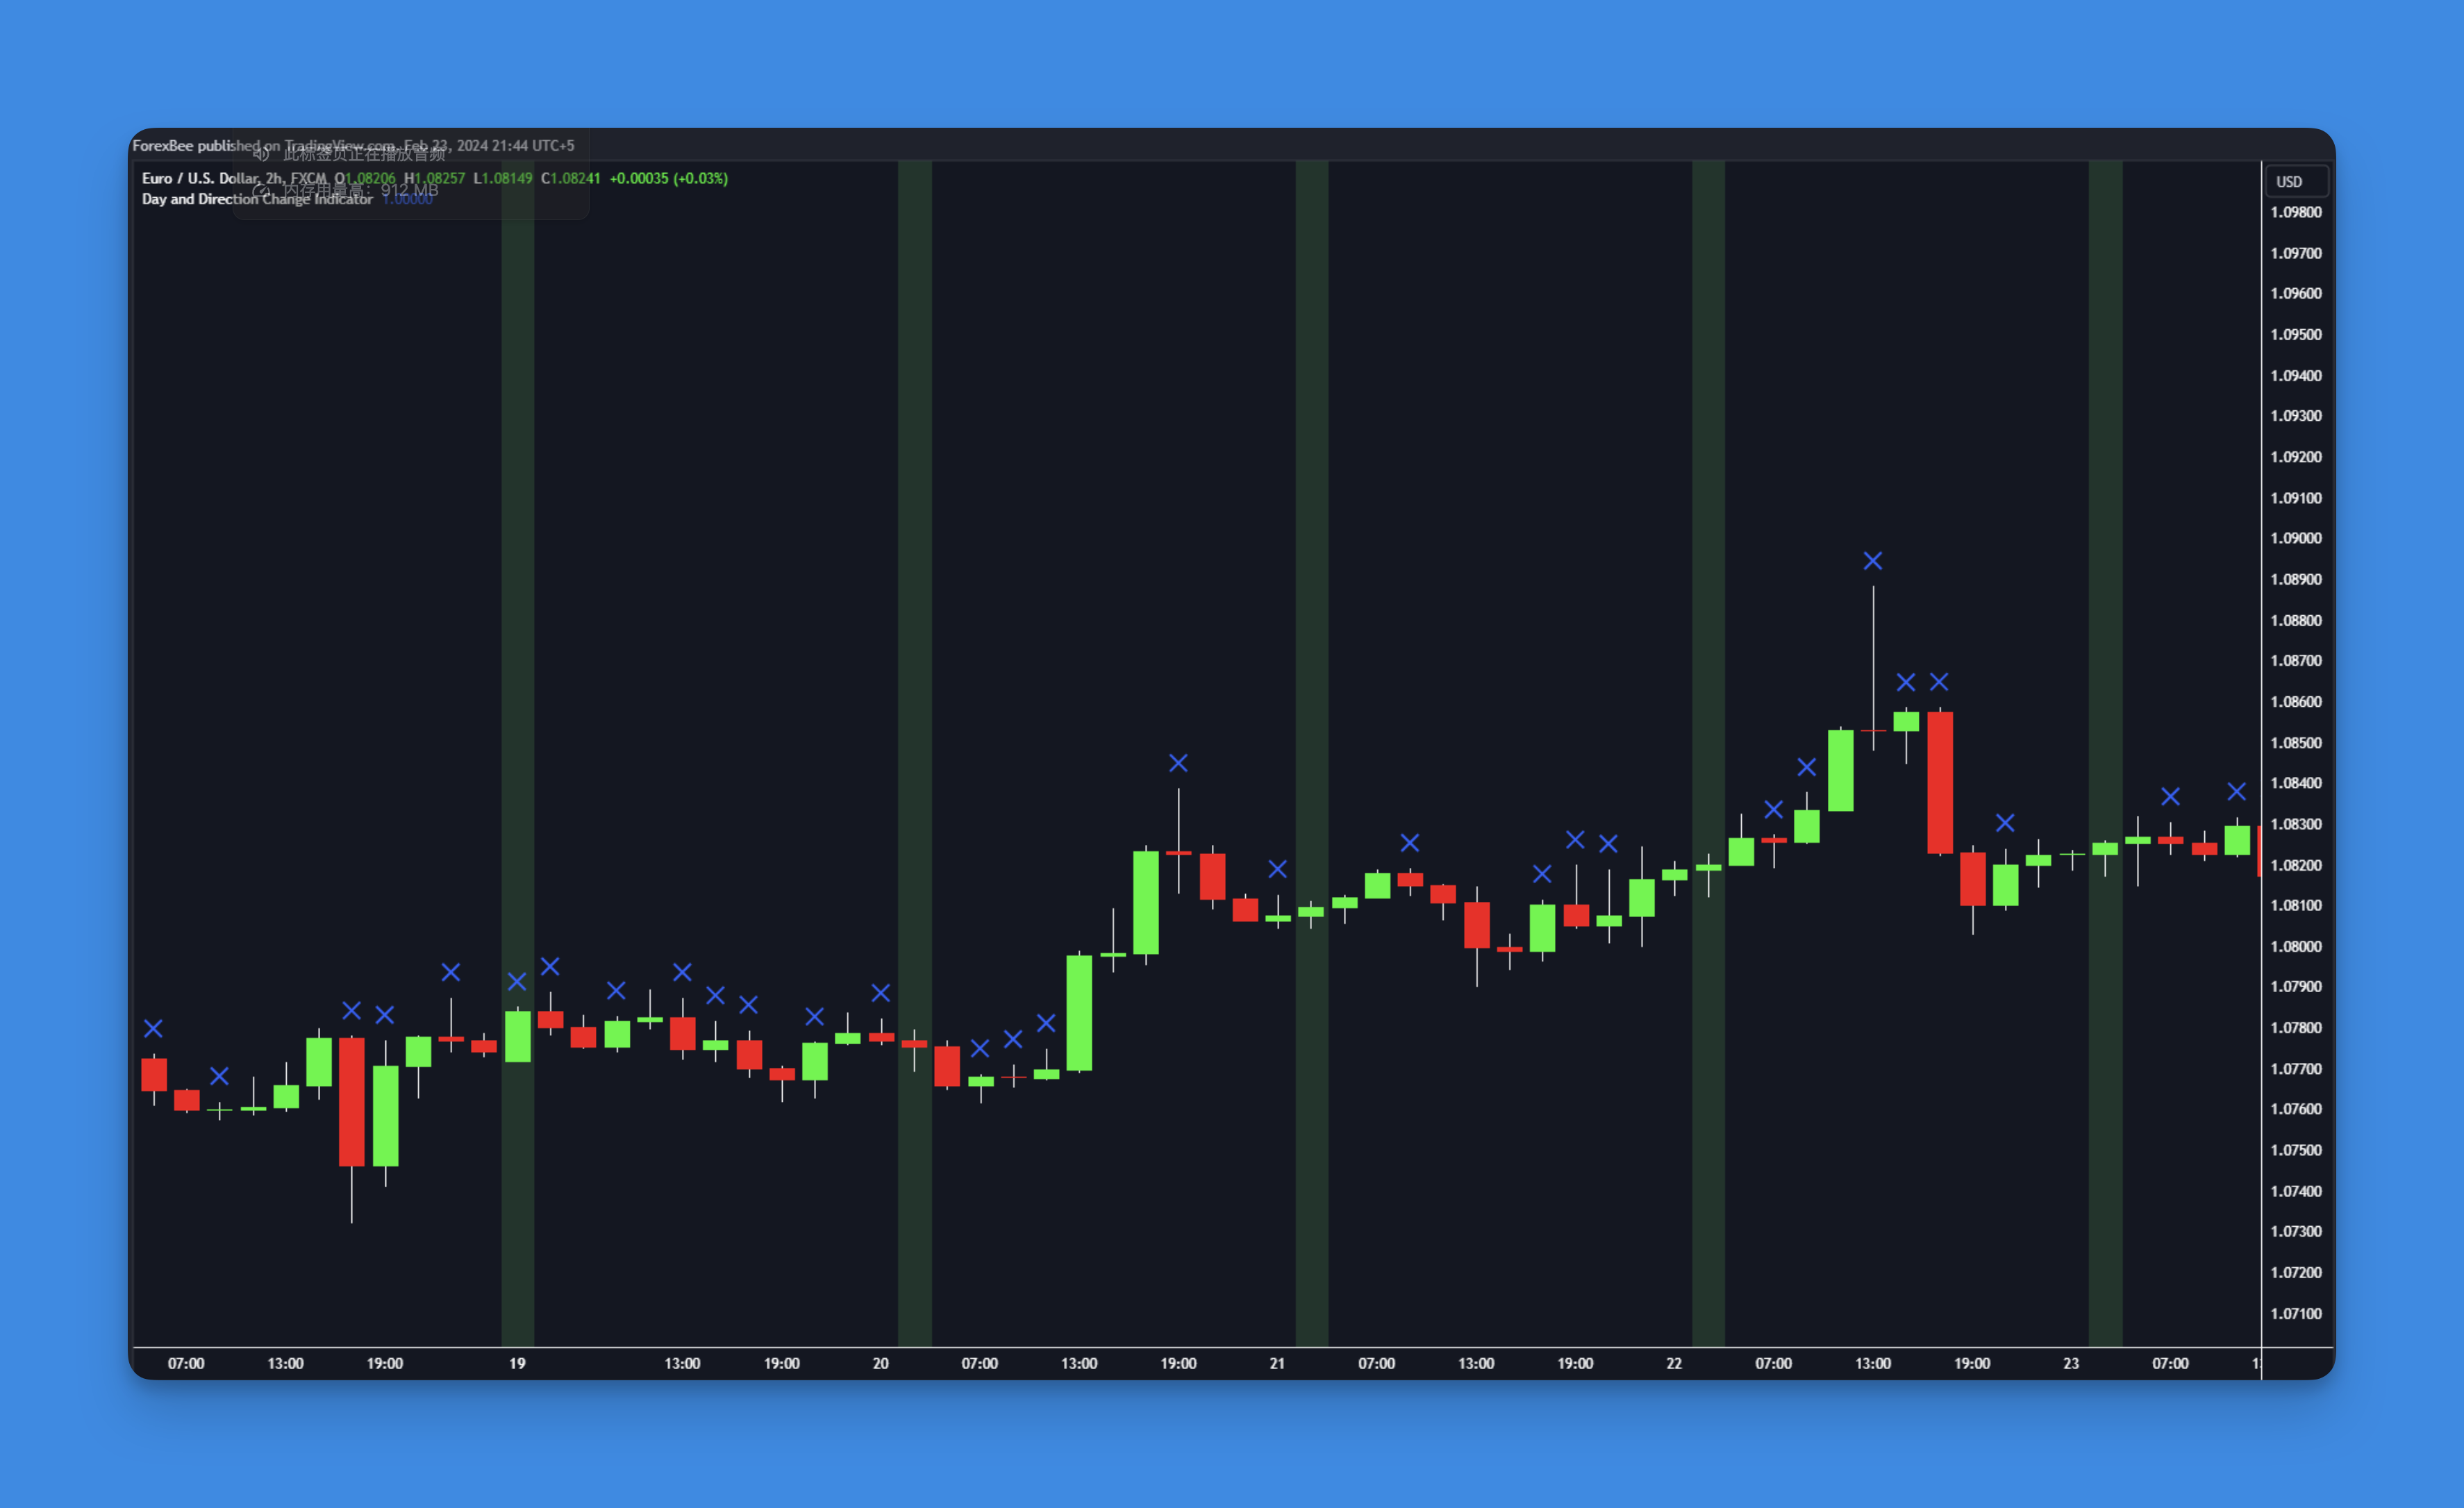
1. Identifying New Trading Days
One common use of ta.change() is to highlight the start of a new trading day. By applying it to a daily time series, you can visually distinguish between days on your chart.
//@version=5
indicator('Day Change Indicator', overlay=true)
dailyBarTime = time('1D')
isNewDay = ta.change(dailyBarTime)
bgcolor(isNewDay ? color.new(color.green, 80) : na)
2. Detecting Trend Reversals
ta.change() can also be used to identify changes in trend direction. For example, you can apply it to a boolean series that indicates whether a bar is green (close > open) or red (close < open).
//@version=5
indicator('Direction Change Indicator', overlay=true)
isGreenBar = close <= open
directionChange = ta.change(isGreenBar)
plotshape(directionChange, 'Direction Change')
Benefits of Using ta.change()
- Flexibility: Supports various data types, making it adaptable to different analysis needs.
- Customization: Allows for comparisons over specified lengths, offering tailored insights.
- Practical Applications: Useful in detecting market trend shifts and identifying new time periods.
How to Use ta.change() Effectively
To maximize the benefits of ta.change(), consider the following tips:
- Combine with Other Indicators: Use
ta.change()alongside other Pine Script functions to create comprehensive trading strategies. - Experiment with Different Lengths: Adjust the
lengthparameter to suit your analysis needs, whether it’s short-term or long-term trends. - Visualize Changes: Use visual elements like colors or shapes to highlight changes on your chart.
Conclusion
Incorporating ta.change() into your Pine Script toolkit can significantly enhance your trading analysis capabilities. Whether you’re a seasoned trader or just starting out, this function offers a powerful way to identify key market movements.