Understanding Pine Script Previous Candle Close: A Comprehensive Guide
In the world of trading and technical analysis, accessing and utilizing previous candle data is crucial for creating effective trading strategies. Pine Script, the programming language used in TradingView, offers powerful capabilities for working with historical price data, including previous candle closes.
What is Pine Script?
Pine Script is a specialized programming language designed for creating custom indicators and trading strategies on the TradingView platform. It allows traders to analyze market data, create alerts, and automate trading decisions based on specific conditions.
Accessing Previous Candle Close in Pine Script

When working with Pine Script, you can reference the previous candle’s close price in several ways:
Using Direct Referencing
The most straightforward method to access the previous candle’s close is by using the built-in referencing system:
previousClose = close[1]
In this code, close[1] refers to the close price of the previous candle. The number in brackets indicates how many bars back you want to look.
Common Mistakes When Working with Previous Candles
A frequent error when working with candle data is incorrect indexing. Remember that your script executes on each bar, so when you’re on the current bar and want to reference the previous bar’s high, you need to use proper indexing.
For example, if you want to check if the previous candle’s high is lower than the current candle’s close:
condition = high[1] < close
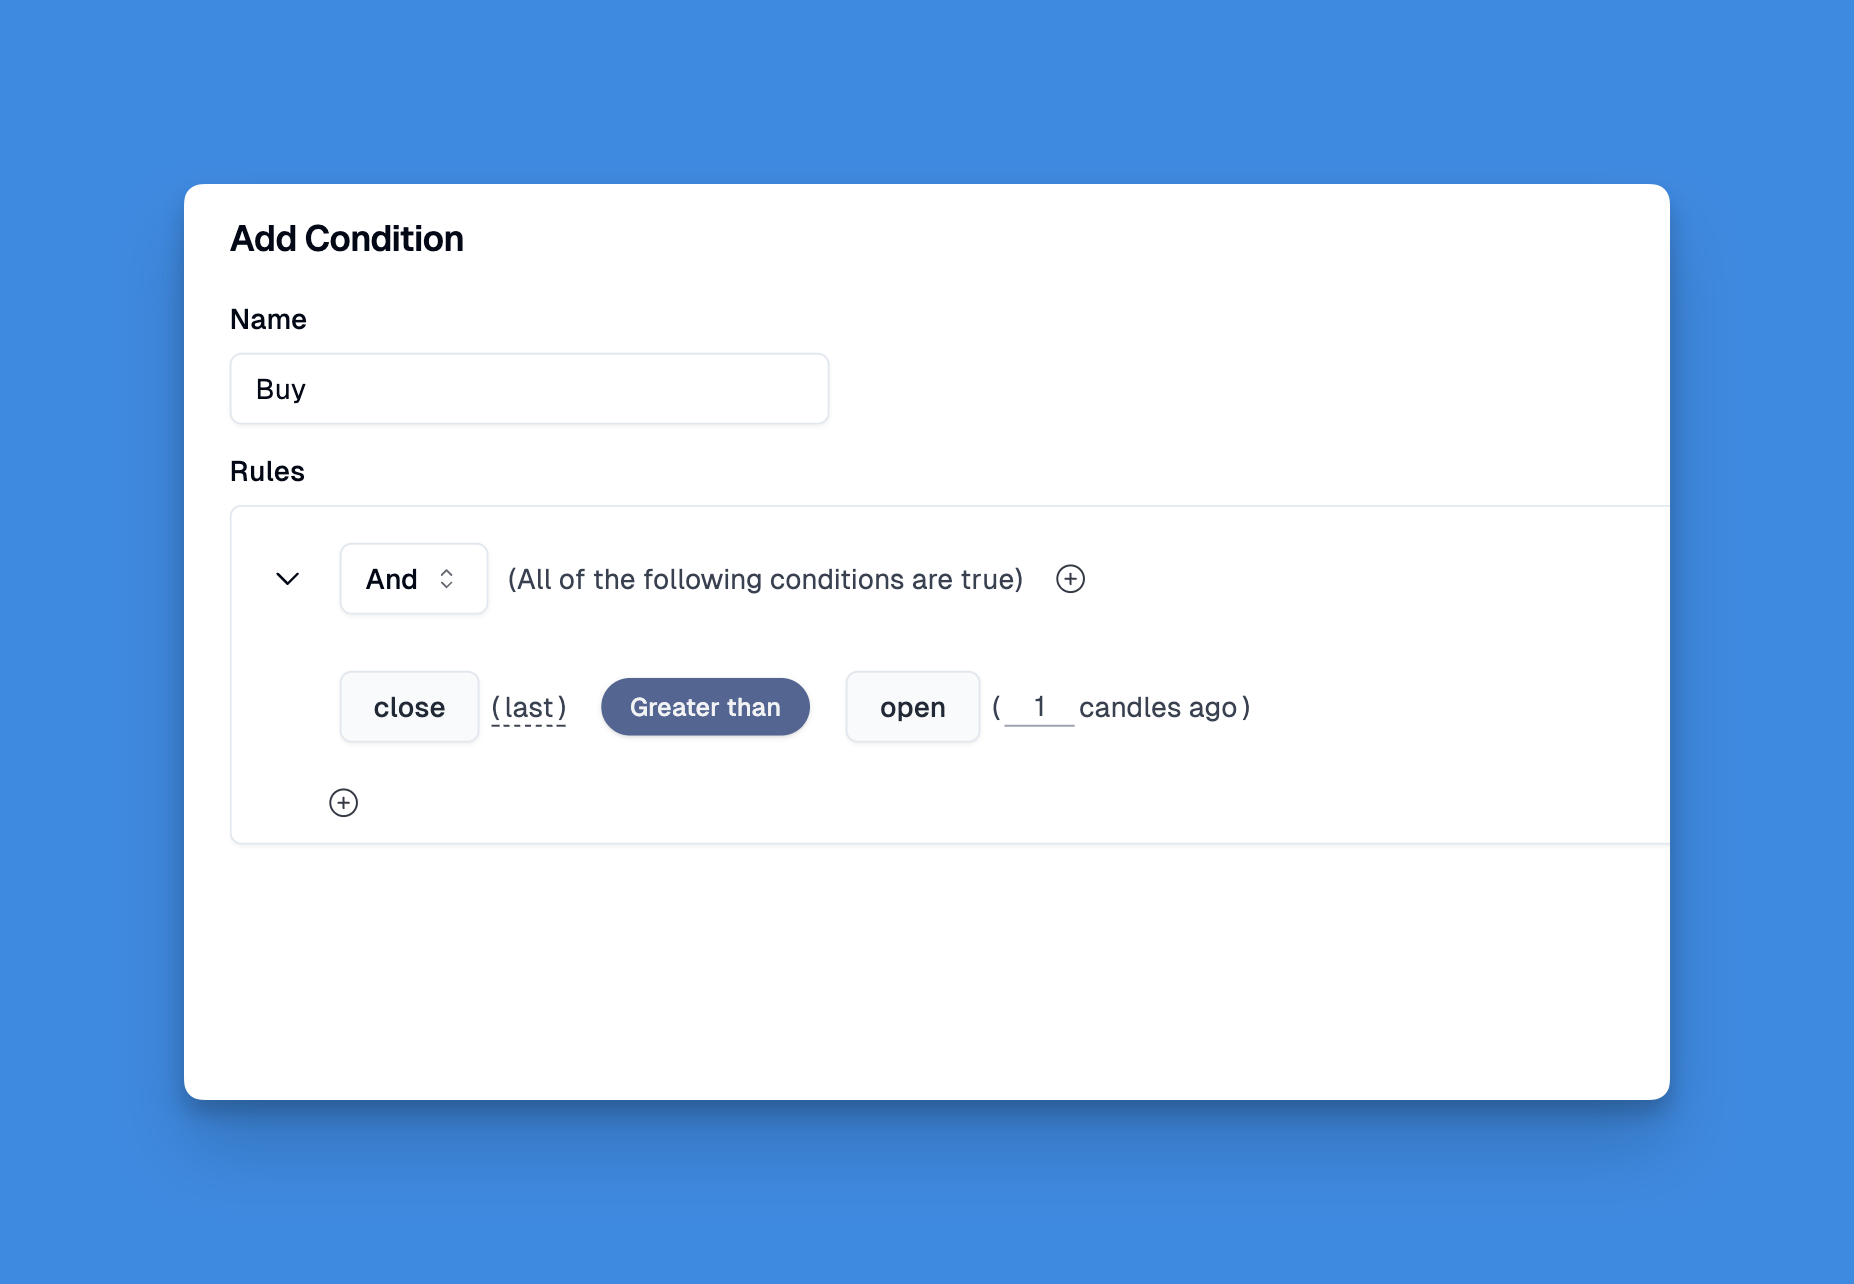
Simplifying Previous Candle Analysis with Visual Condition Builders
When developing trading strategies in Pine Script, referencing the previous candle's closing price is a fundamental technique that creates the foundation for many powerful indicators. Traditionally, this requires understanding Pine Script's syntax for historical data referencing, which can be challenging for traders without coding experience.
Pineify offers an elegant solution through its comprehensive condition editor, allowing traders to incorporate previous candle close values without writing a single line of code.
Website: Pineify
Click here to view all the features of Pineify.Practical Applications
Creating Comparison Conditions
One common application is comparing the previous candle’s close to other price points. For instance, you might want to identify candles with a lower high than the next candle’s close:
lowerHighCondition = high[1] < close
plotshape(lowerHighCondition, title="High < Next Close", style=shape.arrowup, location=location.abovebar, color=color.red, offset=-1)
The offset=-1 parameter is crucial here as it places the marker on the correct candle (the previous one with the lower high).
Plotting Previous Close Lines
You can also visualize the previous candle’s close by plotting a horizontal line:
//@version=4
study("Candle Close", overlay=true)
cus_color = input(#FFFFFF, "Color")
cus_width = input(1, "Width")
var line lastPriceLine = line.new(0, 0, 0, 0)
line.set_xy1(lastPriceLine, bar_index-500, close)
line.set_xy2(lastPriceLine, bar_index, close)
line.set_color(lastPriceLine, cus_color)
line.set_width(lastPriceLine, cus_width)
This code creates a horizontal line at the level of the current candle’s close price.
Comparing with Historical Data
If you want to compare the current close with multiple previous candles, you can use a loop:
lookbackPeriod = 50
for i = 1 to lookbackPeriod
    if close[i] == close
        // Draw a vertical line or marker at matching candles
        line.new(bar_index-i, low[i], bar_index-i, high[i], color=color.yellow, width=2)
This script identifies candles in the past 50 bars that have the same closing price as the current candle.
Conclusion
Understanding how to work with previous candle close data in Pine Script opens up numerous possibilities for creating sophisticated trading strategies and indicators. By properly referencing historical price data, you can develop conditions based on price relationships across multiple candles.