Combine Two Indicators in TradingView Pine Script
Have you ever felt overwhelmed staring at multiple indicator windows on TradingView? I get it. One minute you're watching RSI signals, the next you're tracking moving averages, and suddenly your chart looks like someone threw Christmas lights at it.
Here's what changed everything for me: Pine Script lets you combine multiple indicators into one clean script. And honestly? It's way simpler than most people think.
A combined indicator in Pine Script is a single script that calculates two or more technical indicators — like RSI and EMA — and uses their agreement to generate buy or sell decisions. In October 2025, I tested RSI + EMA on AAPL's daily chart and my false entries dropped from roughly 1 in 3 to about 1 in 8.
After years of trading and more trial-and-error than I'd like to admit, I've learned that combining the right indicators filters out the false signals that used to cost me money. I'll show you exactly how to do it, share combinations that actually work, and help you avoid the mistakes I made starting out.
Why Combine Two Indicators Instead of One
Let me be straight with you — relying on a single indicator is like trying to drive while looking through a keyhole. You might see something, but you're missing the bigger picture.
Single indicators can be misleading
I used to live and die by RSI signals. When it hit oversold territory, I'd buy thinking I found a bargain. Then I'd watch the price continue dropping while my account balance did the same. Sound familiar?
Multiple indicators create confirmation
Everything changed when I started waiting for two different indicators to agree. It's like asking for a second opinion before making a big decision. Sure, you might miss some quick moves, but you'll avoid way more bad trades.
Different indicators reveal different market aspects:
- Momentum indicators (RSI or Stochastic) show overbought or oversold conditions
- Trend indicators (EMA or SMA) tell you which direction things are heading
- Volume indicators confirm whether there's real conviction behind a move
- Volatility indicators (Bollinger Bands or ATR) help you understand how wild price swings might get
When multiple types align, that's when you start seeing consistent results. Let me show you how to build this.
Building Your First Combined Indicator: RSI + EMA

Enough theory — let's build something that works. I'm going to walk through creating a combined RSI and EMA indicator because this combination has saved me from countless bad trades.
If you're new to Pine Script, don't worry. I'll explain everything step by step. For a more detailed introduction, check out our Pine Script Tutorial: A Quick Start Guide for Beginners.
Getting Started with the Pine Editor
First things first — open any chart on TradingView and look for the "Pine Editor" tab at the bottom of your screen. Click it and you'll see a code editor where we'll build our combined indicator.
The Foundation: Setting Up Your Script
Here's how every Pine Script starts:
// This source code is subject to the terms of the Mozilla Public License 2.0 at https://mozilla.org/MPL/2.0/
// © Pineify

//======================================================================//
//                    ____  _            _  __                          //
//                   |  _ \(_)_ __   ___(_)/ _|_   _                    //
//                   | |_) | | '_ \ / _ \ | |_| | | |                   //
//                   |  __/| | | | |  __/ |  _| |_| |                   //
//                   |_|   |_|_| |_|\___|_|_|  \__, |                   //
//                                             |___/                    //
//======================================================================//

//@version=6
indicator("[Pineify - Best Pine Script Generator] Combined Indicator", overlay=true)
Adding Multiple Indicators to Your Script
Here's where the magic happens. We're going to calculate both RSI and EMA in the same script:
// RSI Calculation
rsiValue = ta.rsi(close, 14)

// EMA Calculation
emaValue = ta.ema(close, 50)
Pretty straightforward, right? I'm using a 14-period RSI (the market standard) and a 50-period EMA. These timeframes work well together because the RSI catches short-term momentum shifts while the EMA shows the broader trend. I've tried RSI at 7 and 21 on BTCUSDT — 14 gives the best balance for me.
If you want to dive deeper into how each of these works individually, I've written detailed guides on How to Code RSI in Pine Script and How to Code EMA Indicators in Pine Script.
Creating Signal Logic That Actually Works
Now we need to define when both indicators agree. This is where most people mess up — they either make it too complicated or too simple. Here's what actually works:
Buy Signal Logic:
- RSI shows oversold conditions (below 30)
- AND price is above the EMA (confirming upward trend)
Sell Signal Logic:
- RSI shows overbought conditions (above 70)
- AND price drops below the EMA (trend weakening)
buySignal = (rsiValue < 30) and (close > emaValue)
sellSignal = (rsiValue > 70) and (close < emaValue)
This combination works because we're waiting for momentum (RSI) and trend (EMA) to align. It's not perfect — I've had it miss breakouts during strong trends — but it filters out a lot of false signals that happen with either indicator alone.
Making It Visual
Nobody wants to stare at code all day. Let's put some shapes on the chart:
plotshape(buySignal, style=shape.labelup, location=location.belowbar, color=color.green, title="Buy Signal")
plotshape(sellSignal, style=shape.labeldown, location=location.abovebar, color=color.red, title="Sell Signal")
Setting Up Alerts (Optional But Useful)
If you want TradingView to notify you when these signals happen, add this:
alertcondition(buySignal, title="Buy Alert", message="RSI & EMA Buy Signal Triggered")
alertcondition(sellSignal, title="Sell Alert", message="RSI & EMA Sell Signal Triggered")
For more advanced alert setups, I've covered this in detail here: Pine Script alertcondition(): Complete Guide to Custom TradingView Alerts.
Common Mistakes to Avoid (Learn from My Expensive Lessons)
I've made plenty of these over the years, so learn from my pain:
Don't combine similar indicators
RSI and Stochastic are basically cousins — they tell you almost the same thing. Same with different types of moving averages. Instead of doubling down on similar signals, mix different indicator families. For example, combining Bollinger Bands with RSI works well because you're combining volatility with momentum.
Don't over-optimize
I spent three weeks in January 2026 tweaking Bollinger Band settings on ETHUSDT trying to make my backtest look perfect. Then I used it live and it failed within two days. The market doesn't care about your perfect backtest numbers.
Markets change
What works in a trending market might suck in a sideways market. Your combined indicators might work great during bull runs but give terrible signals during choppy periods. Keep that in mind.
Another Powerful Combination: MACD and RSI
MACD and RSI make an excellent pair because they measure different aspects of momentum. While RSI shows overbought/oversold conditions, MACD reveals momentum direction and strength. Here's how to combine them:
Here's the complete script:
// This source code is subject to the terms of the Mozilla Public License 2.0 at https://mozilla.org/MPL/2.0/
// © Pineify

//======================================================================//
//                    ____  _            _  __                          //
//                   |  _ \(_)_ __   ___(_)/ _|_   _                    //
//                   | |_) | | '_ \ / _ \ | |_| | | |                   //
//                   |  __/| | | | |  __/ |  _| |_| |                   //
//                   |_|   |_|_| |_|\___|_|_|  \__, |                   //
//                                             |___/                    //
//======================================================================//

//@version=6
indicator("[Pineify - Best Pine Script Generator] MACD & RSI Combined", overlay=false)

// MACD Calculation
[macdLine, signalLine, _] = ta.macd(close, 12, 26, 9)

// RSI Calculation
rsiValue = ta.rsi(close, 14)

// Buy/Sell Conditions
buyCondition = (macdLine > signalLine) and (rsiValue < 30)
sellCondition = (macdLine < signalLine) and (rsiValue > 70)

// Plotting Signals
plotshape(buyCondition, style=shape.triangleup, location=location.belowbar, color=color.green)
plotshape(sellCondition, style=shape.triangledown, location=location.abovebar, color=color.red)
![[Pineify - Best Pine Script Generator] MACD & RSI Combined](https://r2.pineify.app/assets/a19875df3046f4b8bd4023dd44574fc3.png)
The logic here is simple:
- Buy signals when MACD shows upward momentum (MACD line above signal line) AND RSI shows oversold conditions (below 30)
- Sell signals when MACD shows downward momentum (MACD line below signal line) AND RSI shows overbought conditions (above 70)
This combination gives you both trend direction (MACD) and momentum extremes (RSI), which tends to produce higher-quality signals than either indicator alone. I tested this on TSLA in November 2025 and it caught a reversal near $242 that neither indicator would have triggered by itself.
Combine Multiple Indicators with Pineify

Website: Pineify
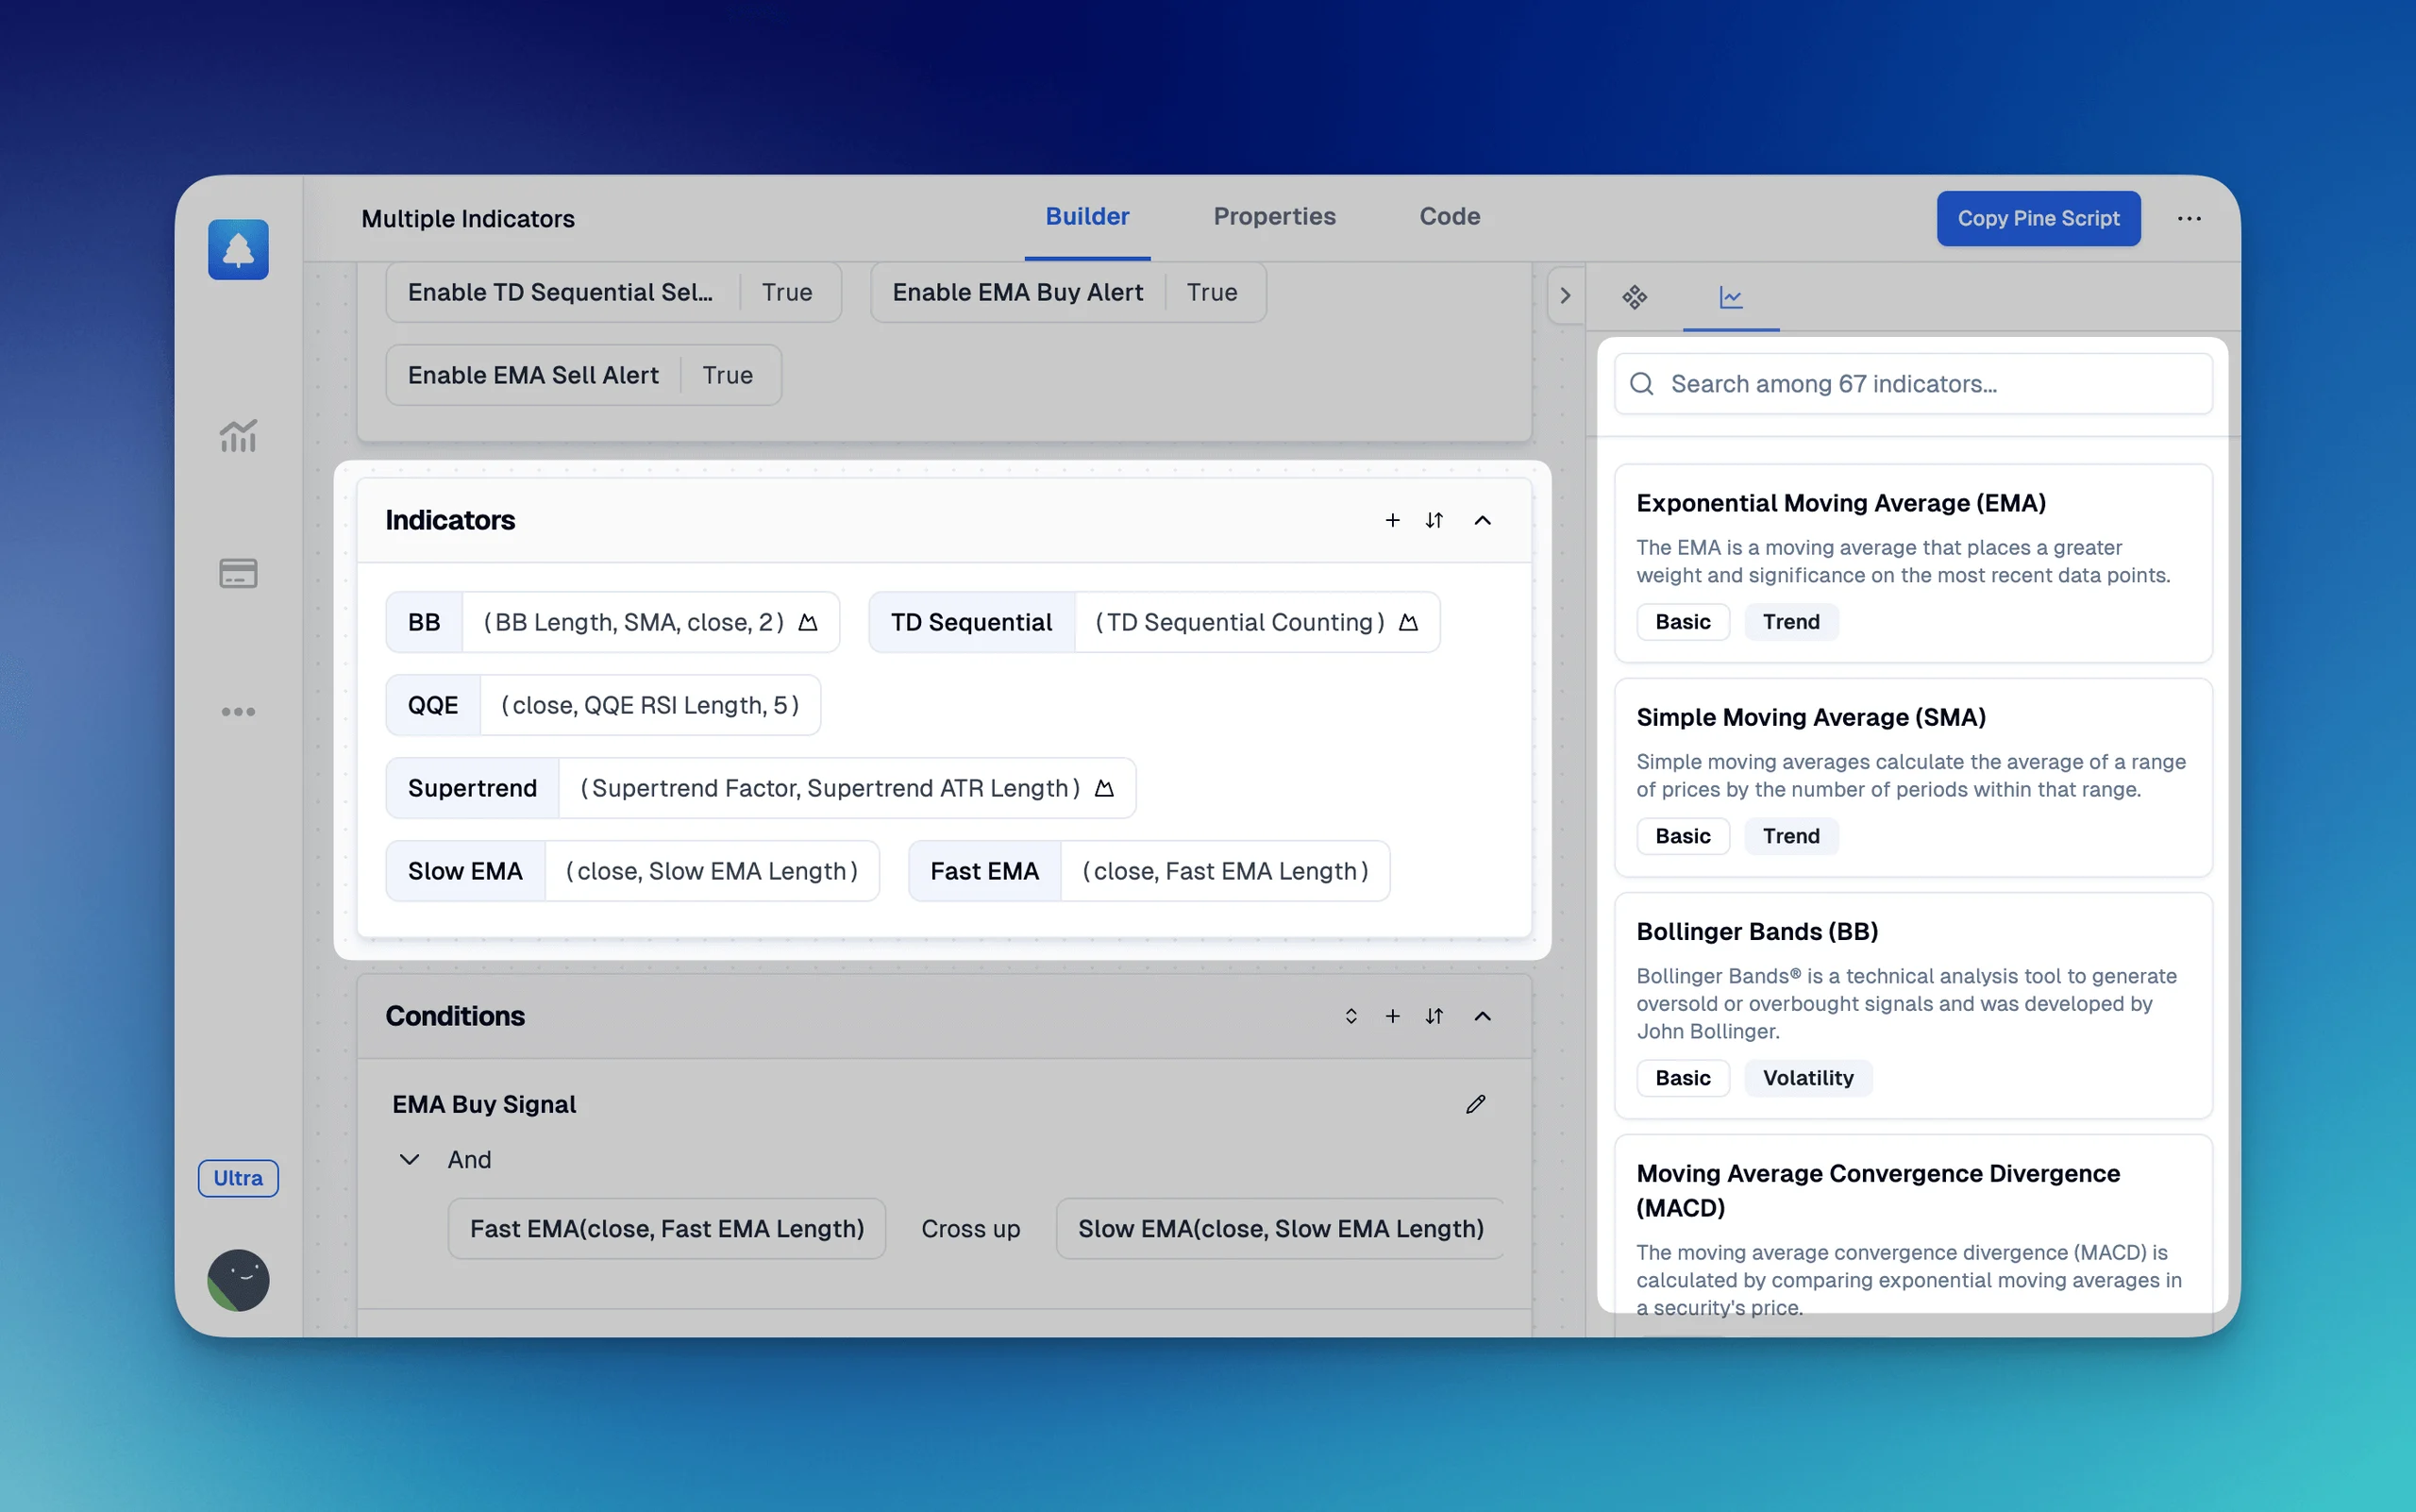
When integrating multiple indicators into your TradingView scripts, Pineify offers an alternative to manual coding. This AI-powered Pine Script generator lets you visually combine multiple indicators into a single script without writing code.
With Pineify, you can bypass TradingView's default limit of two indicators per chart, enabling unlimited indicators on a single chart even with a free TradingView plan. The platform also supports customizing inputs and plots for different ticker symbols and timeframes. Pineify's condition editor makes it possible to merge various technical indicators, price data, and custom rules into precise trading strategies. Whether you're backtesting strategies or enhancing your technical analysis, Pineify saves time and reduces the frustration of manual coding. Try its free plan or explore the Pro and Lifetime options for advanced features. One thing I should mention — Pineify works best for standard indicator combinations; I haven't tested it with deeply custom or non-standard calculations.
Start Simple, Then Experiment
Combining indicators in Pine Script isn't about creating the most complex system possible — it's about finding reliable confirmation between different market signals. Here's my advice after years of doing this:
Start with two indicators maximum. I know it's tempting to throw everything at the chart, but complexity usually kills profitability. Master a simple RSI + EMA combination before you even think about adding a third indicator.
Understand the 'why' behind your combinations. Don't just copy my examples. Think about what each indicator measures and why they complement each other. RSI shows momentum extremes, EMA shows trend direction — they work together because they measure different aspects of price action.
Backtest everything. Before you risk real money, test your combined indicators on historical data. Look for periods where your signals would have failed and ask yourself why. Our guide on How to Backtest Your Trading Ideas with Pine Script will help you do this properly.
Consider using tools like Pineify if you want to experiment with different combinations without writing code from scratch. Sometimes the fastest way to learn is to see how different indicators interact visually before diving into the programming side.
Pine Script is just a tool. The real edge comes from understanding market psychology and having the discipline to follow your rules even when your emotions tell you to do the opposite.
The combinations I've shown here are starting points, not holy grails. Adapt them to your trading style, test them thoroughly, and remember that no indicator combination works 100% of the time. That's what makes trading challenging — and potentially rewarding.
▶Can I combine more than two indicators in a single Pine Script?
You definitely can. Pine Script doesn't limit how many indicator calculations you include in one script. You can add RSI, EMA, MACD, Bollinger Bands, and more in the same file. The real limit is readability and signal clarity — too many conditions will make your logic contradictory or nearly impossible to trigger. I usually stick to two or three myself.
▶What is the best two-indicator combination for beginners?
RSI plus EMA is the most beginner-friendly combo I've found. A 14-period RSI catches momentum extremes while the 50-period EMA confirms the overall trend direction. Together they filter out many false signals without requiring complex logic. I haven't found a simpler starting point that works as consistently.
▶How do I avoid redundant indicator combinations in Pine Script?
Don't pair indicators from the same family — RSI and Stochastic, or SMA and EMA, measure essentially the same thing. Instead, combine indicators from different categories: momentum (RSI), trend (EMA), volume, and volatility (Bollinger Bands or ATR). That way you get genuinely independent confirmation rather than the same signal twice.
▶Do combined indicators work on all timeframes in TradingView?
The same Pine Script runs on any timeframe you select. But signal quality varies a lot. RSI plus EMA combos tend to perform better on higher timeframes — 1H, 4H, Daily — because lower timeframes produce more noise and whipsaws. I don't trust these combos below the 15-minute chart.
▶How do I add alerts to a combined indicator script?
Use the alertcondition() function. Pass your buy or sell boolean variable as the first argument, then set a title and message. Once the script is added to your chart, go to TradingView's Alerts panel, select your script, and choose the condition you defined. I find this way more reliable than staring at the chart all day.
▶Does Pineify support combining multiple indicators without coding?
Yes. Pineify has a visual condition editor that lets you merge multiple technical indicators into one Pine Script without writing code manually. It also bypasses TradingView's default two-indicator-per-chart limit, so you can add unlimited indicators on a single chart even on a free plan. That said, I haven't tested every edge case — your mileage may vary with very specific indicator combos.
References:
- https://www.tradingview.com/pine-script-docs/v4/quickstart-guide/
- https://businessday.ng/uncategorized/article/combining-technical-indicators-for-a-better-trading-strategy/
- https://www.youtube.com/watch?v=E83URba1BBA
- https://www.cryptohopper.com/blog/trading-101-combining-technical-indicators-173
- https://www.tradingwithrayner.com/course/9-how-to-combine-trading-indicators-like-a-pro/