Understanding the ta.linreg() Function in Pine Script v6
Linear regression is a powerful tool in technical analysis, allowing traders to identify trends and predict future price movements. In Pine Script, the ta.linreg() function is used to compute a linear regression line that best fits a series of data over a specified period. This guide will delve into the syntax, application, and practical uses of the ta.linreg() function, helping you enhance your trading strategies.
Understanding the ta.linreg() Syntax
The ta.linreg() function uses the least squares method to calculate the linear regression line. Its syntax is straightforward:
ta.linreg(source, length, offset) → series float
- source: The series of data to apply the linear regression to, typically closing prices.
- length: The number of bars over which the calculation is performed.
- offset: An integer that shifts the regression line forward or backward in time.
How ta.linreg() Works

The linear regression line is calculated using the formula:
linreg = intercept + slope × (length − 1 − offset)
Where intercept and slope are determined by the least squares method applied to the source series. This method minimizes the sum of the squared differences between observed responses and predicted responses, providing a line that best fits the data.
Utilizing Pineify for Enhanced Trading Strategies with ta.linreg()
When exploring advanced trading strategies in Pine Script v6, tools like Pineify can significantly enhance your workflow. Pineify is designed to simplify the creation and management of trading indicators and strategies, allowing users to bypass the need for extensive coding knowledge. This platform is particularly useful when working with functions like ta.linreg(), which is used for linear regression analysis in trading.

Pineify offers several features that can complement the use of ta.linreg() in your trading strategies. For instance, it allows you to add unlimited technical indicators to your TradingView charts, bypassing the typical limitations. This means you can combine ta.linreg() with other indicators to create complex and personalized trading strategies.
Website: Pineify
Click here to view all the features of Pineify.Practical Applications of ta.linreg()
1. Trend Identification
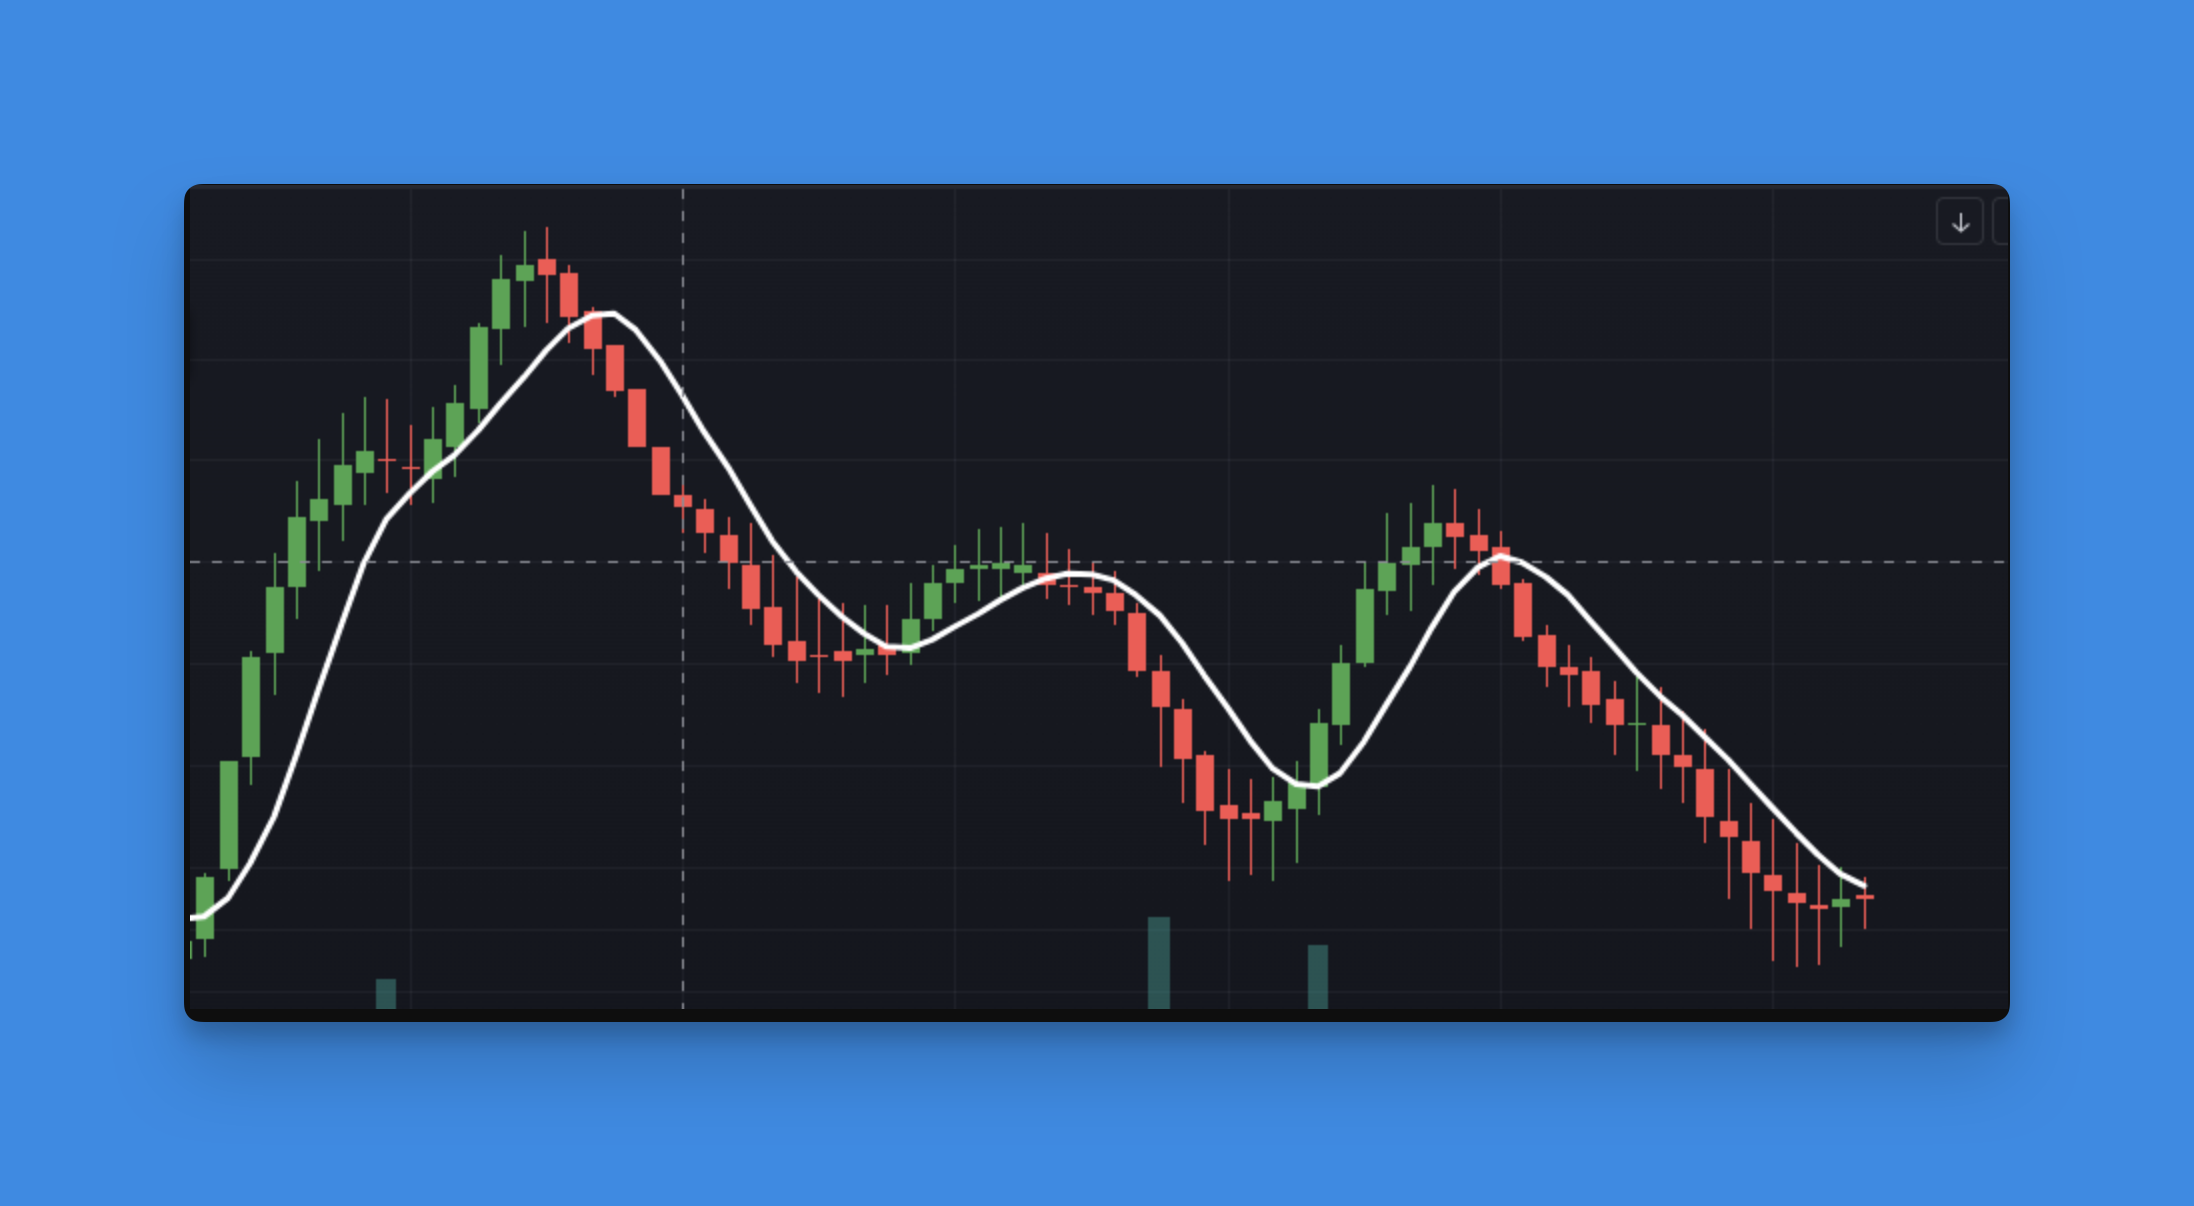
By plotting the linear regression line on a chart, you can visually identify trends in price movements. A rising line indicates an upward trend, while a falling line suggests a downward trend.
2. Predictive Analysis
The linear regression line can be used to predict future price movements based on past trends. By extending the line beyond the current data, you can estimate where prices might move in the future.
3. Strategy Development
Traders can use the ta.linreg() function to develop trading strategies. For example, buying when the price crosses above the regression line and selling when it crosses below can be a simple yet effective strategy.
Example Code for a 20-Period Linear Regression Curve
To apply the ta.linreg() function in a real-world scenario, consider the following Pine Script example:
//@version=6
indicator("My Linear Regression Line", overlay=true)
source = close
length = 20
offset = 0
regressionLine = ta.linreg(source, length, offset)
plot(regressionLine, color=color.red)
This script plots a 20-period linear regression line based on closing prices, providing a clear visual representation of the trend.
Tips for Effective Use
- Adjust the Length: Experiment with different lengths to find the best fit for your trading strategy.
- Use Offset Wisely: Adjust the offset to shift the line forward or backward, depending on your analysis needs.
- Combine with Other Indicators: Use ta.linreg() alongside other technical indicators for more robust analysis.
Conclusion
Mastering the ta.linreg() function in Pine Script can significantly enhance your trading strategies by providing clear insights into trends and potential price movements. Whether you’re a seasoned trader or just starting out, incorporating linear regression analysis into your toolkit can help you make more informed decisions.
Take the Next Step:
- Experiment with Different Lengths and Offsets: Try adjusting these parameters to see how they impact your analysis.
- Combine with Other Indicators: Use ta.linreg() alongside moving averages or RSI to create a comprehensive trading strategy.
- Share Your Insights: Join our community to discuss how you’re using ta.linreg() and share tips with fellow traders.
By applying these strategies and staying engaged with the trading community, you’ll be well on your way to leveraging the full potential of linear regression in your trading journey.