Best Debugger: How to Debug Pine Script Code
Debugging is an essential skill for any developer, especially when working with Pine Script on TradingView. This guide will explore various techniques, tools, and best practices for debugging Pine Script effectively. Whether you're a beginner or an experienced coder, understanding how to debug your scripts will enhance your coding experience and improve your trading strategies.
Understanding Pine Script Debugging
Debugging involves identifying and resolving errors in your code. In Pine Script, this process is crucial for ensuring that your trading indicators and strategies function as intended. Effective debugging can help you:
- Optimize performance
- Improve code quality
- Validate results
Common Debugging Techniques
Here are some of the most effective techniques for debugging Pine Script:
1. Using Built-in Debugging Tools

TradingView provides several built-in tools to assist with debugging:
- Debugger: Step through your code line by line, examining variable values and expressions.
- Error Messages: When an error occurs, Pine Script generates detailed messages that indicate the line number and type of error, helping you quickly identify issues.
- Console Output: Print variables and messages to the console to monitor your script's behavior.
2. Plotting Variables
Using the plot() function allows you to visualize variable values directly on the chart. This technique is particularly useful for numeric data. For example:
plot(close, title="Closing Price", color=color.blue)
This line plots the closing price of the asset, making it easier to see how it changes over time.
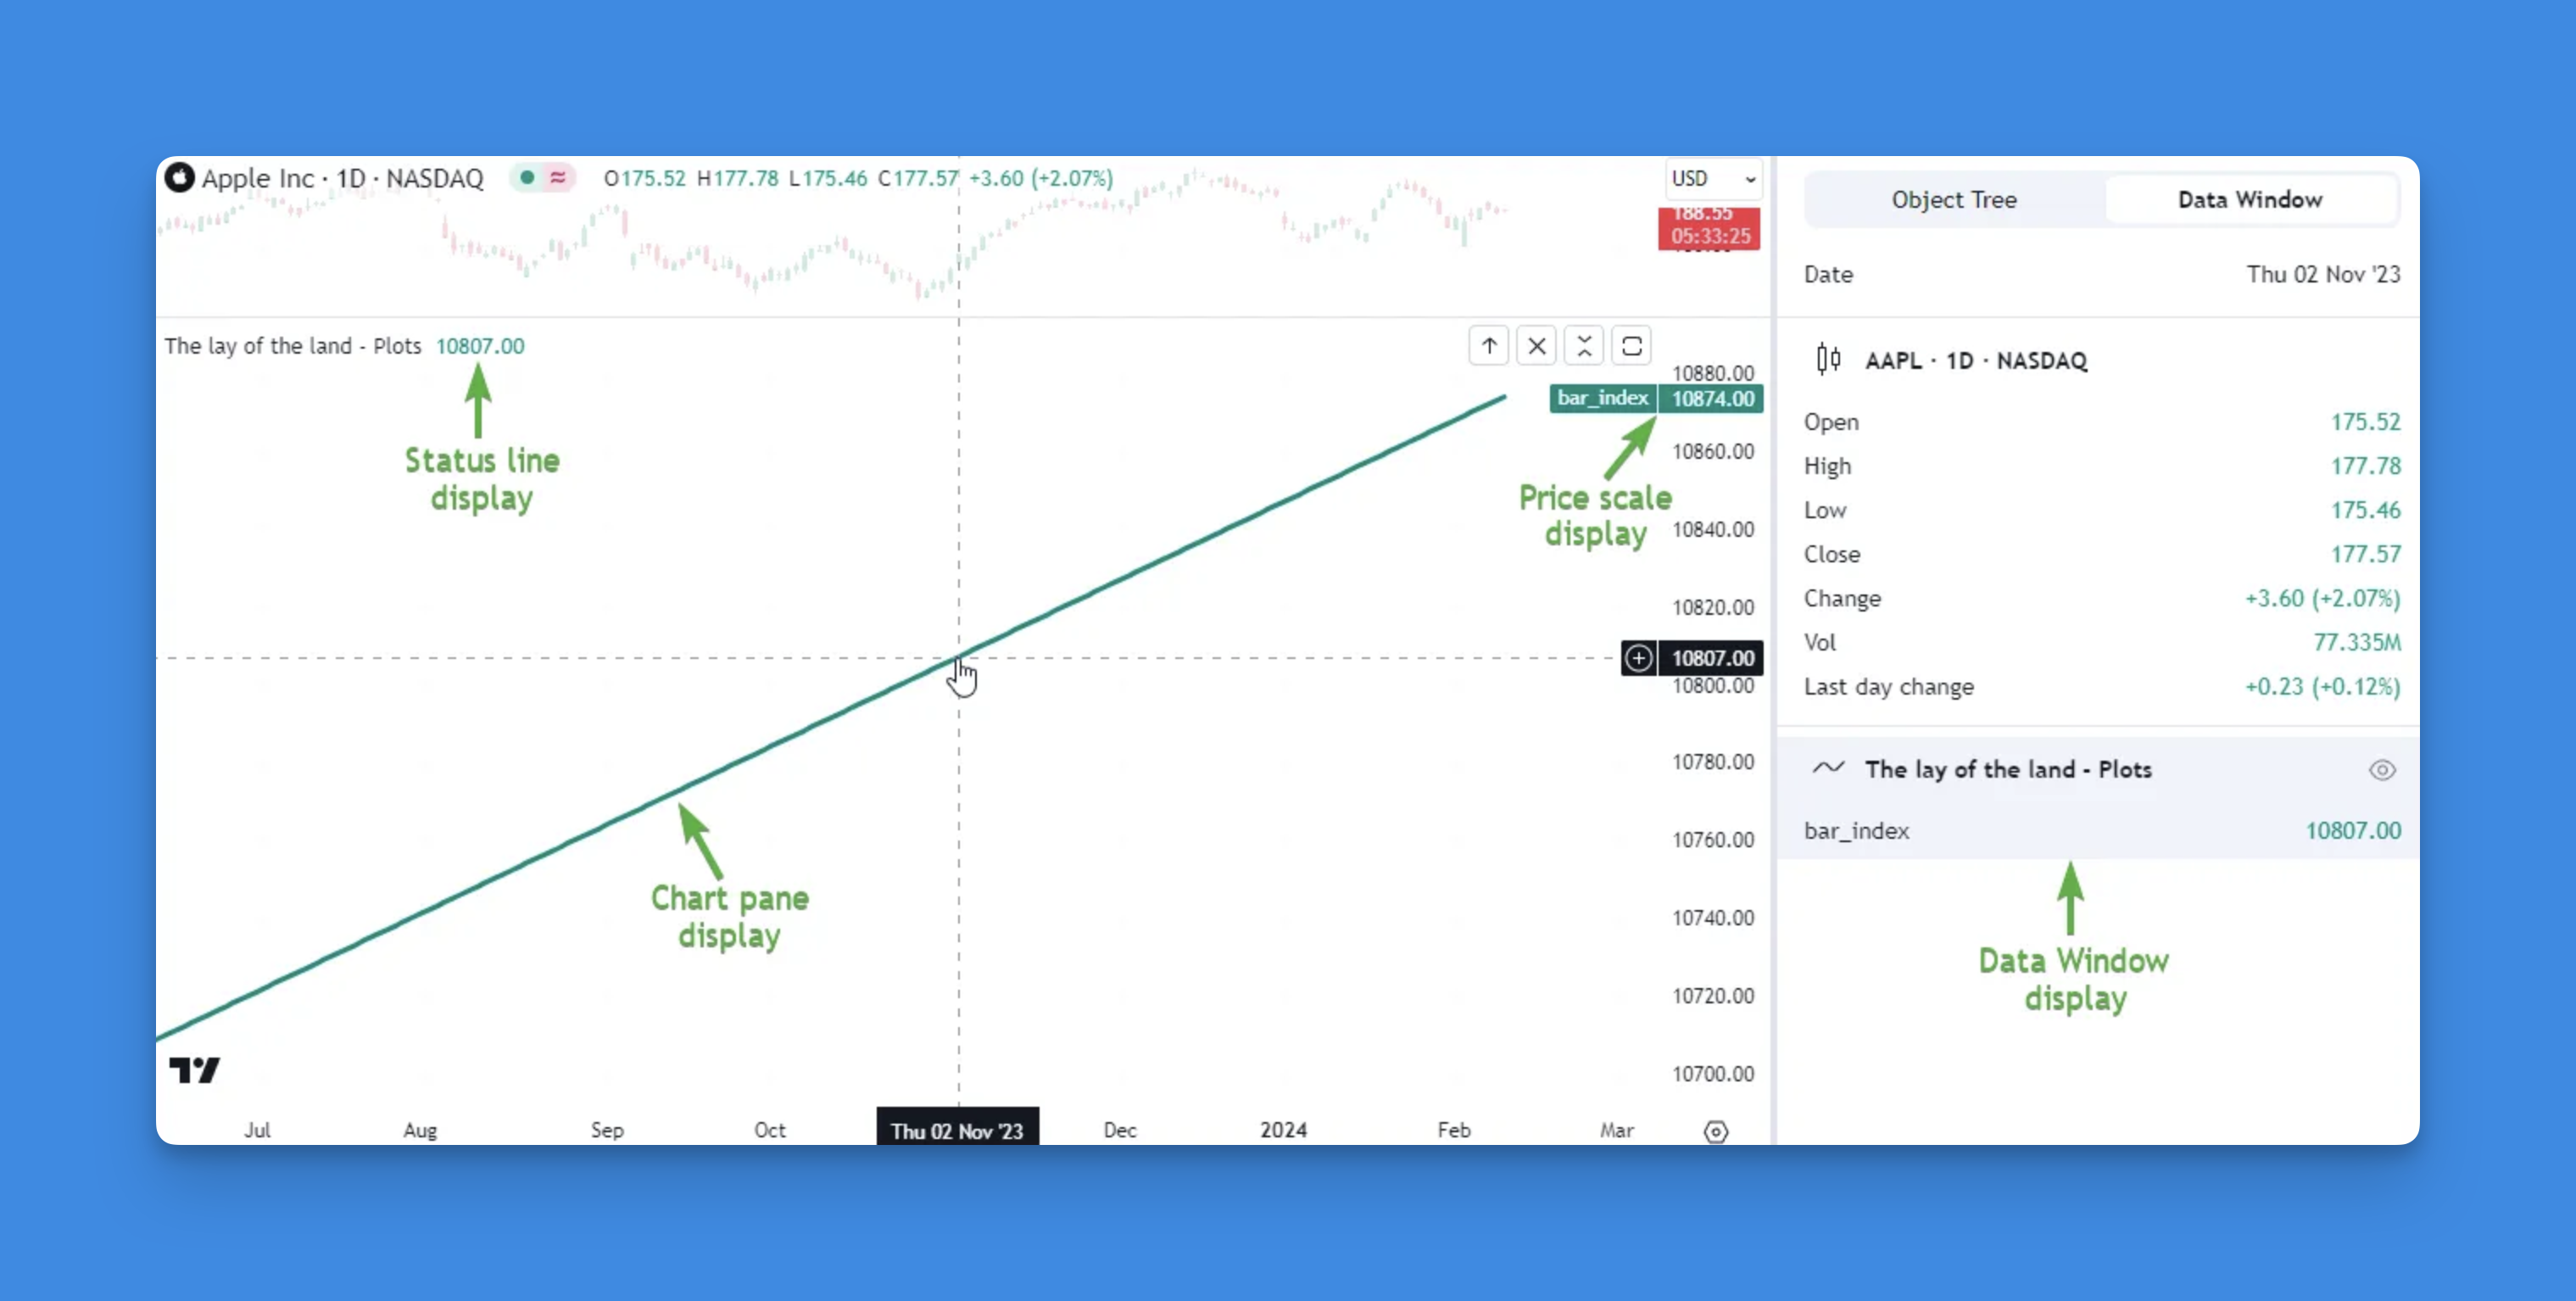
3. Utilizing Labels for Debugging
The label.new() function can be used to create labels on the chart that display variable values or messages. This is especially helpful for tracking specific conditions or events in your script.
if barstate.islast
    label.new(bar_index, high, "Debug Info: " + str.tostring(variable), color=color.black)
4. Implementing Logging Functions
With recent updates, Pine Script now supports logging functions such as log.info(), log.warning(), and log.error(). These functions allow you to log messages at different severity levels, providing insights into your script's execution.
if (barstate.islast)
    log.info("Current close price: " + str.tostring(close))
You can access these logs in the Pine Editor sidebar under "Pine Logs," making it easy to review output from previous executions.
Leveraging Pineify for Error-Free Code
Pine Script debugging can be challenging for those new to programming. Pineify simplifies this process by providing an accessible interface for creating and managing trading indicators and strategies without complex coding.

Website: Pineify
Click here to view all the features of Pineify.The platform's Powerful Condition Editor lets users visually combine technical indicators and price data to build trading rules. This approach helps identify potential errors early through clear visualization of conditions and outputs.
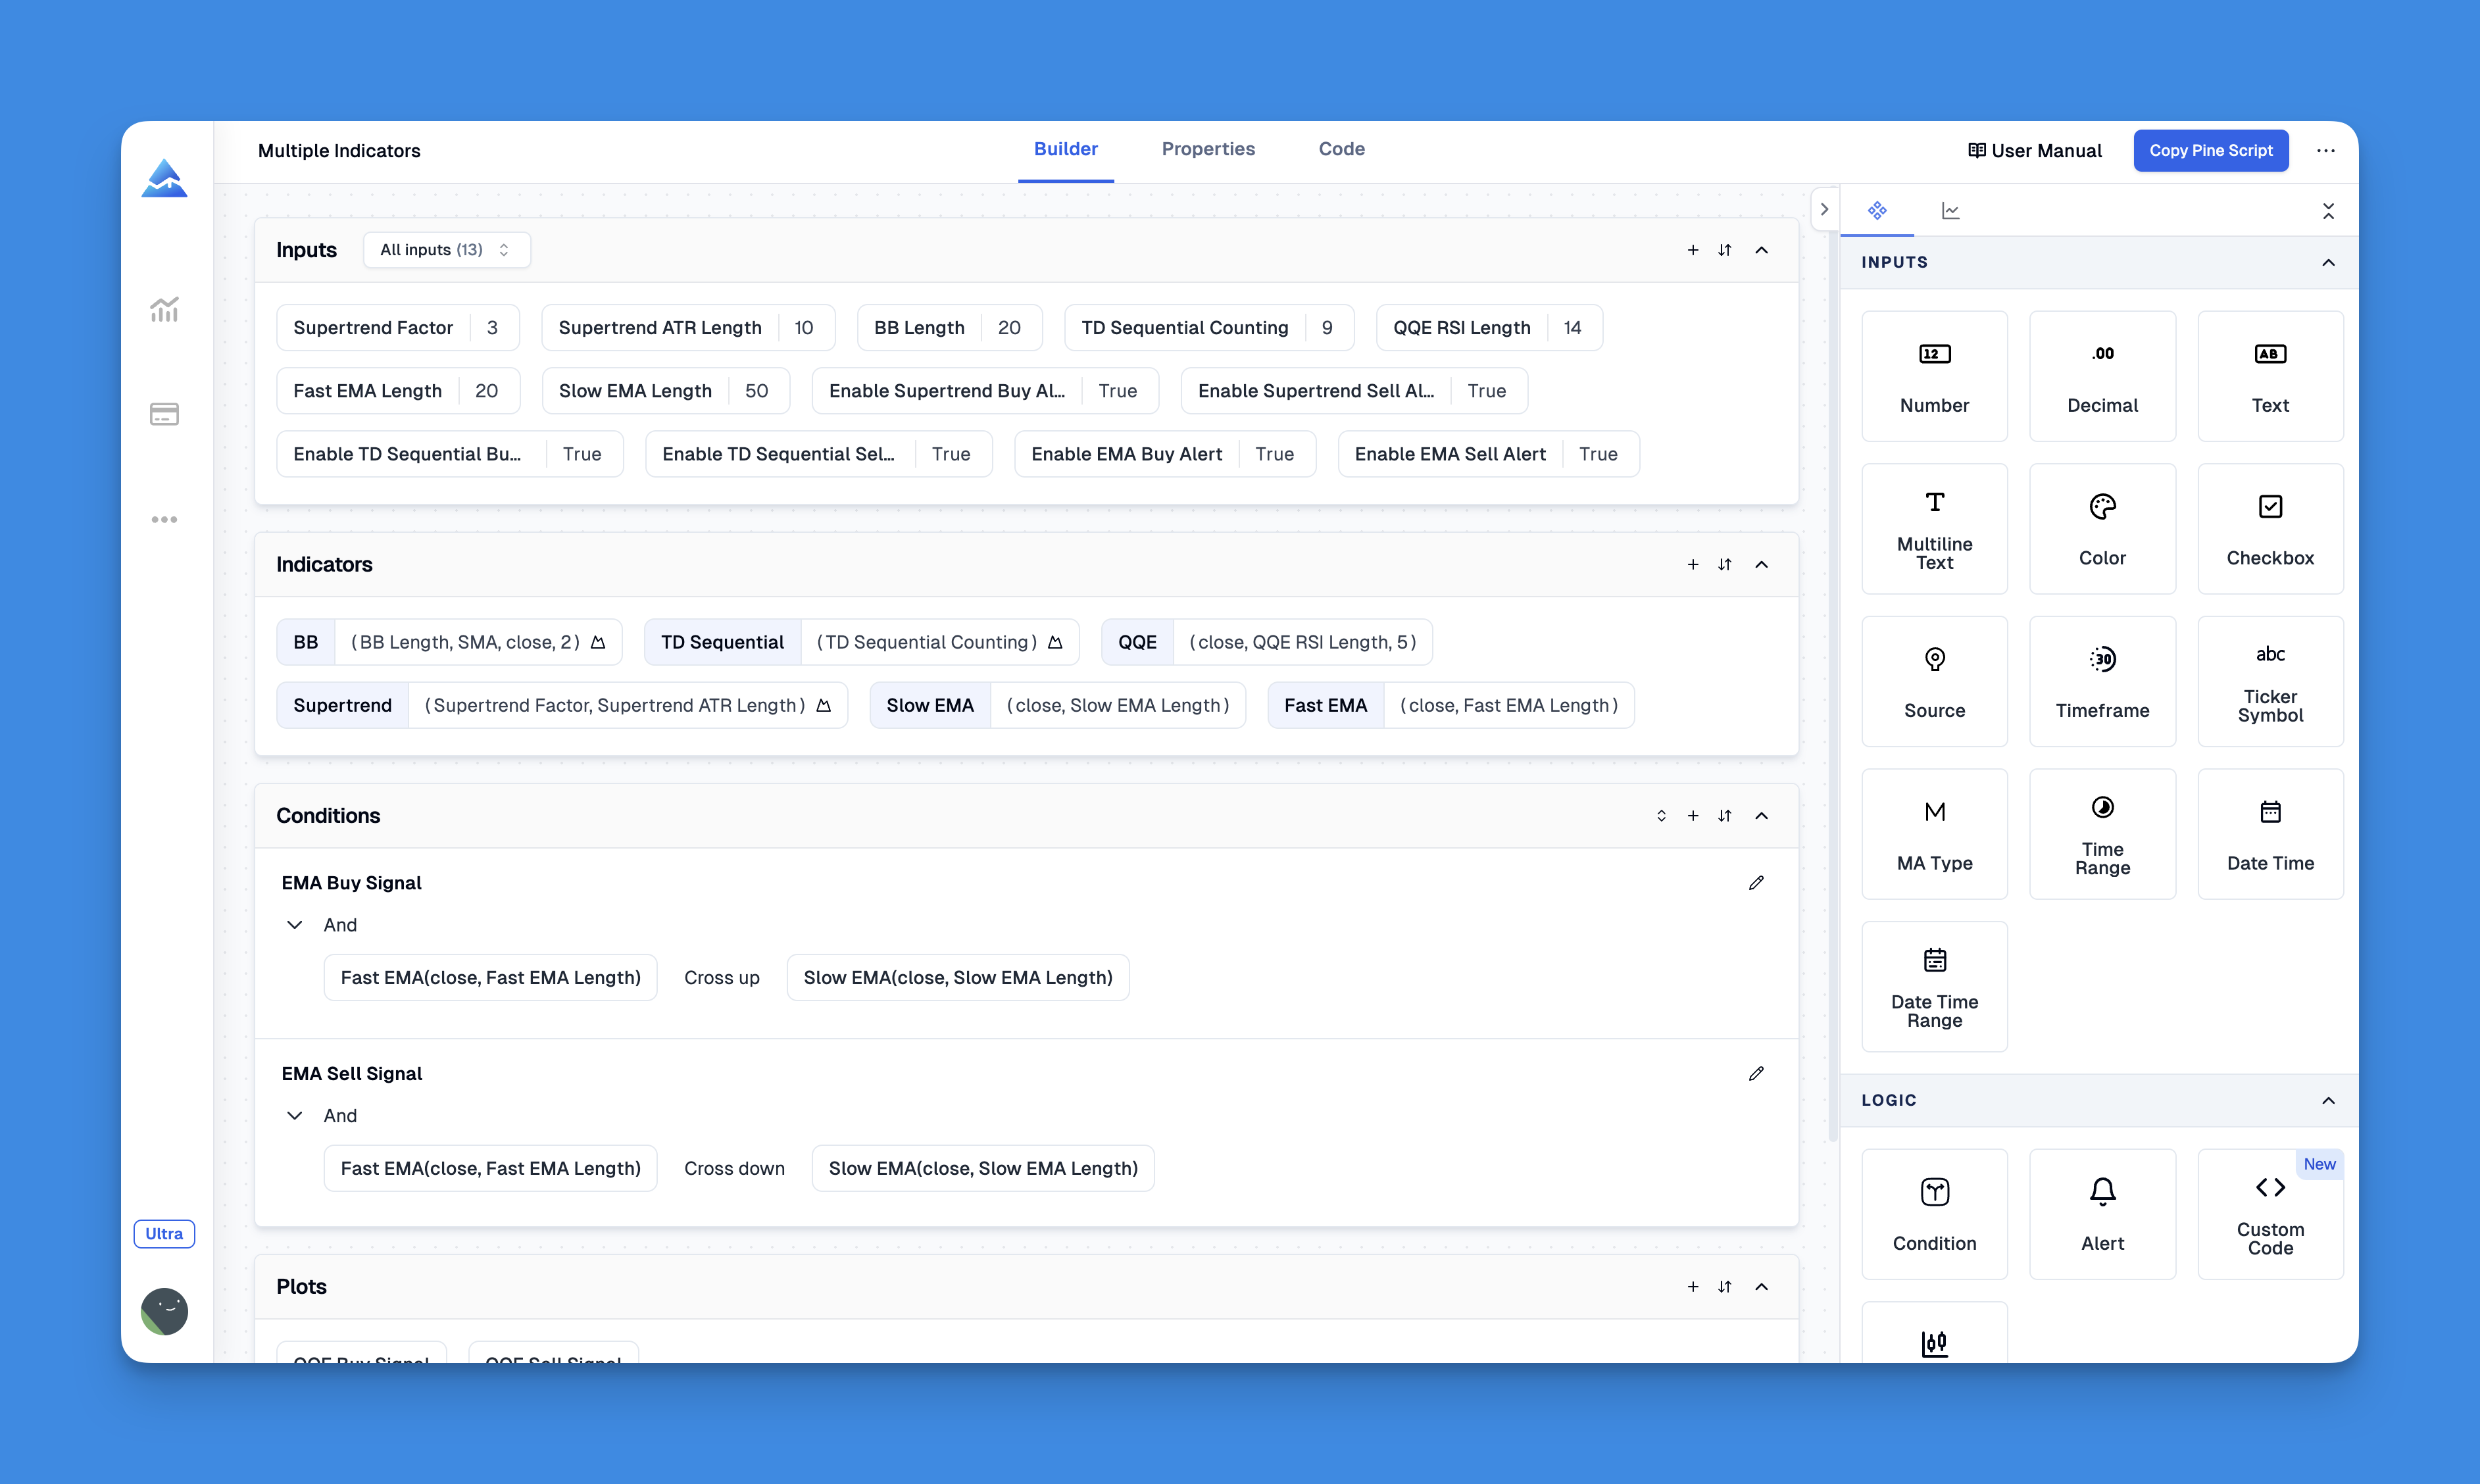
Additionally, Pineify allows users to import and modify existing Pine Script code, enabling quick backtesting and debugging. Its focus on error prevention helps ensure reliable script performance.
Best Practices for Effective Debugging
To maximize your debugging efficiency, consider these best practices:
- Keep It Simple: Start with a basic script and gradually add complexity. This approach helps isolate issues more effectively.
- Use Meaningful Variable Names: Descriptive names improve readability and make it easier to understand what each variable represents.
- Comment Your Code: Adding comments can clarify complex logic and assist in identifying potential issues later.
- Test in Isolation: Evaluate individual components or functions separately to pinpoint problems without additional complexity.
Common Errors and Solutions
Here are some typical errors encountered in Pine Script along with their solutions:
| Error Type | Symptom | Solution |
|---|---|---|
| Syntax Error | Error message indicating a syntax issue | Check for typos and mismatched brackets |
| Variable Scope | Unexpected variable value | Verify variable declaration and scope |
| Logic Error | Incorrect calculation or unexpected result | Review logic and assumptions; test components individually |
Advanced Debugging Techniques
For more complex debugging scenarios, consider these advanced techniques:
- Print Statement Debugging: Strategically place print statements throughout your code to monitor variable values during execution.
- Create a Test Suite: Develop tests that validate your script's behavior under various conditions.
Conclusion
Debugging Pine Script is a critical skill that can significantly impact your trading strategy's success. By utilizing the tools and techniques outlined in this guide, you can effectively identify and resolve issues in your scripts. Remember to keep practicing these methods as you develop more complex trading strategies.
In summary, utilizing Pineify not only enhances the debugging process but also empowers traders to develop robust trading strategies with confidence, ultimately leading to a more effective trading experience.