Ichimoku Cloud Indicator Pine Script Guide
The Ichimoku Indicator, known as Ichimoku Kinko Hyo, is a comprehensive technical analysis tool that provides traders with insights into market trends, support and resistance levels, and potential entry and exit points. This guide will explore the fundamentals of the Ichimoku Indicator, how to use it effectively, its advantages, its role in trading strategies, its limitations, and a conclusion to wrap up the discussion.
What is the Ichimoku?
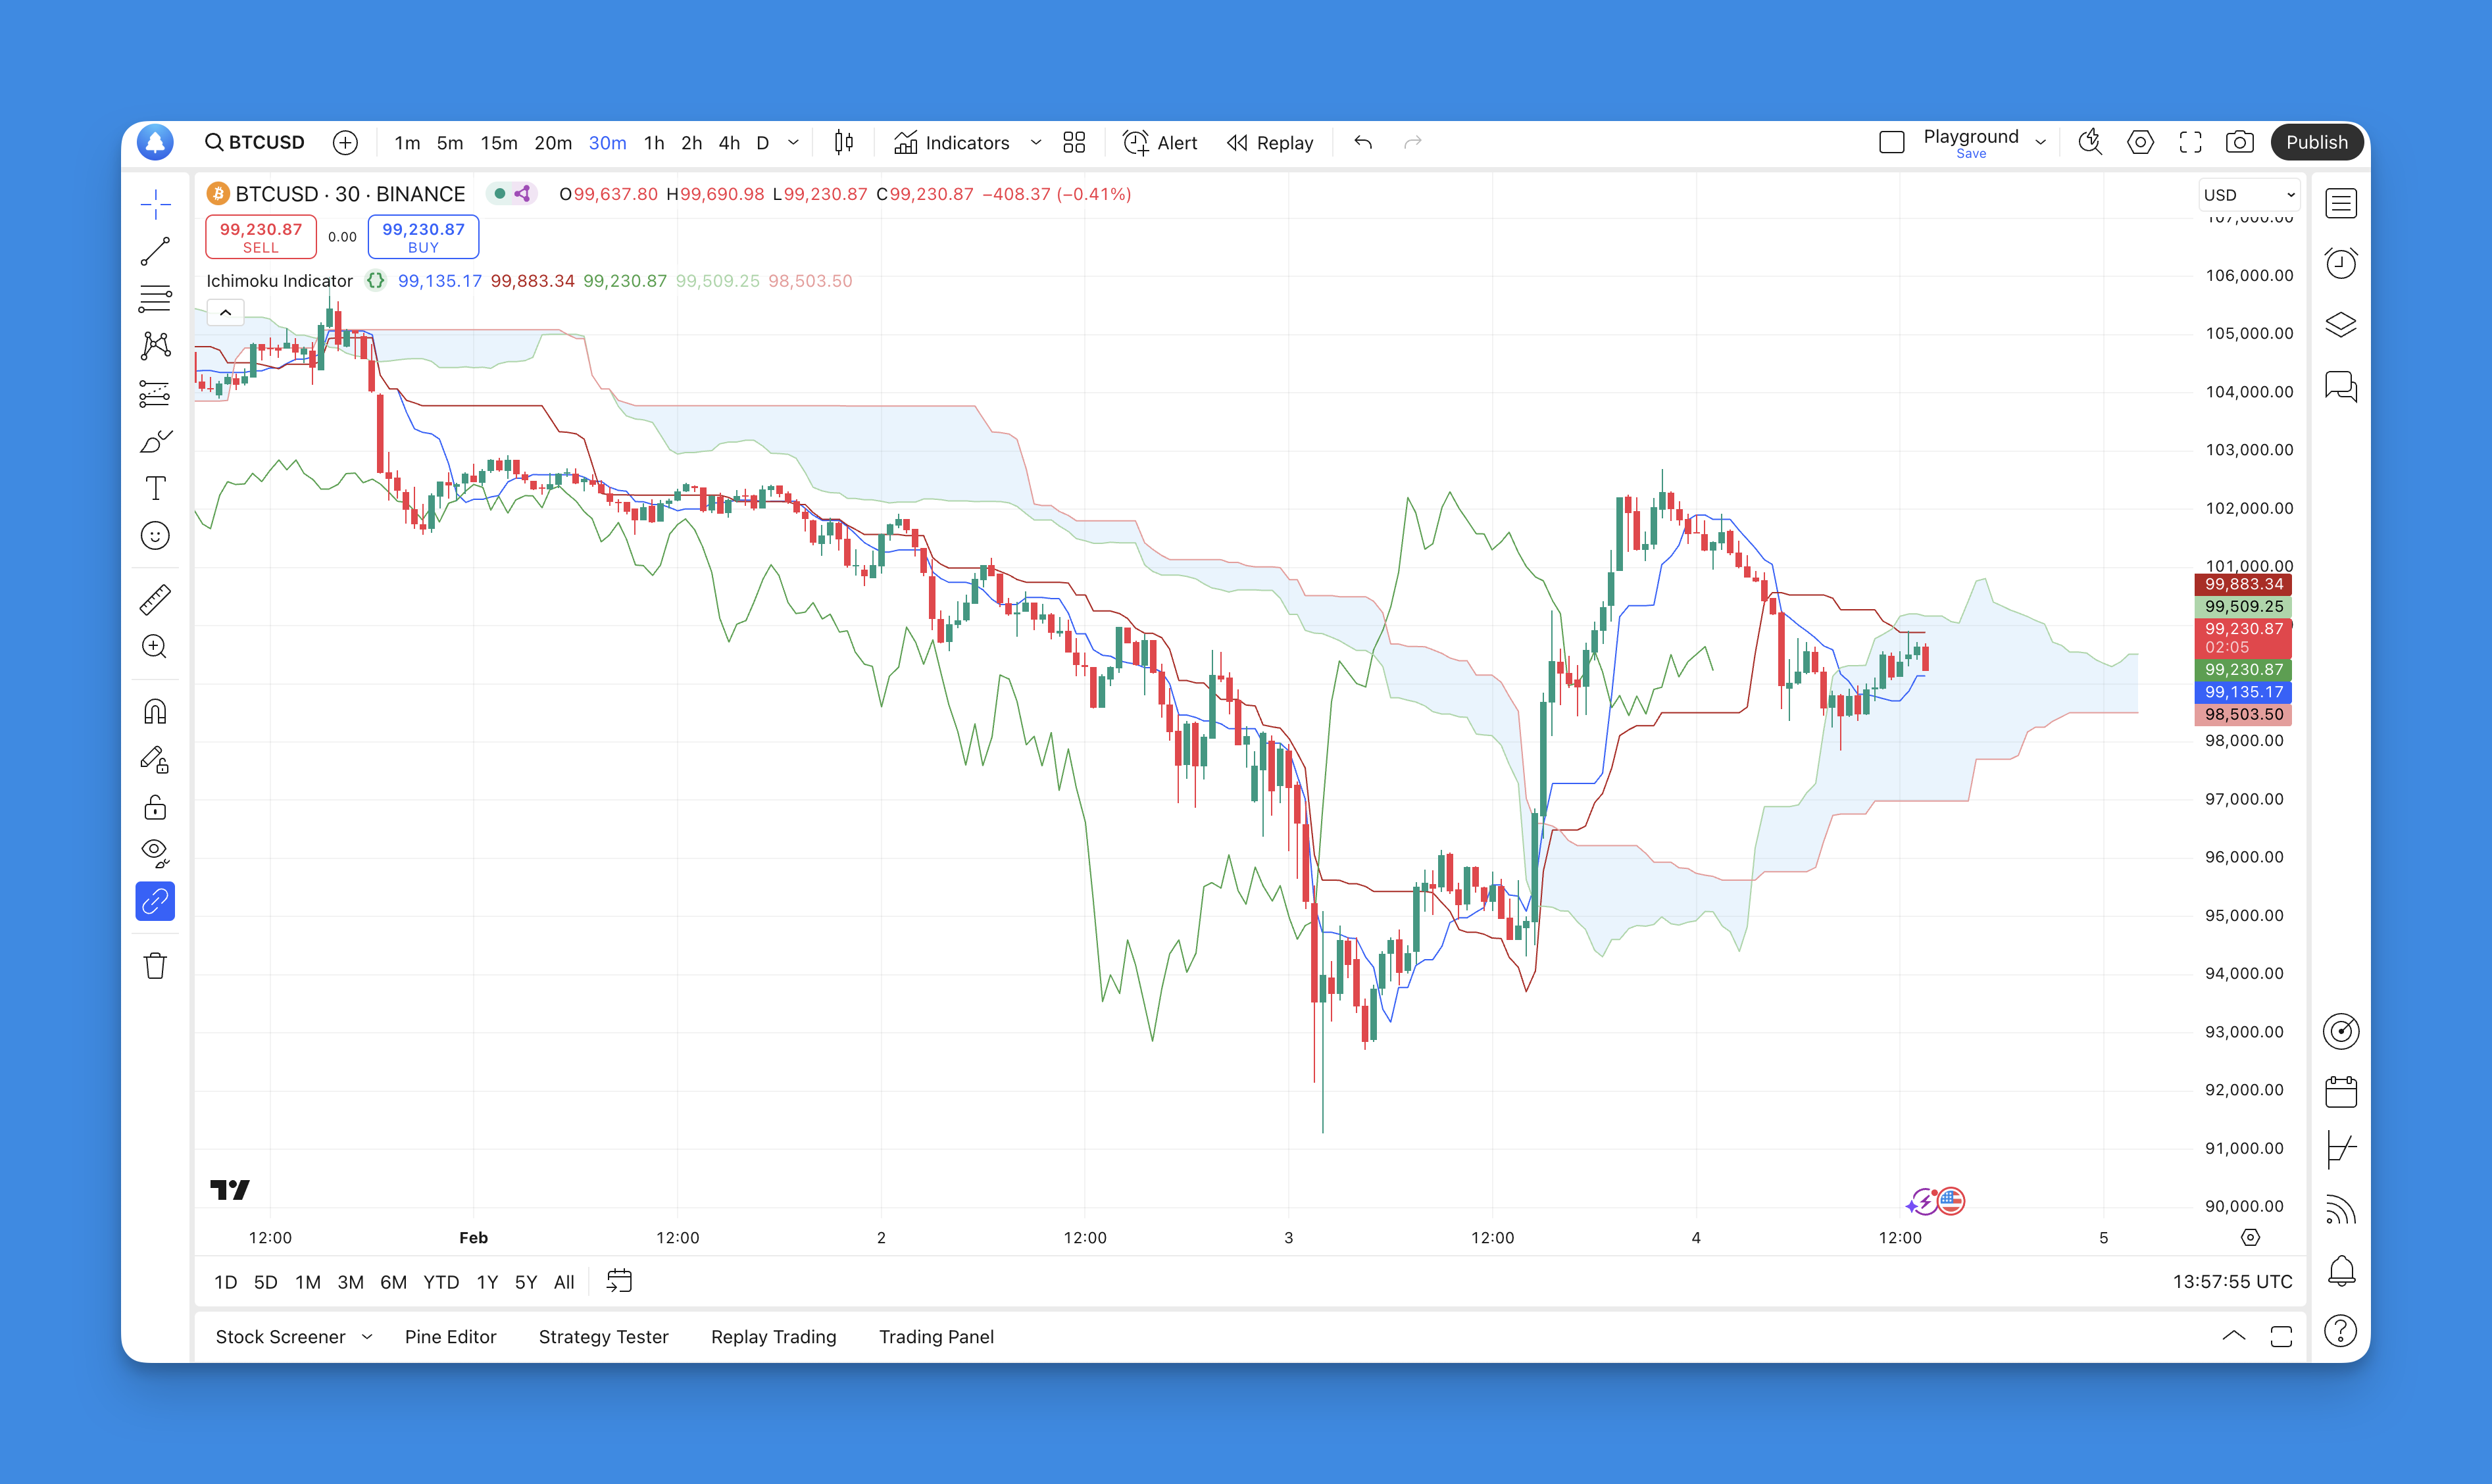
The Ichimoku Indicator is a Japanese technical analysis tool developed by Goichi Hosoda in the late 1960s. Its name translates to "one glance equilibrium chart," reflecting its ability to provide a holistic view of market conditions at a single glance. The indicator comprises five distinct lines that collectively form a "cloud" on the price chart, which helps traders identify trends and potential price movements.
The five components of the Ichimoku Indicator are:
- Tenkan-sen (Conversion Line): This line represents short-term price movement and is calculated using the highest high and lowest low over the last nine periods.
- Kijun-sen (Base Line): This line indicates medium-term trends and is derived from the highest high and lowest low over the last 26 periods.
- Senkou Span A (Leading Span A): This line is calculated as the average of the Tenkan-sen and Kijun-sen, plotted 26 periods ahead in time.
- Senkou Span B (Leading Span B): This line is determined by averaging the highest high and lowest low over the past 52 periods, also plotted 26 periods ahead.
- Chikou Span (Lagging Span): This line represents the current closing price but is plotted 26 periods back on the chart.
The interplay of these lines creates a visual representation of market dynamics, allowing traders to quickly assess whether prices are trending upwards or downwards and where potential support or resistance levels may lie.
How to Use Ichimoku Indicator
Using the Ichimoku Indicator effectively involves understanding how each component interacts with price movements. Here are some key strategies for utilizing this tool:
- Identifying Trends: When prices are above the cloud, it indicates an uptrend; when prices are below, it signals a downtrend. If prices are within the cloud, it suggests a consolidation phase or indecision in the market.
- Entry Signals: A common entry signal occurs when the Tenkan-sen crosses above the Kijun-sen while both lines are above the cloud. Conversely, a bearish signal arises when Tenkan-sen crosses below Kijun-sen while both lines are below the cloud.
- Support and Resistance Levels: The cloud itself serves as dynamic support and resistance. Prices often bounce off the edges of the cloud; thus, traders can use these levels to set stop-loss orders or take-profit targets.
- Lagging Span Confirmation: The Chikou Span can provide additional confirmation for trades. If it is above price during an uptrend or below during a downtrend, it reinforces the validity of that trend.
Adding the Ichimoku to TradingView Chart Without Coding
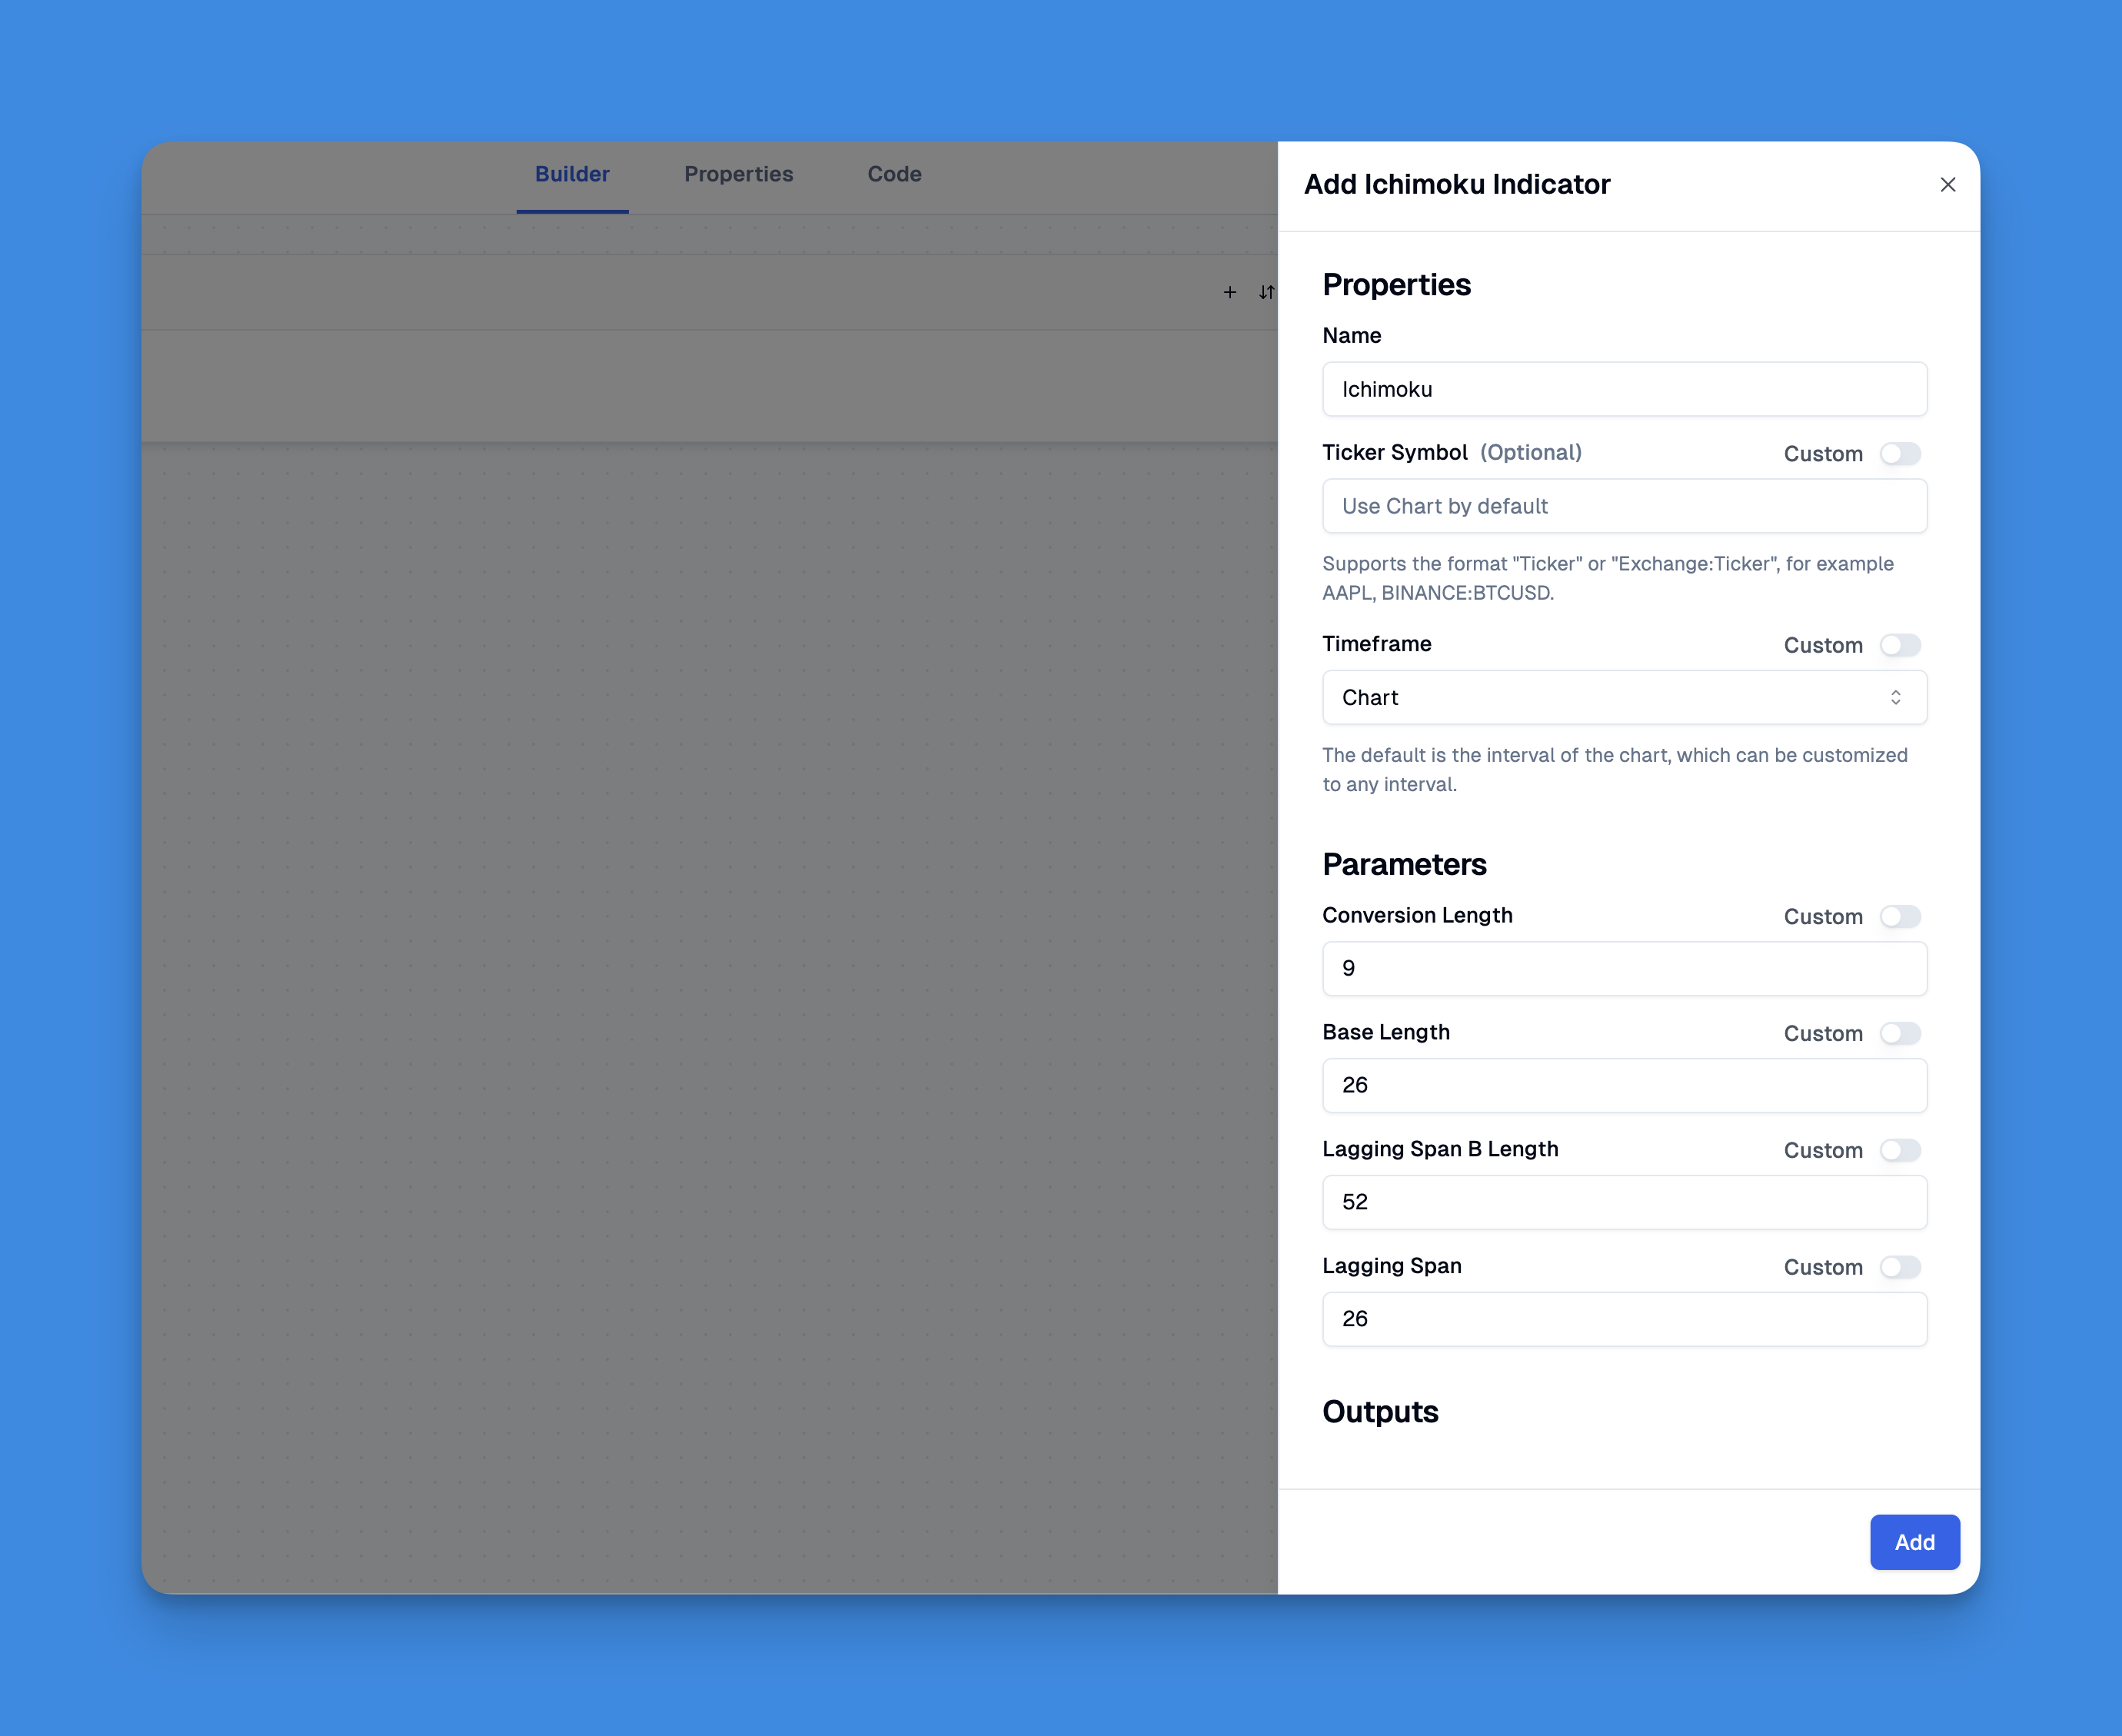
To add the Ichimoku indicator to your TradingView chart without any coding, you can leverage the capabilities of Pineify, a user-friendly platform designed for traders. Pineify allows you to create and manage multiple indicators effortlessly, eliminating the constraints typically associated with TradingView’s two-indicator limit.

Website: Pineify
Click here to view all the features of Pineify.By using Pineify, you can bypass the need for programming skills entirely. The platform provides a visual interface that simplifies the process of adding the Ichimoku indicator alongside other technical indicators. You can easily customize inputs and plots to suit your trading style, ensuring that your chart reflects your unique analysis preferences.
Ichimoku Pine Script Code
// This source code is subject to the terms of the Mozilla Public License 2.0 at https://mozilla.org/MPL/2.0/
// © Pineify
//======================================================================//
// ____ _ _ __ //
// | _ \(_)_ __ ___(_)/ _|_ _ //
// | |_) | | '_ \ / _ \ | |_| | | | //
// | __/| | | | | __/ | _| |_| | //
// |_| |_|_| |_|\___|_|_| \__, | //
// |___/ //
//======================================================================//
//@version=6
indicator(title="Ichimoku Indicator", overlay=true, max_labels_count=500)
//#region —————————————————————————————————————————————————— Custom Code
//#endregion ————————————————————————————————————————————————————————————
//#region —————————————————————————————————————————————————— Common Dependence
p_comm_time_range_to_unix_time(string time_range, int date_time = time, string timezone = syminfo.timezone) =>
int start_unix_time = na
int end_unix_time = na
int start_time_hour = na
int start_time_minute = na
int end_time_hour = na
int end_time_minute = na
if str.length(time_range) == 11
// Format: hh:mm-hh:mm
start_time_hour := math.floor(str.tonumber(str.substring(time_range, 0, 2)))
start_time_minute := math.floor(str.tonumber(str.substring(time_range, 3, 5)))
end_time_hour := math.floor(str.tonumber(str.substring(time_range, 6, 8)))
end_time_minute := math.floor(str.tonumber(str.substring(time_range, 9, 11)))
else if str.length(time_range) == 9
// Format: hhmm-hhmm
start_time_hour := math.floor(str.tonumber(str.substring(time_range, 0, 2)))
start_time_minute := math.floor(str.tonumber(str.substring(time_range, 2, 4)))
end_time_hour := math.floor(str.tonumber(str.substring(time_range, 5, 7)))
end_time_minute := math.floor(str.tonumber(str.substring(time_range, 7, 9)))
start_unix_time := timestamp(timezone, year(date_time, timezone), month(date_time, timezone), dayofmonth(date_time, timezone), start_time_hour, start_time_minute, 0)
end_unix_time := timestamp(timezone, year(date_time, timezone), month(date_time, timezone), dayofmonth(date_time, timezone), end_time_hour, end_time_minute, 0)
[start_unix_time, end_unix_time]
p_comm_time_range_to_start_unix_time(string time_range, int date_time = time, string timezone = syminfo.timezone) =>
int start_time_hour = na
int start_time_minute = na
if str.length(time_range) == 11
// Format: hh:mm-hh:mm
start_time_hour := math.floor(str.tonumber(str.substring(time_range, 0, 2)))
start_time_minute := math.floor(str.tonumber(str.substring(time_range, 3, 5)))
else if str.length(time_range) == 9
// Format: hhmm-hhmm
start_time_hour := math.floor(str.tonumber(str.substring(time_range, 0, 2)))
start_time_minute := math.floor(str.tonumber(str.substring(time_range, 2, 4)))
timestamp(timezone, year(date_time, timezone), month(date_time, timezone), dayofmonth(date_time, timezone), start_time_hour, start_time_minute, 0)
p_comm_time_range_to_end_unix_time(string time_range, int date_time = time, string timezone = syminfo.timezone) =>
int end_time_hour = na
int end_time_minute = na
if str.length(time_range) == 11
end_time_hour := math.floor(str.tonumber(str.substring(time_range, 6, 8)))
end_time_minute := math.floor(str.tonumber(str.substring(time_range, 9, 11)))
else if str.length(time_range) == 9
end_time_hour := math.floor(str.tonumber(str.substring(time_range, 5, 7)))
end_time_minute := math.floor(str.tonumber(str.substring(time_range, 7, 9)))
timestamp(timezone, year(date_time, timezone), month(date_time, timezone), dayofmonth(date_time, timezone), end_time_hour, end_time_minute, 0)
p_comm_timeframe_to_seconds(simple string tf) =>
float seconds = 0
tf_lower = str.lower(tf)
value = str.tonumber(str.substring(tf_lower, 0, str.length(tf_lower) - 1))
if str.endswith(tf_lower, 's')
seconds := value
else if str.endswith(tf_lower, 'd')
seconds := value * 86400
else if str.endswith(tf_lower, 'w')
seconds := value * 604800
else if str.endswith(tf_lower, 'm')
seconds := value * 2592000
else
seconds := str.tonumber(tf_lower) * 60
seconds
p_custom_sources() =>
[open, high, low, close, volume]
//#endregion ——————��———————————————————————————————————————————————————————————
//#region —————————————————————————————————————————————————— Ta Dependence
p_ta_donchian(len) => math.avg(ta.lowest(len), ta.highest(len))
p_ta_ichimoku(simple int conversion_length, simple int base_length, simple int span_b_length, simple int lagging_span) =>
conversionLine = p_ta_donchian(conversion_length)
baseLine = p_ta_donchian(base_length)
leadLine1 = math.avg(conversionLine, baseLine)
leadLine2 = p_ta_donchian(span_b_length)
[conversionLine, baseLine, leadLine1, leadLine2, close]
//#endregion ——————————————————��———————————————————————————————————————————
//#region —————————————————————————————————————————————————— Constants
// Input Groups
string P_GP_1 = ""
//#endregion —————————————————————————————————————————————————————————
//#region —————————————————————————————————————————————————— Inputs
//#endregion ———————————————————————————————————————————————————————
//#region —————————————————————————————————————————————————— Price Data
//#endregion ———————————————————————————————————————————————————————————
//#region —————————————————————————————————————————————————— Indicators
[p_ind_1_conversion, p_ind_1_base, p_ind_1_spanA, p_ind_1_spanB, p_ind_1_close] = p_ta_ichimoku(9, 26, 52, 26) // Ichimoku
//#endregion ———————————————————————————————————————————————————————————
//#region —————————————————————————————————————————————————— Conditions
//#endregion ———————————————————————————————————————————————————————————
//#region —————————————————————————————————————————————————— Indicator Plots
// Ichimoku
plot(p_ind_1_conversion, color=color.rgb(41, 98, 255, 0), linewidth=1, title="Ichimoku - Conversion Line")
plot(p_ind_1_base, color=color.rgb(183, 28, 28, 0), linewidth=1, title="Ichimoku - Base Line")
plot(p_ind_1_close, offset = -26 + 1, color=color.rgb(67, 160, 71, 0), linewidth=1, title="Ichimoku - Lagging Span")
p_ind_1_spanA_p = plot(p_ind_1_spanA, color=color.rgb(165, 214, 167, 0), linewidth=1, title="Ichimoku - Leading Span A", offset = 26 - 1)
p_ind_1_spanB_p = plot(p_ind_1_spanB, color=color.rgb(239, 154, 154, 0), linewidth=1, title="Ichimoku - Leading Span B", offset = 26 - 1)
fill(p_ind_1_spanA_p, p_ind_1_spanB_p, color=color.rgb(33, 150, 243, 90), title="Ichimoku - Cloud")
//#endregion ————————————————————————————————————————————————————————————————
//#region —————————————————————————————————————————————————— Custom Plots
//#endregion —————————————————————————————————————————————————————————————
//#region ————————————————————————————————��—————————————————— Alert
//#endregion ——————————————————————————————————————————————————————
Advantages of the Ichimoku
The Ichimoku Indicator offers several advantages for traders:
- Comprehensive Analysis: It combines multiple indicators into one cohesive system, allowing for a more straightforward analysis without needing additional tools.
- Trend Identification: The ability to quickly identify trends helps traders make informed decisions about when to enter or exit trades.
- Dynamic Support/Resistance: The cloud adjusts as new data comes in, providing real-time insights into potential support and resistance levels.
- Versatility: The Ichimoku can be applied across various markets including stocks, forex, and commodities, making it suitable for different trading styles such as day trading or swing trading.
Ichimoku in Trading Strategies
Incorporating the Ichimoku Indicator into trading strategies can enhance decision-making processes. Here are some common strategies:
- Trend-Following Strategy: Traders can enter positions in alignment with prevailing trends indicated by cloud positioning. For instance, entering long positions when prices break above the cloud can capitalize on upward momentum.
- Breakout Strategy: Watching for breakouts above or below the cloud can signal significant shifts in market sentiment. Such breakouts often lead to strong price movements.
- Reversal Strategy: Traders might look for signals indicating potential reversals when leading spans cross each other (Kumo twist), suggesting shifts in market direction.
Limitations of the Ichimoku
Despite its many benefits, there are limitations to consider:
- Complexity for Beginners: The multiple components can be overwhelming for novice traders who may struggle to interpret signals accurately without adequate training.
- Lagging Nature: Since many elements of Ichimoku are based on historical data, they may lag behind current price movements, leading to delayed signals during fast-moving markets.
- Market Conditions Sensitivity: The effectiveness of Ichimoku may vary depending on market conditions; it performs best in trending markets but can produce false signals during choppy or sideways price action.
Conclusion
The Ichimoku Indicator is a powerful tool that provides traders with valuable insights into market trends and potential trading opportunities. By understanding its components and how to utilize them effectively within various trading strategies, traders can enhance their decision-making processes. However, it's essential to recognize its limitations and complement it with other analysis methods for optimal results.
For those looking to deepen their understanding of technical analysis or refine their trading strategies using Pine Script for implementation on platforms like TradingView, mastering the Ichimoku Indicator can be a significant asset in navigating financial markets successfully.