request.security() in Pine Script: Multi-Timeframe Without Surprises
request.security() is a Pine Script function that fetches data from any symbol or timeframe, not just the one on your current chart. You can pull OHLCV values, custom calculations, or entire indicator outputs from another context and display them in your active script.
Ever found yourself on a 1-minute chart needing the daily trend? Or trading SPY but wanting to watch what the VIX is doing at the same time? That's exactly what this function does. I've been using it for years.
Back in February 2024 I built a multi-timeframe strategy on MES futures — request.security() handled the 15-minute vs 1-hour data switching without a single issue. In October 2023, I built an indicator tracking AAPL against the XLK tech sector ETF, both streams on one pane. It works, but you need to know where it doesn't.
The basic syntax
Here's the structure:
data = request.security(symbol, timeframe, expression, gaps, lookahead)
The parameters break down like this:
- symbol: The ticker you want ("NASDAQ:AAPL" or "BINANCE:BTCUSDT")
- timeframe: The timeframe ("1D", "4H", "15", etc.)
- expression: What you want (close, high, low, or a custom calc)
- gaps: Handles missing data (optional)
- lookahead: Future data flag — keep it off (optional, defaults to barmerge.lookahead_off)
Here's the simplest example — pull the daily close onto any intraday chart:
//@version=5
indicator("Daily Close on Intraday Chart")
daily_close = request.security(syminfo.tickerid, "1D", close)
plot(daily_close, "Daily Close", color.blue, linewidth=2)
One line. You now have daily data sitting on your 5-minute chart.
Applications I actually use
Multi-timeframe trend analysis: I'm on a 15-minute chart but I need the daily and weekly SMA. Pulling those higher timeframe averages onto the intraday pane tells me whether I'm trading with or against the bigger picture. This alone changed how I enter trades. If you're new to this approach, there's a good multi-timeframe analysis guide that covers the broader concepts.
Cross-asset correlation: When I trade forex, I pull in the Dollar Index (DXY) to gauge USD direction. For stocks I monitor SPY or XLK — if the sector ETF is falling, I'm less inclined to go long on an individual name.
Relative strength comparison: I run scripts that compare a stock against its sector ETF. It lets me spot when AAPL is genuinely outperforming XLK versus just riding a sector-wide wave. request.security() makes that comparison possible on a single pane.
Volatility check: VIX on your stock charts tells you the fear context. I don't enter long positions if VIX is above 30, and this function makes that data available on any chart without switching tabs.

Building a multi-timeframe RSI
Here's something I actually run. An indicator showing RSI from three timeframes at once:
//@version=5
indicator("Multi-Timeframe RSI", shorttitle="MTF RSI")

// Input parameters
rsi_length = input.int(14, "RSI Length")
htf1 = input.timeframe("1H", "Higher Timeframe 1")
htf2 = input.timeframe("4H", "Higher Timeframe 2")
htf3 = input.timeframe("1D", "Higher Timeframe 3")

// Calculate RSI for current timeframe
current_rsi = ta.rsi(close, rsi_length)

// Request RSI from higher timeframes
htf1_rsi = request.security(syminfo.tickerid, htf1, ta.rsi(close, rsi_length))
htf2_rsi = request.security(syminfo.tickerid, htf2, ta.rsi(close, rsi_length))
htf3_rsi = request.security(syminfo.tickerid, htf3, ta.rsi(close, rsi_length))

// Plot everything
plot(current_rsi, "Current TF RSI", color.white)
plot(htf1_rsi, "1H RSI", color.yellow)
plot(htf2_rsi, "4H RSI", color.orange)
plot(htf3_rsi, "Daily RSI", color.red)

// Add overbought/oversold levels
hline(70, "Overbought", color.red, linestyle=hline.style_dashed)
hline(30, "Oversold", color.green, linestyle=hline.style_dashed)
The white line is your current timeframe. Yellow, orange, and red are hourly, 4-hour, and daily. If the daily RSI is oversold but the 15-minute is overbought, you know there's a short-term pullback inside a bigger uptrend. That's the kind of context multi-timeframe data gives you.
Limitations I've hit (and you will too)
The 40-request cap: TradingView hard-stops at 40 request.security() calls per script. I discovered this building a screener on 50 stocks — the script wouldn't compile. I had to refactor with tuple expressions (multiple values in one call) to stay under the limit.
Performance drag: Each call costs CPU. I once built an indicator with 30 security requests and my chart lagged noticeably. These days I keep it under 10 unless there's a clear reason to go higher.
Repainting gotchas: The current unclosed bar on a higher timeframe can change until it closes. If you're building strategies, always use barmerge.lookahead_off. I prefer setting this explicitly even though it's the default in v5 — defensive coding saves you from bad backtest numbers and worse live trades.
Timeframe direction: You can only request data from equal or higher timeframes, not lower. On a daily chart, grab 1-hour granularity won't work with this function. Use request.security_lower_tf() (added in v5) for that.
Advanced tricks I picked up
Custom expressions: You're not limited to OHLC. Request any formula:
// Request a custom calculation from daily timeframe
daily_volatility = request.security(syminfo.tickerid, "1D", ta.stdev(close, 20))
Variable-based timeframes: Store your inputs for cleaner code:
htf = input.timeframe("4H", "Higher Timeframe")
ma_length = input.int(20, "MA Length")
htf_ma = request.security(syminfo.tickerid, htf, ta.sma(close, ma_length))
Gap handling: Choose how missing data behaves:
// Different gap handling options
continuous_data = request.security(symbol, timeframe, close, gaps=barmerge.gaps_off)
with_gaps = request.security(symbol, timeframe, close, gaps=barmerge.gaps_on)
I use gaps_off for most indicators — continuity matters more than missing-bar detection. I switch to gaps_on only when I specifically need to detect that data was absent from the higher timeframe.
Tuple expressions to beat the 40-call limit: Pack multiple values into one request:
[htf_ma, htf_rsi] = request.security(syminfo.tickerid, "1D", [ta.sma(close, 20), ta.rsi(close, 14)])
One call, two values. This scales without hitting the cap.
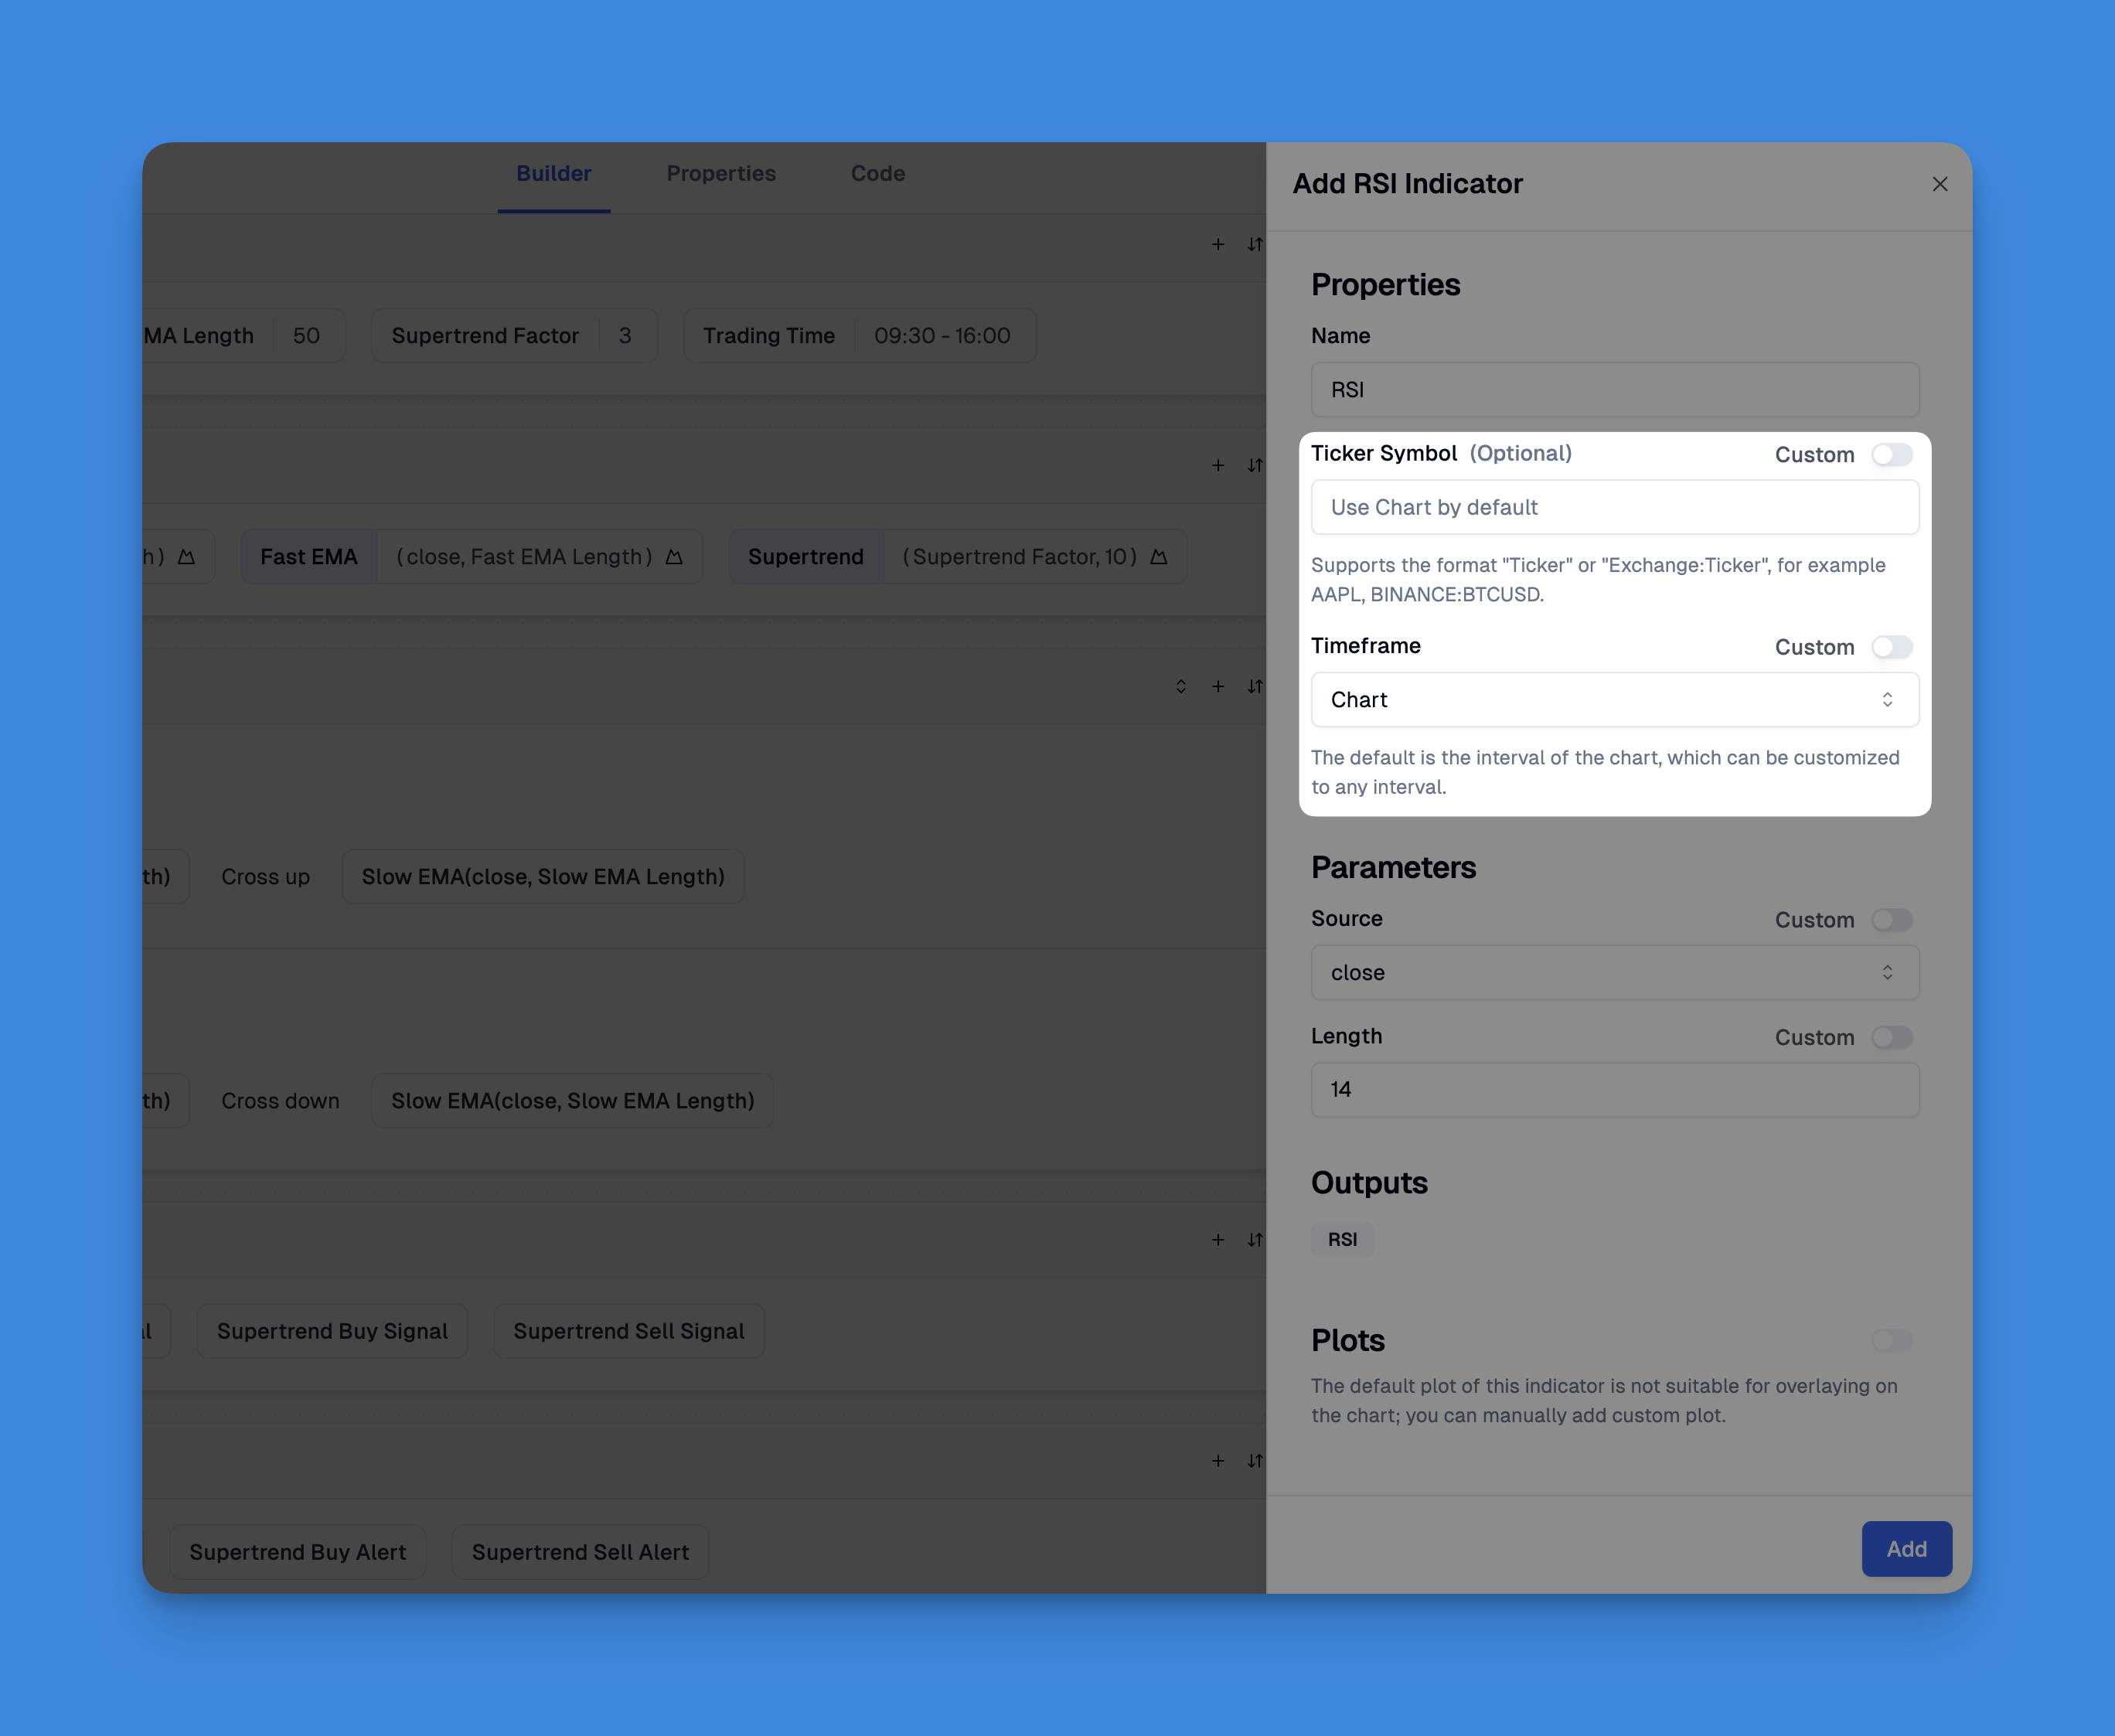
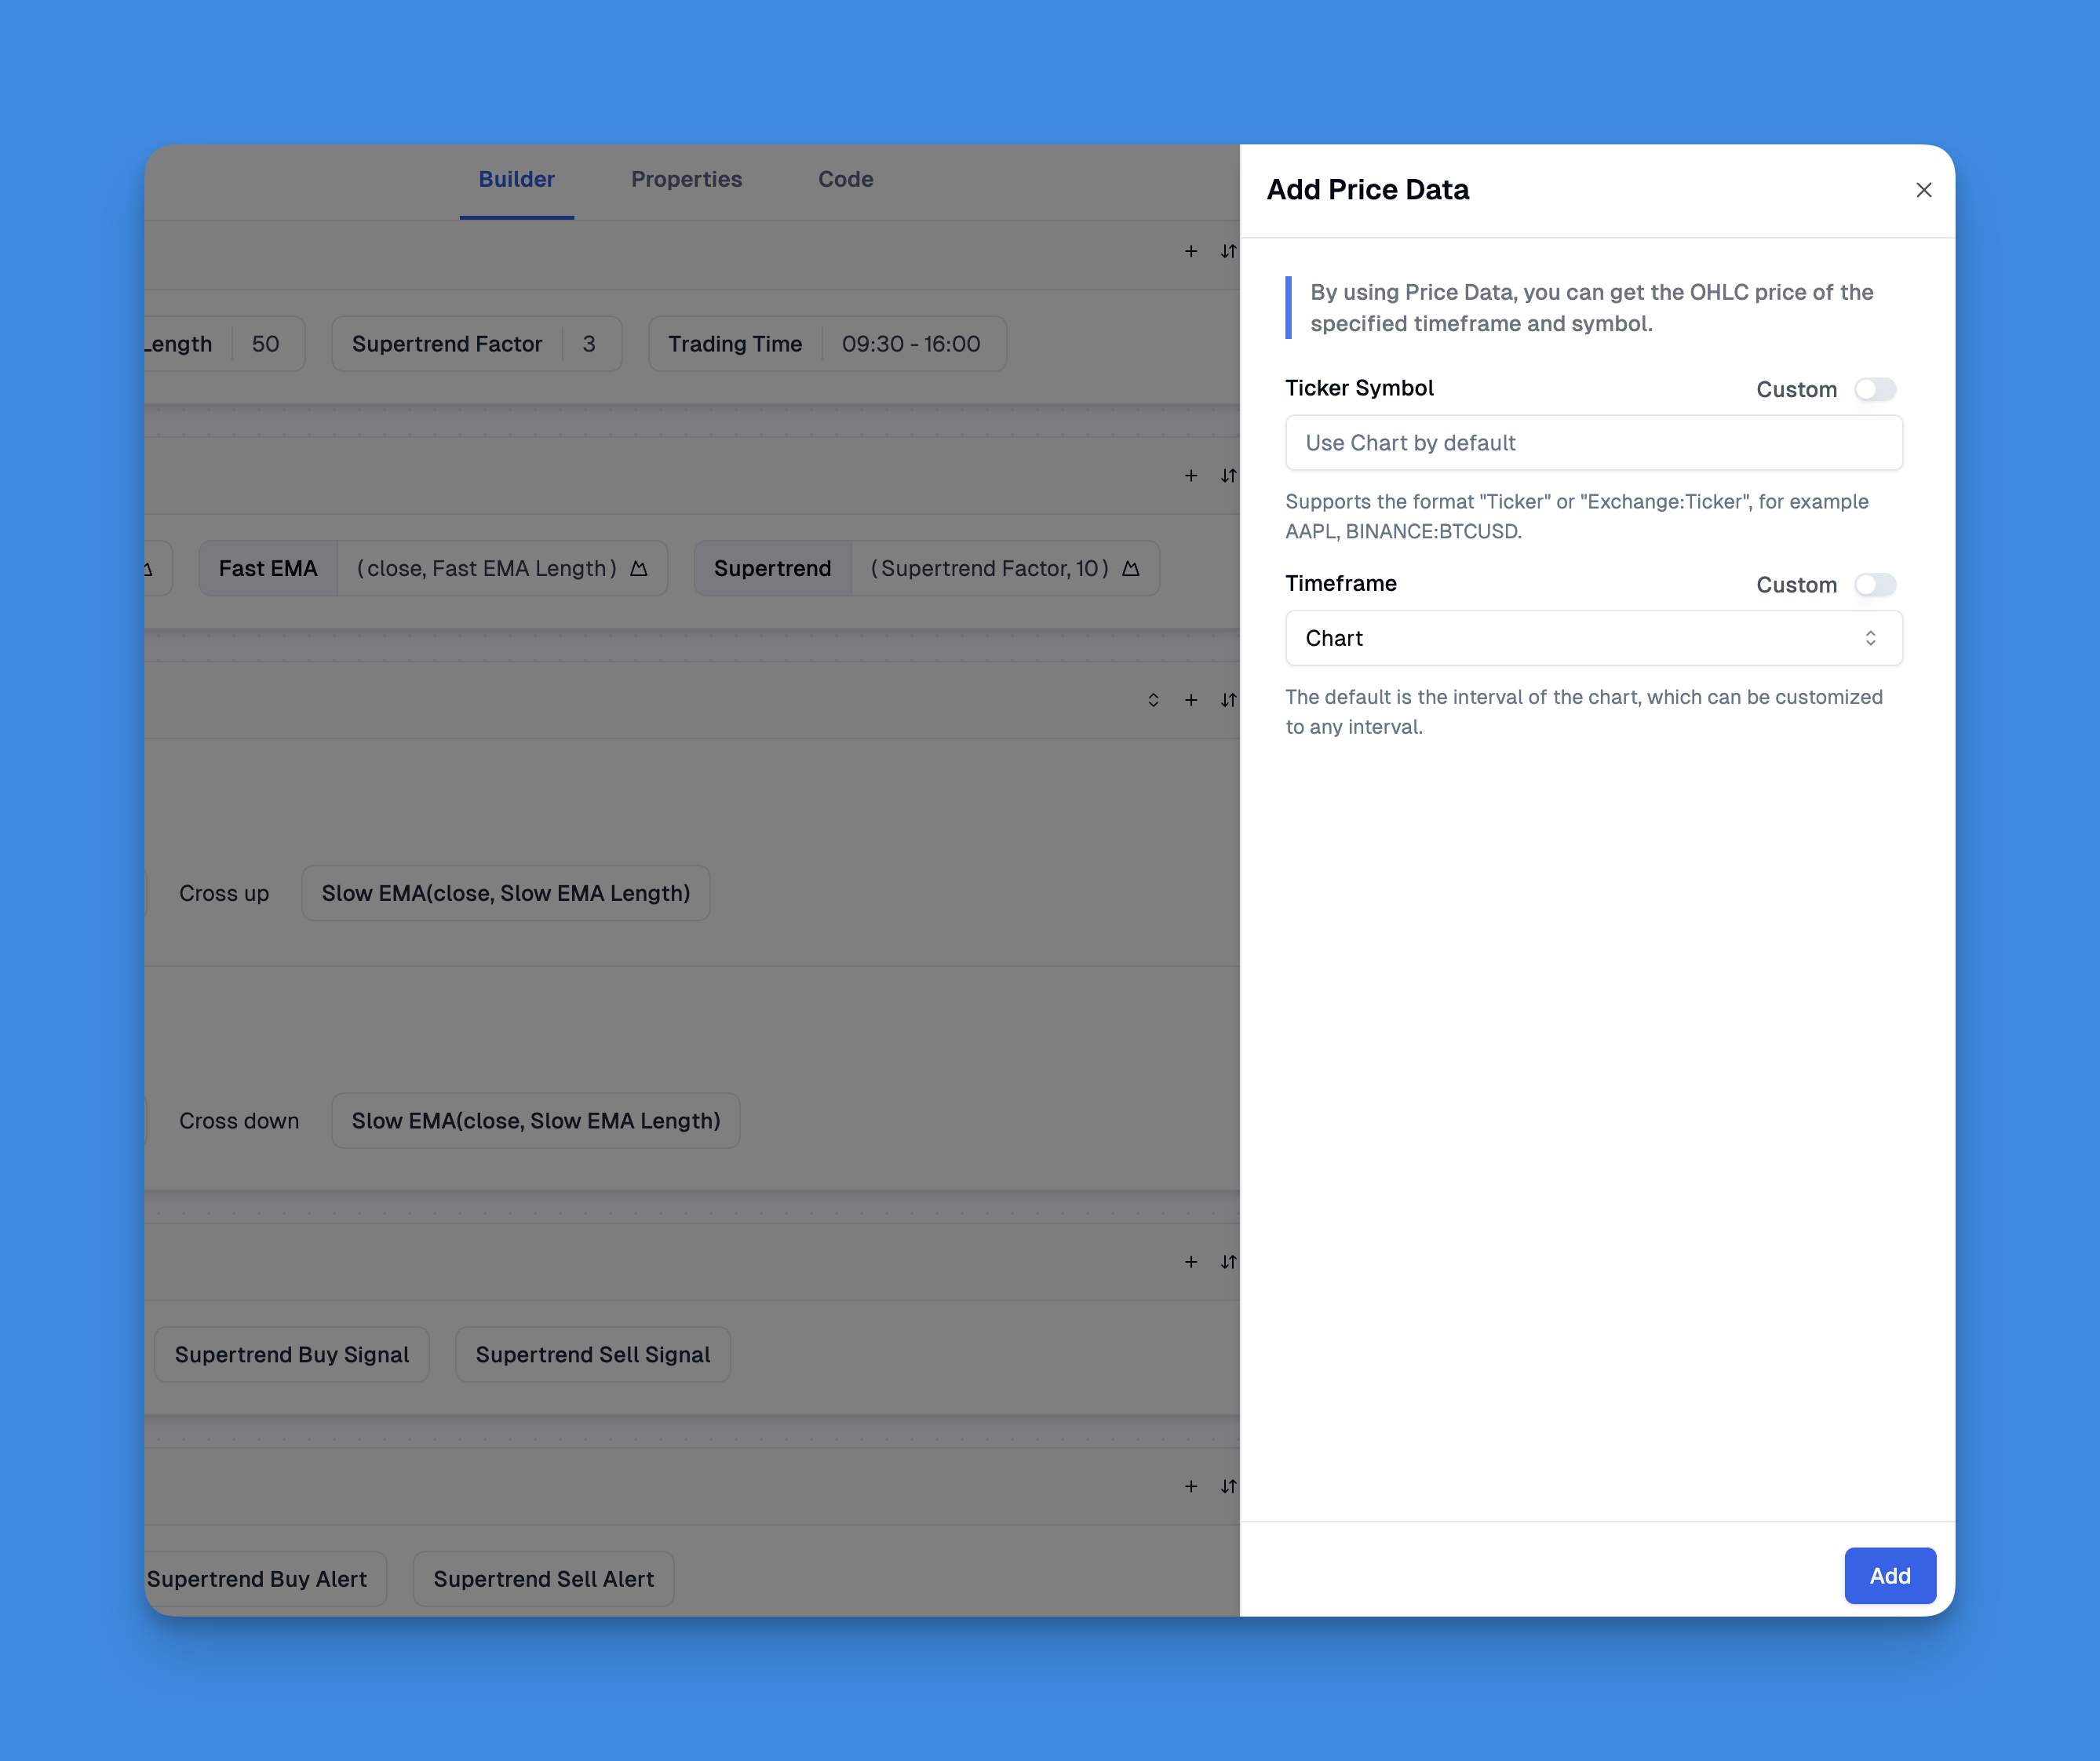
If you're getting started and want to experiment without chasing syntax errors, visual tools like Pineify's indicator builder handle request.security() behind the scenes. I've used it for quick prototypes before writing the final version by hand. It's not a replacement — sometimes you need full control over edge cases and performance — but it gets you from zero to a working concept fast.
Frequently Asked Questions
▶What does request.security() do in Pine Script?
It lets your script pull OHLCV data or custom values from a different symbol or timeframe than the one displayed on your chart. Think of it as a data bridge — you stay on your chart, and the function fetches data from somewhere else.
▶What are the required parameters for request.security()?
Three are required: symbol (like "NASDAQ:AAPL"), timeframe ("1D"), and expression (close, or a formula). The two optional ones — gaps and lookahead — control how missing bars and future data are handled.
▶How do I avoid repainting when using request.security()?
Set lookahead to barmerge.lookahead_off. That's the default in v5, but I always set it explicitly anyway. It stops the script from looking at future data on the higher timeframe bar, which is the main cause of repainting in multi-timeframe indicators.
▶Can I request data from a lower timeframe with request.security()?
The call won't throw an error, but you won't get intra-bar granularity — the value just repeats the current bar. For real lower-timeframe data, use request.security_lower_tf() instead. That function was added in Pine Script v5.
▶How many request.security() calls can I use in one script?
TradingView caps it at 40. If you need more, consolidate calls with tuple expressions (multiple values in one call) or split your logic across several indicators.
▶What is the difference between barmerge.gaps_on and barmerge.gaps_off?
gaps_off fills na gaps with the last known value — you get a continuous series. gaps_on preserves the na values so you can detect missing bars. I use gaps_off for most calculations and switch to gaps_on only when I need to know a bar was absent.
▶Can I pass a custom calculation as the expression argument?
Yes. The expression accepts any series — ta.rsi(close, 14), ta.sma(close, 20), ta.stdev(close, 20), anything you need. Pine Script evaluates it in the context of the requested symbol and timeframe, not the chart's current context.