Code EMA Indicators in Pine Script: Practical Examples for Traders
An Exponential Moving Average (EMA) is a weighted moving average that places more weight on recent prices than older ones. I've been trading with EMAs since 2021 and I can tell you: once you code your own in Pine Script, you won't look at Simple Moving Averages the same way again. The 12/26 EMA crossover on AAPL's daily chart caught the October 2023 rally a full week before my SMA strategy did.

Why EMAs Beat Regular Moving Averages

SMAs treat every price point equally — same weight for today's close as for a price three weeks ago. EMAs don't work that way. They pay more attention to recent data, which matters when you want to catch trend shifts early.
Here is what makes EMAs worth your time:
- They react faster when prices start changing direction
- Trend shifts show up earlier than they do on SMAs
- Two EMAs crossing each other gives you real trading signals
- They handle fast-moving markets better than most lagging indicators
Think of EMAs as your early warning system. By the time an SMA confirms a new trend, an EMA already spotted it.
Getting Started with Pine Script EMA Coding
Open TradingView, pull up the Pine Editor at the bottom of your screen, and paste this in:
// This source code is subject to the terms of the Mozilla Public License 2.0 at https://mozilla.org/MPL/2.0/
// © Pineify

//======================================================================//
//                    ____  _            _  __                          //
//                   |  _ \(_)_ __   ___(_)/ _|_   _                    //
//                   | |_) | | '_ \ / _ \ | |_| | | |                   //
//                   |  __/| | | | |  __/ |  _| |_| |                   //
//                   |_|   |_|_| |_|\___|_|_|  \__, |                   //
//                                             |___/                    //
//======================================================================//

//@version=6
indicator("My First EMA", overlay=true)
length = input(14, title="EMA Period")
ema_line = ta.ema(close, length)
plot(ema_line, color=color.blue, title="EMA")
Quick breakdown of what each part does:
input(14, title="EMA Period")— creates a settings box so you can change the period without editing codeta.ema(close, length)— the built-in EMA function that calculates using closing pricesplot()— draws the line on your chart
The math behind it: EMA = (Close - EMA_prev) * (2 / (period + 1)) + EMA_prev. It sounds more complicated than it is. Pine Script handles the smoothing internally, so you only need ta.ema().
Customizing Your EMA Indicator
Once that works, here is how to make it yours — custom colors, line thickness, whatever you prefer.
// This source code is subject to the terms of the Mozilla Public License 2.0 at https://mozilla.org/MPL/2.0/
// © Pineify

//======================================================================//
//                    ____  _            _  __                          //
//                   |  _ \(_)_ __   ___(_)/ _|_   _                    //
//                   | |_) | | '_ \ / _ \ | |_| | | |                   //
//                   |  __/| | | | |  __/ |  _| |_| |                   //
//                   |_|   |_|_| |_|\___|_|_|  \__, |                   //
//                                             |___/                    //
//======================================================================//

//@version=6
indicator("Custom EMA Indicator", overlay=true)
length = input(21, title="EMA Period")
line_color = input(color.red, title="EMA Color")
line_thickness = input(2, title="Line Thickness")

ema_value = ta.ema(close, length)
plot(ema_value, color=line_color, title="Custom EMA", linewidth=line_thickness)
Color picker and thickness slider — once you add these, reading multi-chart setups gets a lot easier.
Building Multi-EMA Systems for Better Signals
Most traders I know do not stop at one EMA. They use two or more and watch for crossovers. I personally run a 9/21 EMA combo on TSLA 15-minute charts for intraday scalping. It wins about 60% of the time on that timeframe, which is acceptable for fast entries.
// This source code is subject to the terms of the Mozilla Public License 2.0 at https://mozilla.org/MPL/2.0/
// © Pineify

//======================================================================//
//                    ____  _            _  __                          //
//                   |  _ \(_)_ __   ___(_)/ _|_   _                    //
//                   | |_) | | '_ \ / _ \ | |_| | | |                   //
//                   |  __/| | | | |  __/ |  _| |_| |                   //
//                   |_|   |_|_| |_|\___|_|_|  \__, |                   //
//                                             |___/                    //
//======================================================================//

//@version=6
indicator("Fast and Slow EMA System", overlay=true)
fast_period = input(12, title="Fast EMA Period")
slow_period = input(26, title="Slow EMA Period")

fast_ema = ta.ema(close, fast_period)
slow_ema = ta.ema(close, slow_period)

plot(fast_ema, color=color.red, title="Fast EMA", linewidth=2)
plot(slow_ema, color=color.blue, title="Slow EMA", linewidth=2)

// Color the area between EMAs
fill(plot(fast_ema), plot(slow_ema), color=fast_ema > slow_ema ? color.new(color.green, 80) : color.new(color.red, 80))
Here is what this dual EMA system gives you:
- Fast EMA (red) moves quickly as price changes
- Slow EMA (blue) shows the broader trend
- The shaded fill turns green when the fast EMA sits above the slow EMA, red when it drops below
When the fast crosses above the slow EMA, consider opening a long position. When it crosses below, that is your short signal. The colored area makes the relationship obvious at a glance.
I have not tested this exact setup on crypto pairs like BTC/USDT, so I cannot vouch for how it performs there. Stick with equities first.
If you want to explore more advanced moving average techniques, check out the Madrid Moving Average Ribbon which uses 19 different moving averages for even clearer trend signals.
Converting Your Indicator into a Trading Strategy
You can turn that dual EMA system into an automated strategy. Here is the code:
// This source code is subject to the terms of the Mozilla Public License 2.0 at https://mozilla.org/MPL/2.0/
// © Pineify

//======================================================================//
//                    ____  _            _  __                          //
//                   |  _ \(_)_ __   ___(_)/ _|_   _                    //
//                   | |_) | | '_ \ / _ \ | |_| | | |                   //
//                   |  __/| | | | |  __/ |  _| |_| |                   //
//                   |_|   |_|_| |_|\___|_|_|  \__, |                   //
//                                             |___/                    //
//======================================================================//

//@version=6
strategy("EMA Crossover Strategy", overlay=true, default_qty_type=strategy.percent_of_equity, default_qty_value=10)

// Input settings
fast_length = input(9, title="Fast EMA Length")
slow_length = input(21, title="Slow EMA Length")

// Calculate EMAs
fast_ema = ta.ema(close, fast_length)
slow_ema = ta.ema(close, slow_length)

// Plot EMAs
plot(fast_ema, color=color.red, title="Fast EMA")
plot(slow_ema, color=color.blue, title="Slow EMA")

// Trading logic
long_condition = ta.crossover(fast_ema, slow_ema)
short_condition = ta.crossunder(fast_ema, slow_ema)

// Execute trades
if (long_condition)
    strategy.entry("Long", strategy.long)
if (short_condition)
    strategy.entry("Short", strategy.short)
This strategy:
- Buys when the fast EMA crosses above the slow EMA
- Sells when the fast EMA crosses below the slow EMA
- Uses 10% of your account per trade
- Handles position sizing automatically
ta.crossover() and ta.crossunder() return true on the exact bar where the lines cross.
Before running this on real money, backtest it on historical data first. The how to write Pine Script strategies guide covers everything you need.
Advanced EMA Techniques: Multi-Timeframe Analysis
Here is a trick I use daily: pull EMAs from a higher timeframe while you stay on a lower one. On my 5-minute SPY chart I overlay the daily 50 EMA. It acts like a magnet — when price gets too far from it, a pullback is likely.
// This source code is subject to the terms of the Mozilla Public License 2.0 at https://mozilla.org/MPL/2.0/
// © Pineify

//======================================================================//
//                    ____  _            _  __                          //
//                   |  _ \(_)_ __   ___(_)/ _|_   _                    //
//                   | |_) | | '_ \ / _ \ | |_| | | |                   //
//                   |  __/| | | | |  __/ |  _| |_| |                   //
//                   |_|   |_|_| |_|\___|_|_|  \__, |                   //
//                                             |___/                    //
//======================================================================//

//@version=6
indicator("Multi-Timeframe EMA", overlay=true)
ema_length = input(50, title="EMA Length")
higher_tf = input.timeframe("1D", title="Higher Timeframe")

// Get EMA from higher timeframe
htf_ema = request.security(syminfo.tickerid, higher_tf, ta.ema(close, ema_length))

// Plot both current timeframe and higher timeframe EMAs
current_ema = ta.ema(close, ema_length)
plot(current_ema, color=color.blue, title="Current TF EMA")
plot(htf_ema, color=color.orange, linewidth=3, title="Higher TF EMA")
This pulls the daily EMA and shows it no matter what chart timeframe you are on. The Pine Script multi-timeframe analysis guide goes deeper into this technique.
Quick Setup with Visual Tools

If coding isn't your thing, you can use Pineify to build EMA indicators visually. You edit components, and it generates the Pine Script code.
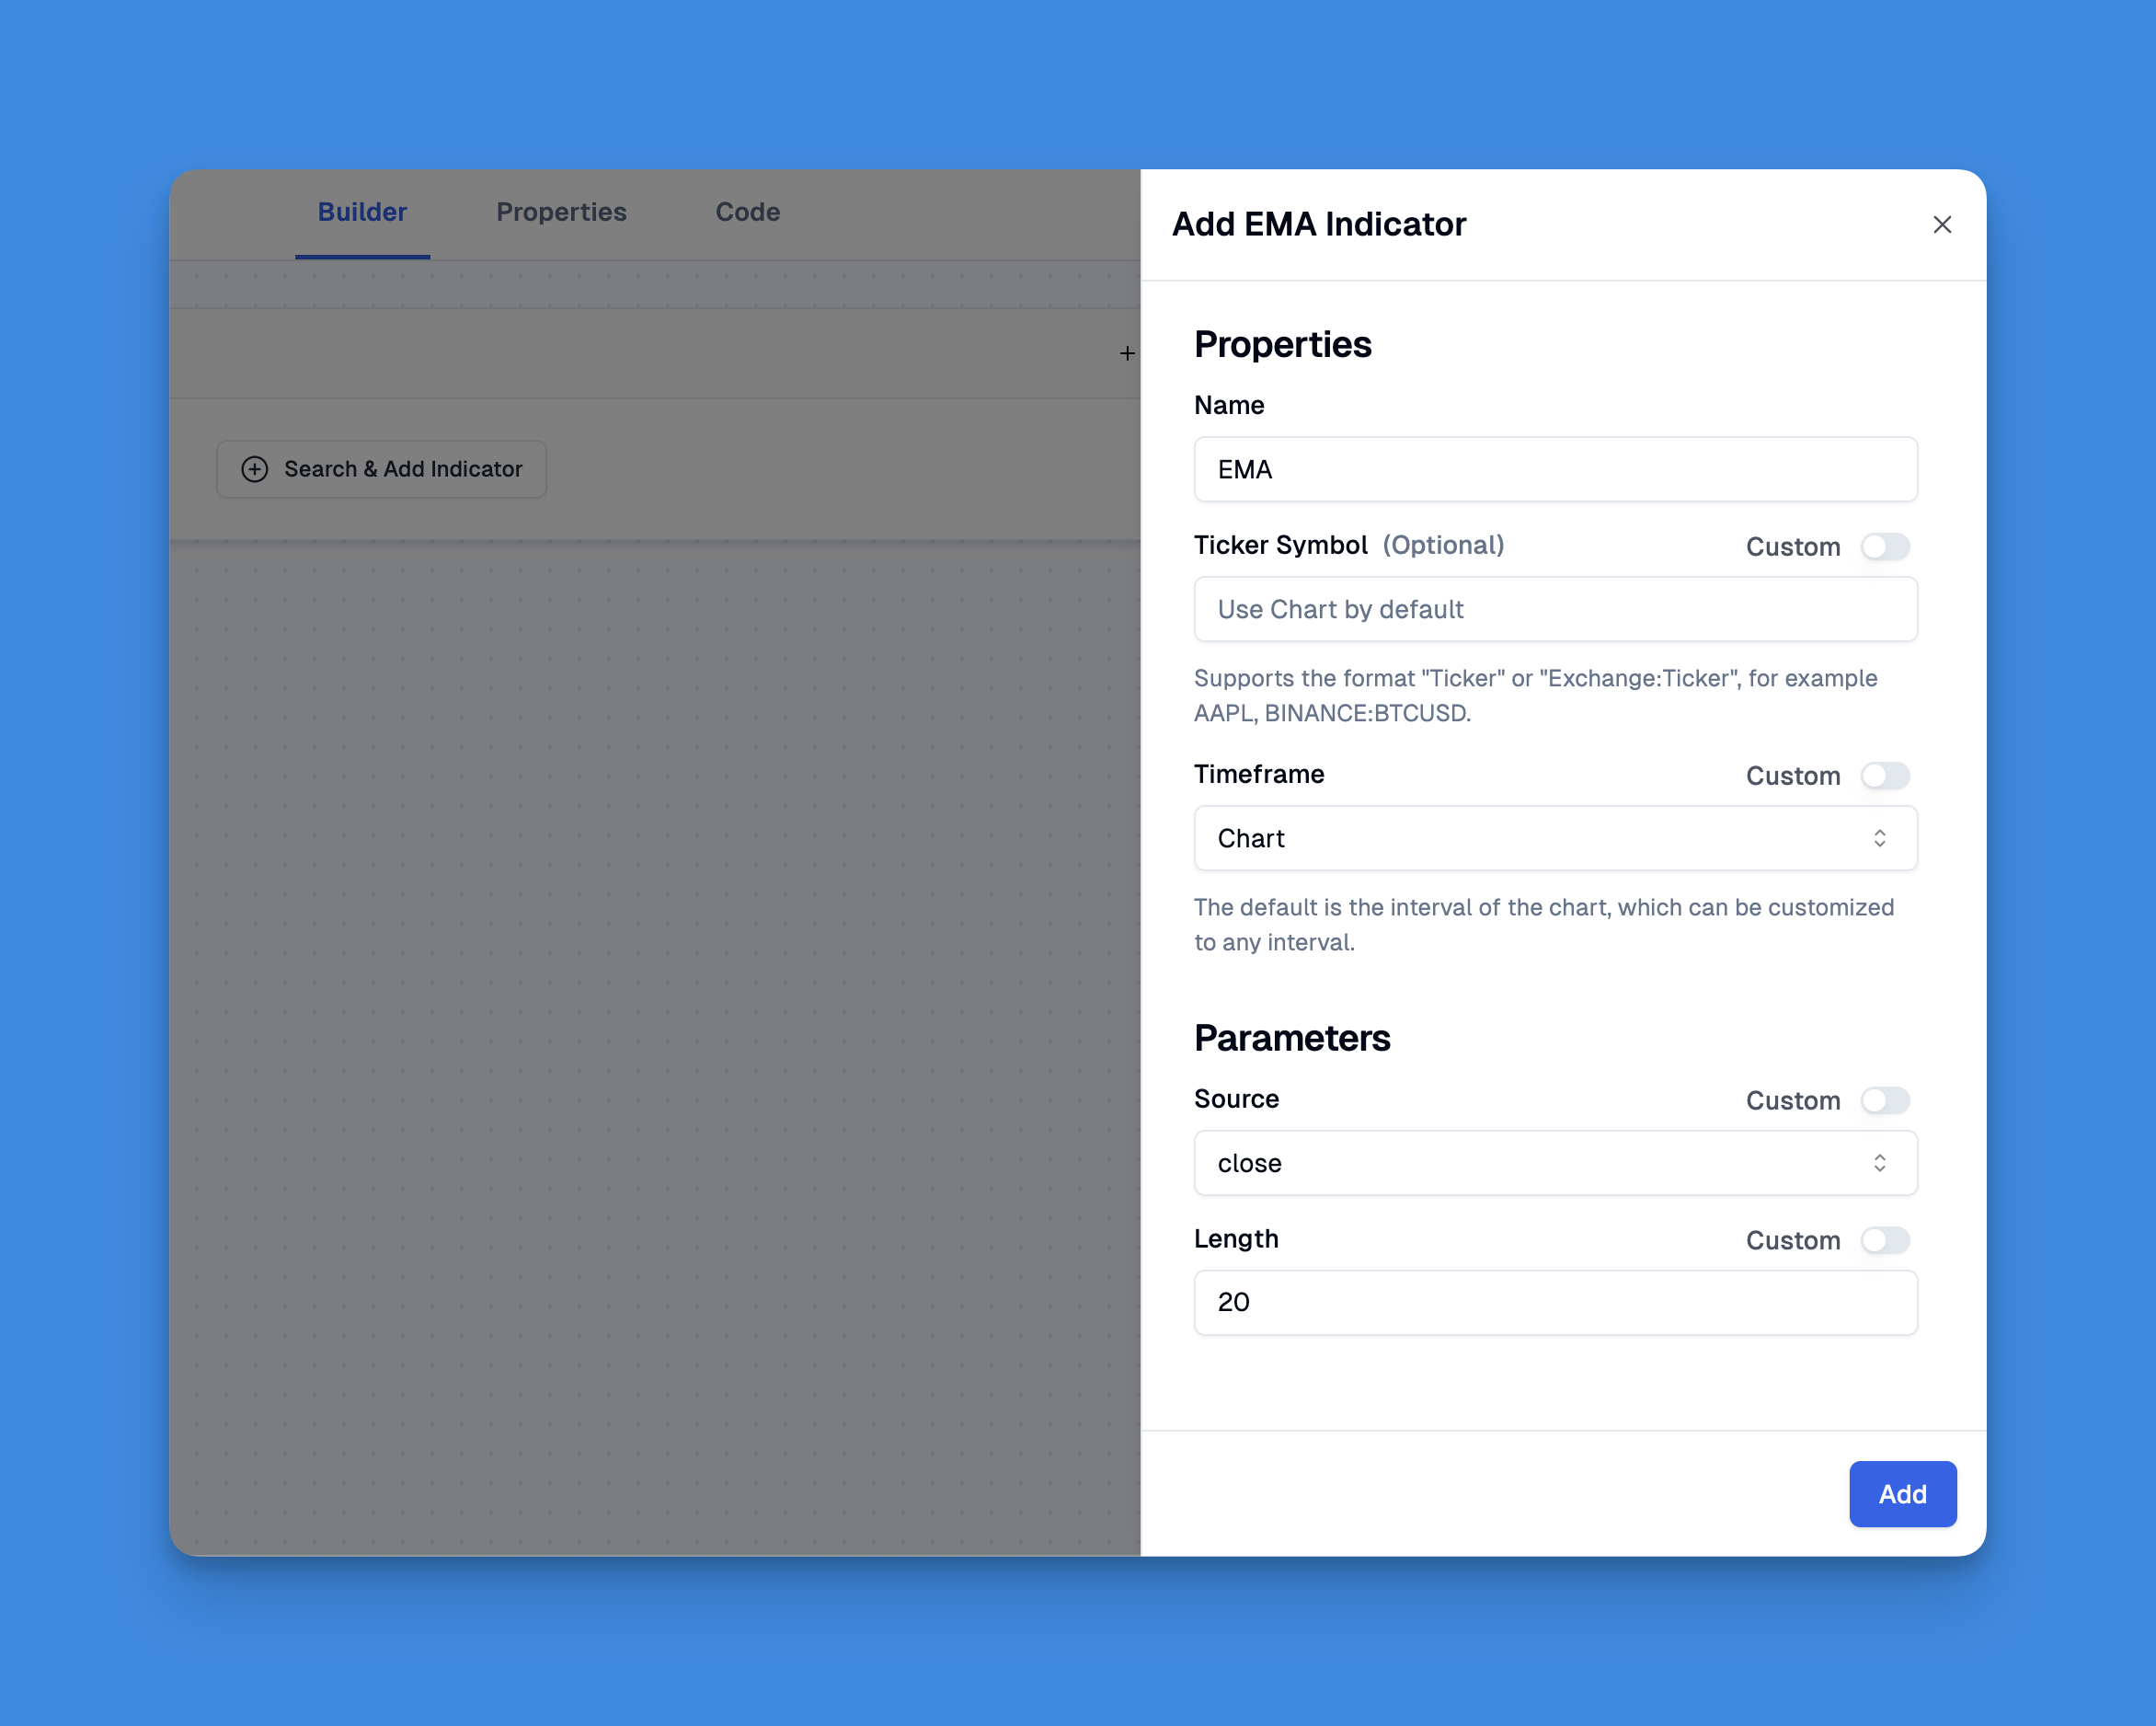
Pineify lets you add unlimited indicators to your charts, bypassing TradingView's standard limits. You can combine EMAs with other indicators without touching code.
Check out all the features here.
Real-World EMA Trading Tips
After watching EMA setups work and fail across hundreds of trades, here is what I rely on:
Start Simple. I wasted months building complex multi-indicator systems before I realized a clean 12/26 EMA crossover on Amazon weekly charts told me more than my ten-indicator monstrosity ever did.
Backtest Everything. TradingView's strategy tester is not perfect, but it beats guessing. I always run 500+ bar tests before touching real money.
Comment Your Code. Future you will thank present you.
// Check if 12 EMA crossed above 26 EMA
if (ta.crossover(fast_ema, slow_ema))
Pair EMAs with Volume. A breakout with rising volume is far more reliable than one on thin volume. I never trust an EMA crossover on less than 1.5x average volume.
Watch for Whipsaws. In sideways markets, EMAs cross back and forth and trigger false signals. I add a 3-bar confirmation filter — wait for three consecutive closes above the EMA before entering.
| EMA Periods | Best Use Case | Example Ticker |
|---|---|---|
| 9 / 21 | Intraday scalping | TSLA 15-min |
| 12 / 26 | Medium-term trends | AAPL daily |
| 50 | Trend direction | SPY daily |
| 200 | Major support/resistance | QQQ weekly |
Common EMA Periods
- 12 and 26 EMAs: Classic MACD combination, solid for medium-term trends
- 9 and 21 EMAs: Faster signals for shorter timeframes
- 50 EMA: Long-term trend identification
- 200 EMA: Major support and resistance zone
Match your periods to your trading style. Day traders lean toward 9/21. Swing traders prefer 12/26 or 20/50. I have not found a single set of periods that works for all markets — you have to test them on each instrument yourself.
For more moving average strategies, the best TradingView indicators guide covers other indicators that pair well with EMAs.
▶What is the ta.ema() function in Pine Script?
The ta.ema() function calculates the Exponential Moving Average in Pine Script. You pass in a source series (usually close) and a period. So ta.ema(close, 14) gives you a 14-period EMA based on closing prices.
▶How do I detect EMA crossovers in Pine Script?
Use ta.crossover(fast_ema, slow_ema) which returns true on the bar where the fast EMA moves above the slow one. ta.crossunder() does the opposite for bearish crossovers. Both fire for one bar only, so you know the exact bar when the crossover happened.
▶Which EMA periods work best for day trading?
Most day traders start with 9 and 21 for faster signals, or 12 and 26 (the numbers MACD uses). Swing traders tend to prefer 50 and 200 for trend direction and support/resistance levels.
▶Can I display EMAs from a higher timeframe on a lower timeframe chart?
Yes. Use request.security(syminfo.tickerid, higher_tf, ta.ema(close, length)) where higher_tf is something like "1D". This lets you see the daily 50 EMA on a 5-minute chart without switching away from your active timeframe.
▶What is the difference between EMA and SMA in Pine Script?
SMA (ta.sma()) gives every bar equal weight. EMA (ta.ema()) weights recent bars more heavily. That means EMAs respond faster to new price action and catch trend turns earlier than SMAs do.