Best Indicators on TradingView for Enhanced Trading Decisions
TradingView is a powerful platform that offers a wide array of indicators to help traders make informed decisions across various markets, including stocks, forex, crypto, and futures. In this article, we will explore some of the best indicators available on TradingView, highlighting their benefits and how they can be used to enhance your trading strategy.
Introduction to TradingView Indicators
TradingView indicators are tools that analyze market data to provide insights into trends, volatility, and potential price movements. These indicators can be used individually or combined to create a comprehensive trading strategy. Here are some of the top indicators for 2025:
- Technical Ratings: Combines signals from multiple indicators like SMAs, EMAs, Ichimoku Cloud, RSI, and Stochastic to provide a holistic view of market sentiment.
- Volume Profile HD: Identifies key support and resistance levels by analyzing volume at specific price points.
- Relative Strength Index (RSI): Helps identify overbought or oversold conditions.
- Moving Average Convergence Divergence (MACD): Illustrates trend reversals and momentum shifts.
- Bollinger Bands: Offers insights into market volatility and potential breakouts.
Customizing Your TradingView Experience with No-Code Indicator Creation
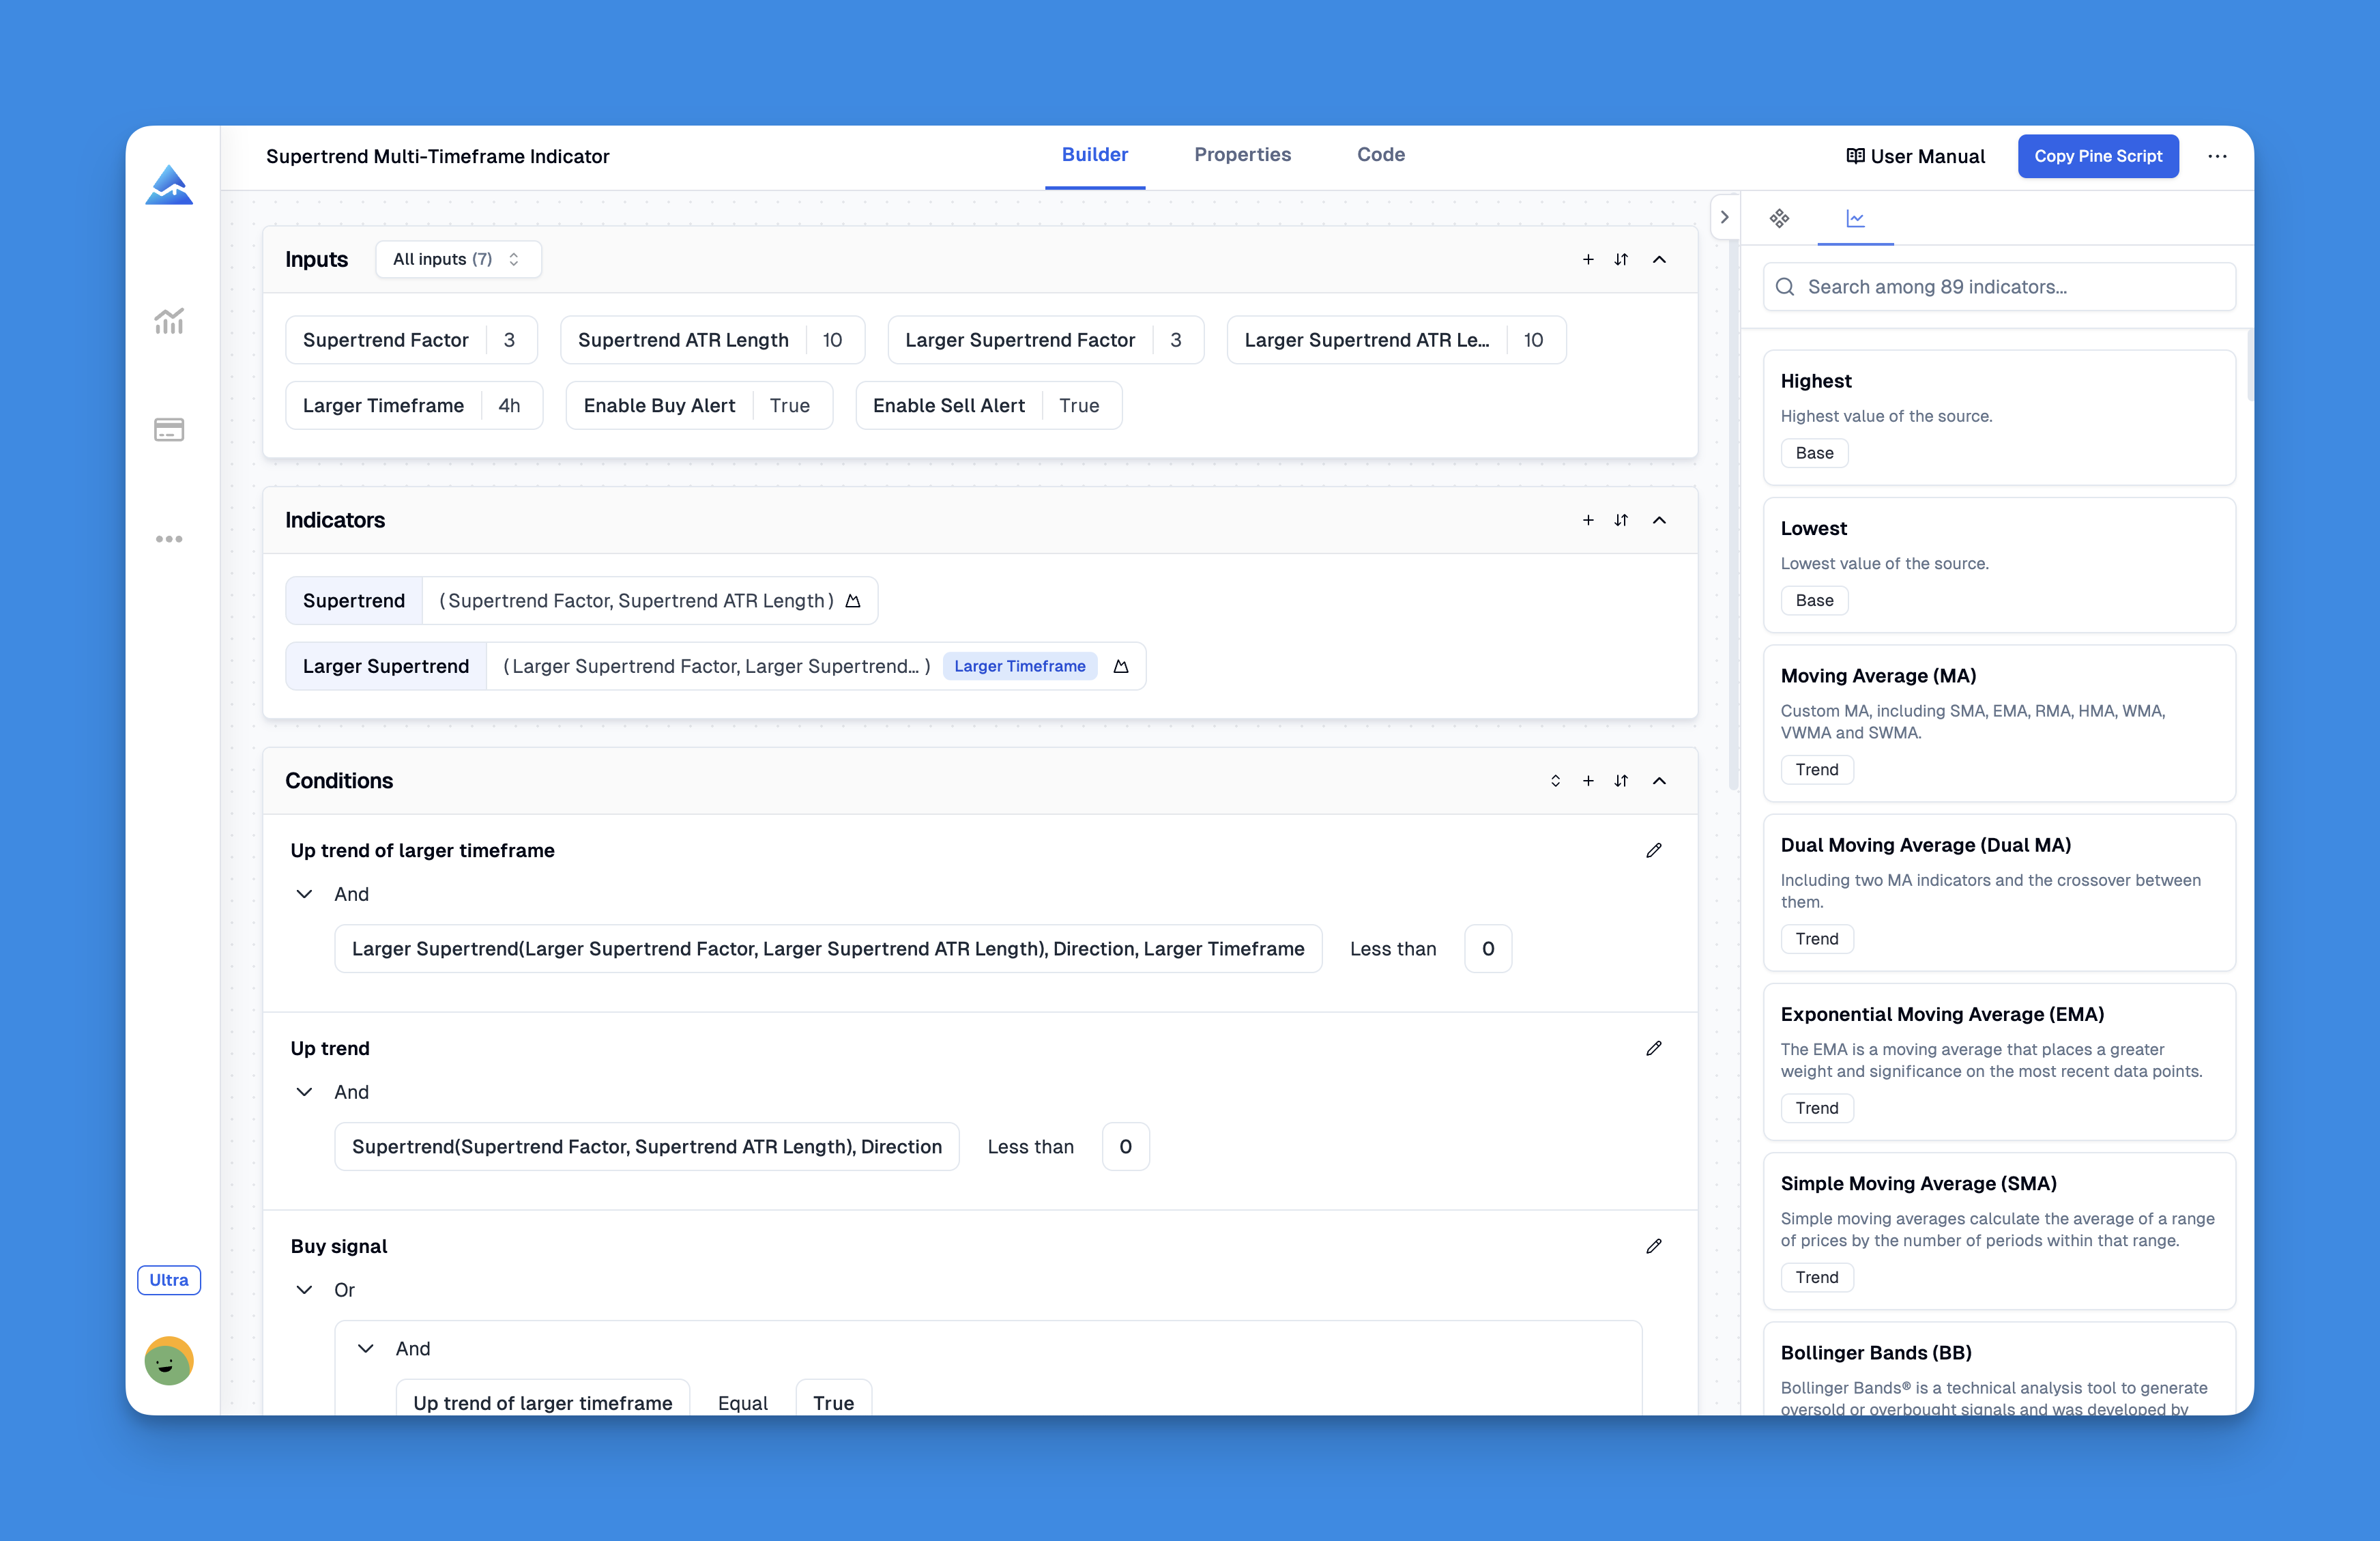
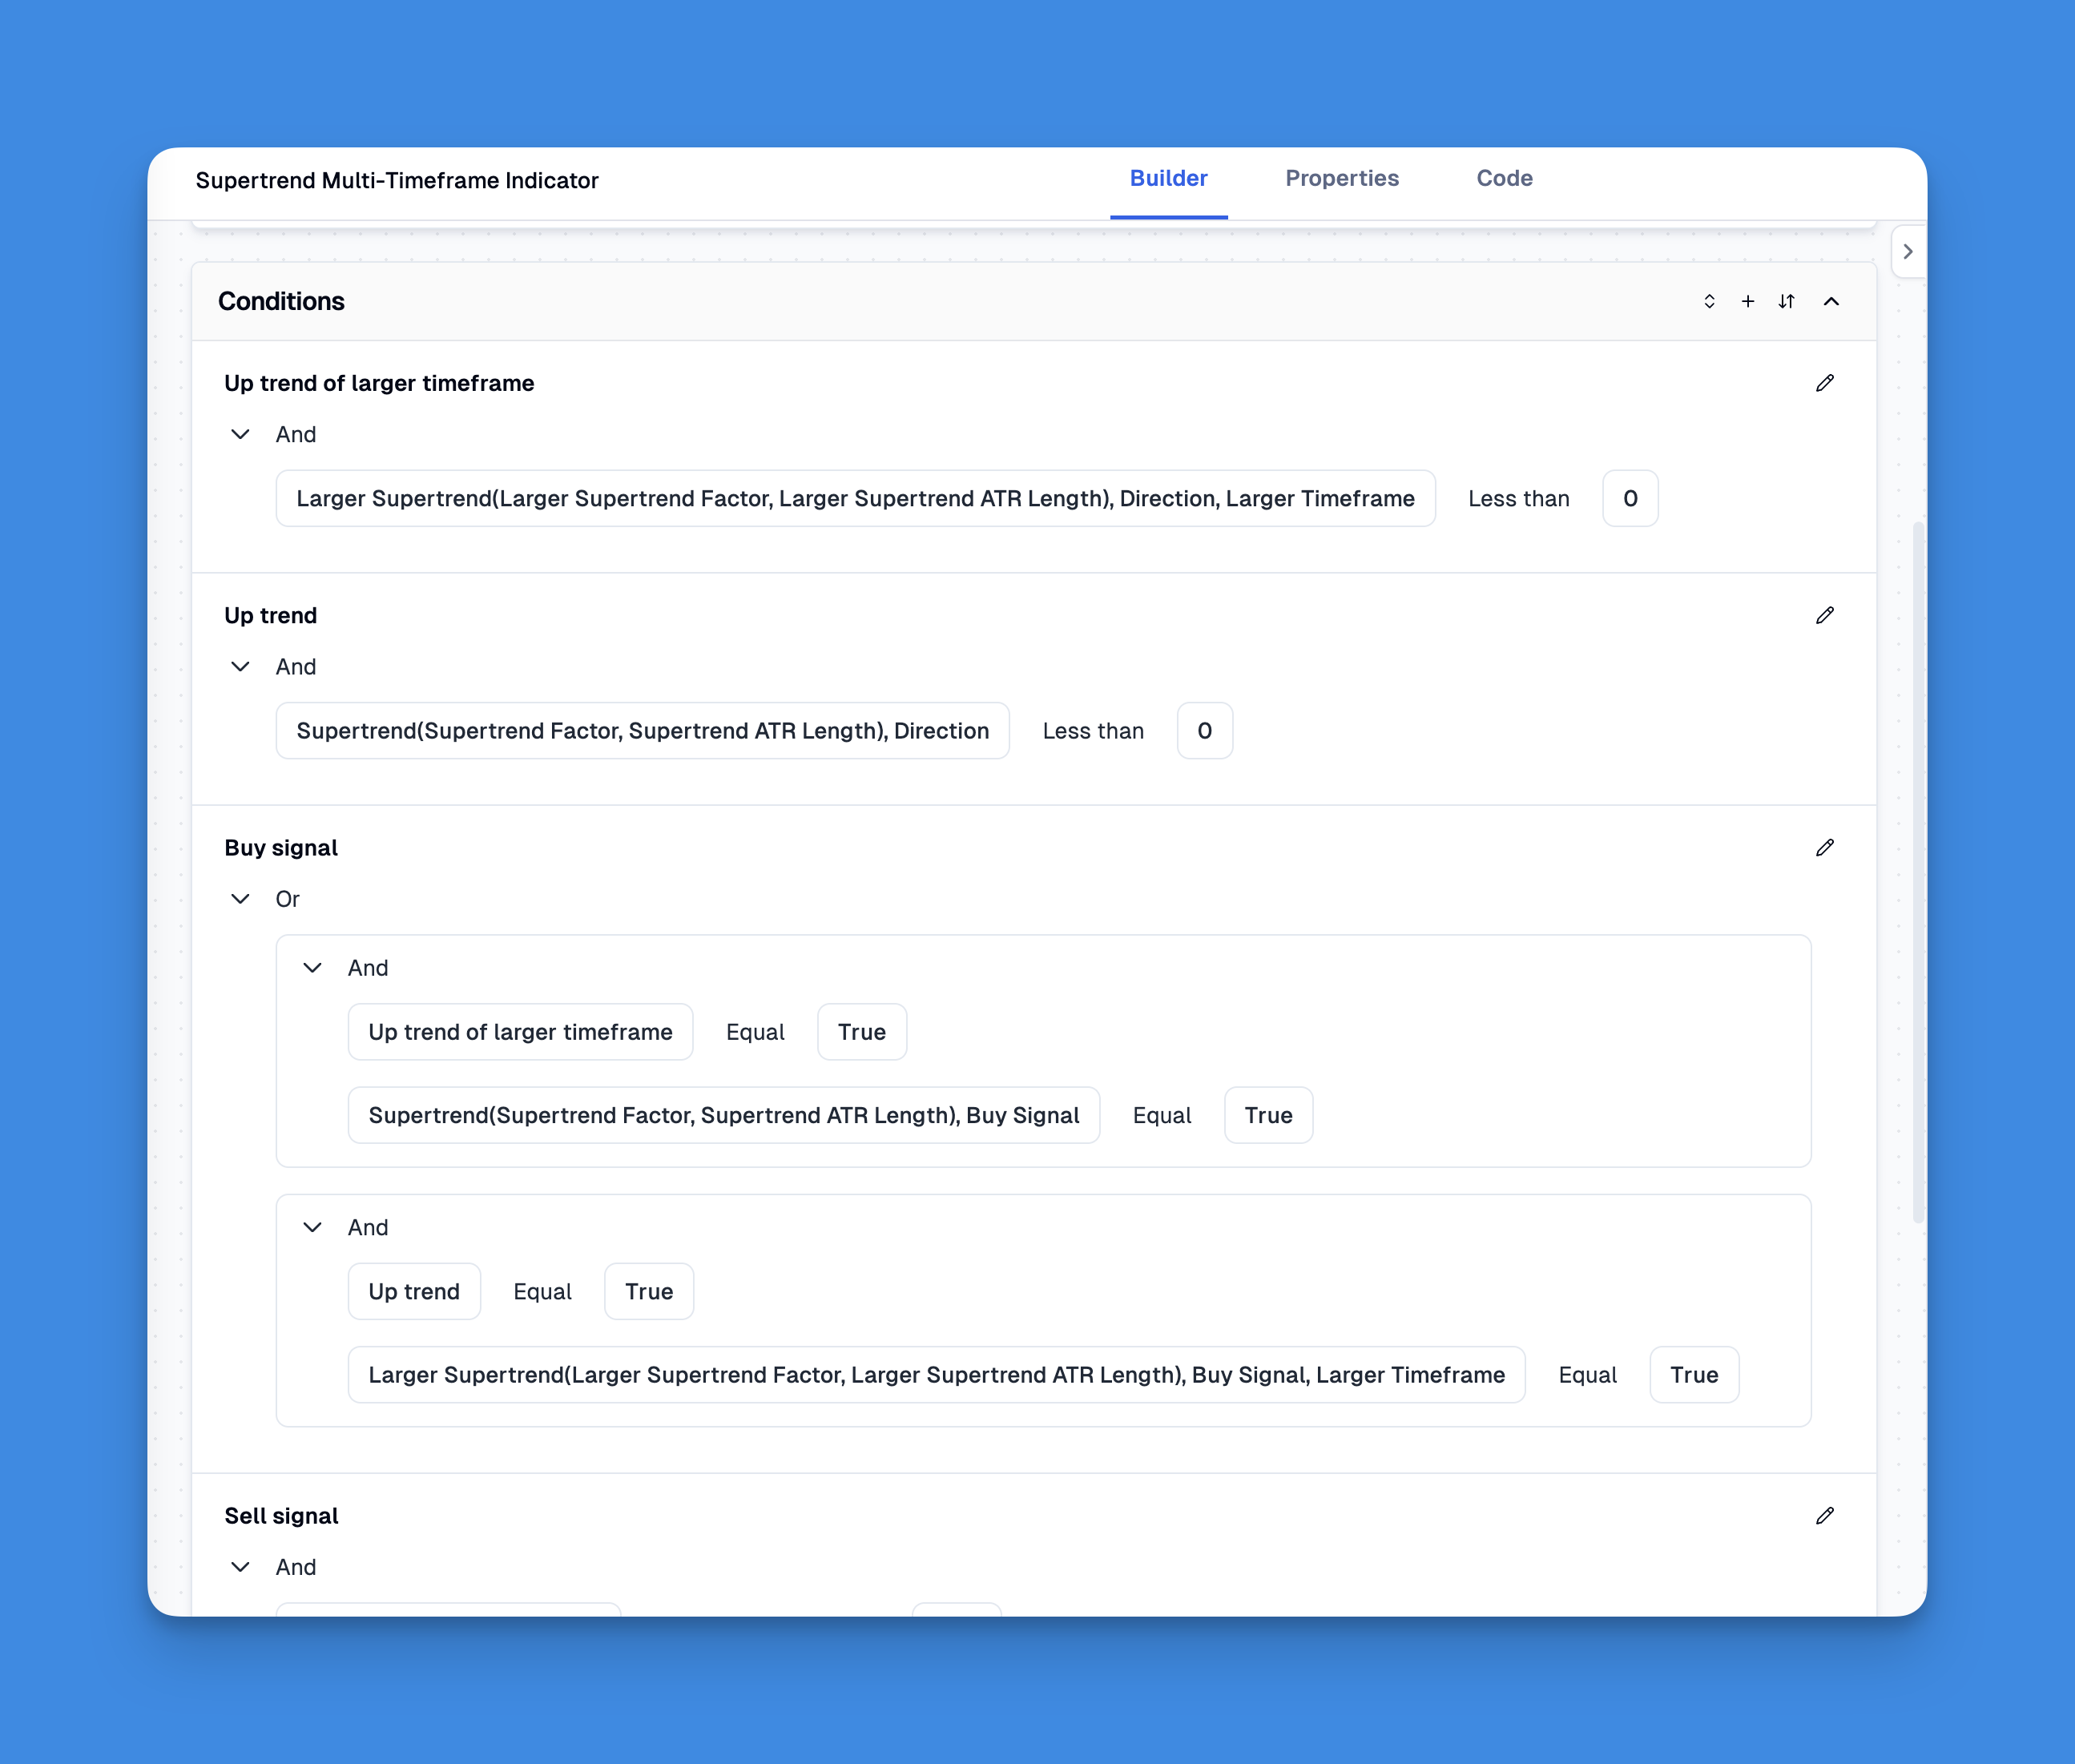
Traditional indicator creation typically requires knowledge of Pine Script, TradingView's proprietary programming language. This technical barrier has forced many traders to either limit themselves to pre-existing indicators or hire expensive freelancers. Pineify eliminates this obstacle entirely through its intuitive visual interface.
One of Pineify's most valuable features is its ability to bypass TradingView's indicator limitations. While TradingView restricts the number of indicators you can add to charts based on your subscription plan, Pineify allows you to add unlimited technical indicators on a single chart, even with TradingView's free plan. This capability enables comprehensive multi-indicator analysis without upgrading to premium subscriptions.
Website: Pineify
Click here to view all the features of Pineify.Key Indicators for Trading Success
1. Relative Strength Index (RSI)
The RSI is a crucial indicator for identifying overbought or oversold conditions, which can signal potential price reversals. It measures the magnitude of recent price changes to help traders spot buying or selling opportunities.
2. Moving Average Convergence Divergence (MACD)
The MACD indicator is versatile and helps traders identify potential buy and sell signals by illustrating the relationship between two moving averages of a security’s price.
3. Bollinger Bands
Bollinger Bands provide valuable insights into market volatility and potential price breakouts. They consist of a moving average and two standard deviations plotted above and below it.
4. Volume Profile HD
This indicator is essential for identifying key support and resistance levels by displaying the volume traded at specific price levels.
How to Use Multiple Indicators Together
Using multiple indicators together can provide a more comprehensive analysis of the market. Here are some tips for combining indicators effectively:
- Combine Trend and Momentum Indicators: Pair indicators like MACD with RSI to identify both trend reversals and overbought/oversold conditions.
- Use Volume Analysis: Incorporate Volume Profile HD to understand market structure and identify high-probability support and resistance levels.
- Monitor Volatility: Use Bollinger Bands to gauge market volatility and anticipate potential breakouts.
Conclusion
Incorporating these top TradingView indicators into your trading strategy can significantly enhance your market analysis and decision-making. Whether you are a novice or a seasoned trader, leveraging these tools can provide you with objective insights and high-probability trade signals.