Commodity Channel Index (CCI) Pine Script Guide
The Commodity Channel Index (CCI) is a versatile technical analysis tool that traders use to evaluate price trends and identify potential entry and exit points in various markets, including commodities, stocks, and forex. This guide will delve into the CCI's definition, usage, advantages, trading strategies, limitations, and provide insights into its implementation using Pine Script.
What is the CCI?
The Commodity Channel Index (CCI) is a momentum-based oscillator developed by Donald Lambert in 1980. It measures the current price level relative to an average price level over a specified period. The CCI oscillates above and below zero, providing insights into whether an asset is overbought or oversold.
- High CCI Values: When the CCI is above +100, it indicates that the asset is trading significantly above its historical average price, suggesting a potential overbought condition.
- Low CCI Values: Conversely, when the CCI falls below -100, it signals that the asset may be oversold, trading well below its historical average.
The CCI's unbounded nature allows it to extend beyond these levels, making it essential for traders to consider historical extremes specific to each asset when interpreting signals.
How to Use CCI Indicator

Using the CCI indicator effectively involves understanding its signals and applying them in various market conditions:
- Identifying Overbought and Oversold Conditions: Traders typically look for CCI values above +100 to indicate overbought conditions and values below -100 for oversold conditions. A reversal from these extremes can signal potential trading opportunities.
- Trend Confirmation: The CCI can also confirm trends. A rising CCI indicates strengthening bullish momentum, while a declining CCI suggests bearish momentum. Traders often use this information in conjunction with other indicators for more reliable signals.
- Divergence Analysis: Divergence between the CCI and price action can indicate potential reversals. For example, if prices are making new highs while the CCI fails to reach new highs, it may suggest weakening momentum.
What is TradingView and Pineify?
TradingView is a popular web-based platform that provides advanced charting tools and social networking for traders and investors. It allows users to analyze financial markets through interactive charts, access a wide range of technical indicators, and share trading ideas with a global community.
Pineify complements TradingView by offering a user-friendly tool that enables traders to create and manage their own custom indicators and strategies without requiring any coding skills. With Pineify, users can easily generate complex scripts, add unlimited indicators to their charts, and backtest their strategies efficiently.

Website: Pineify
Click here to view all the features of Pineify.Adding the CCI to TradingView Chart Without Coding
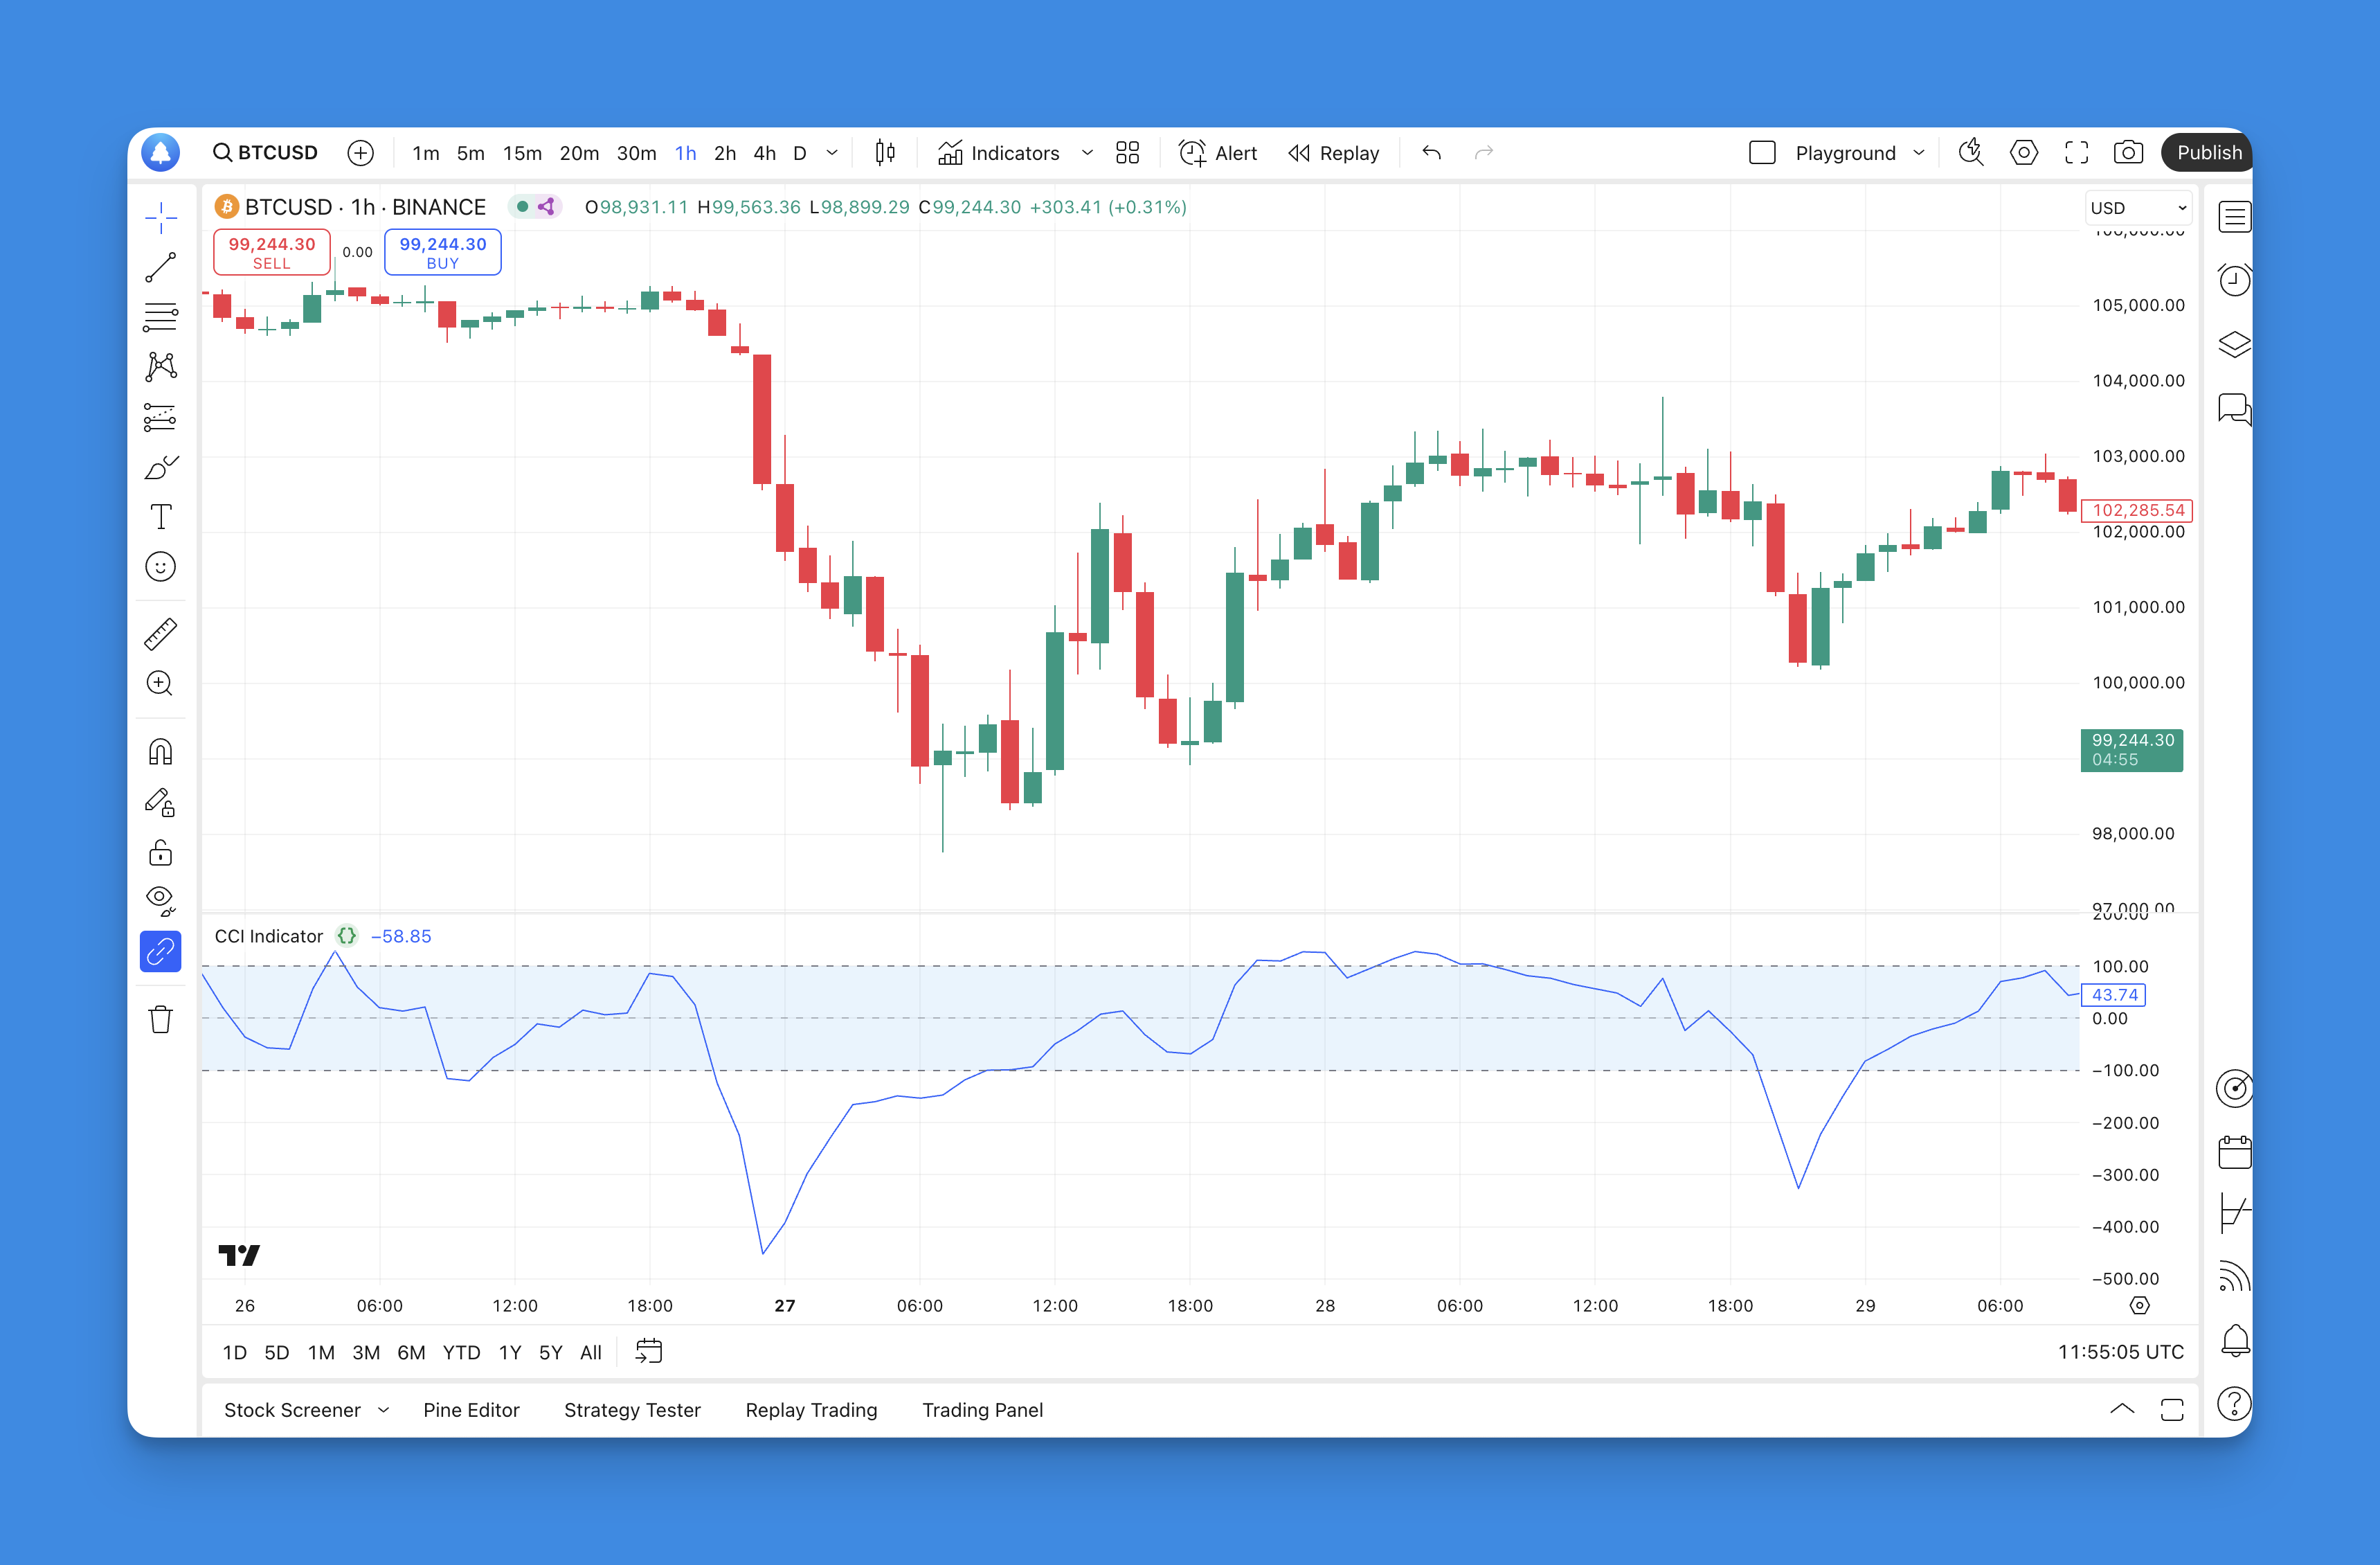
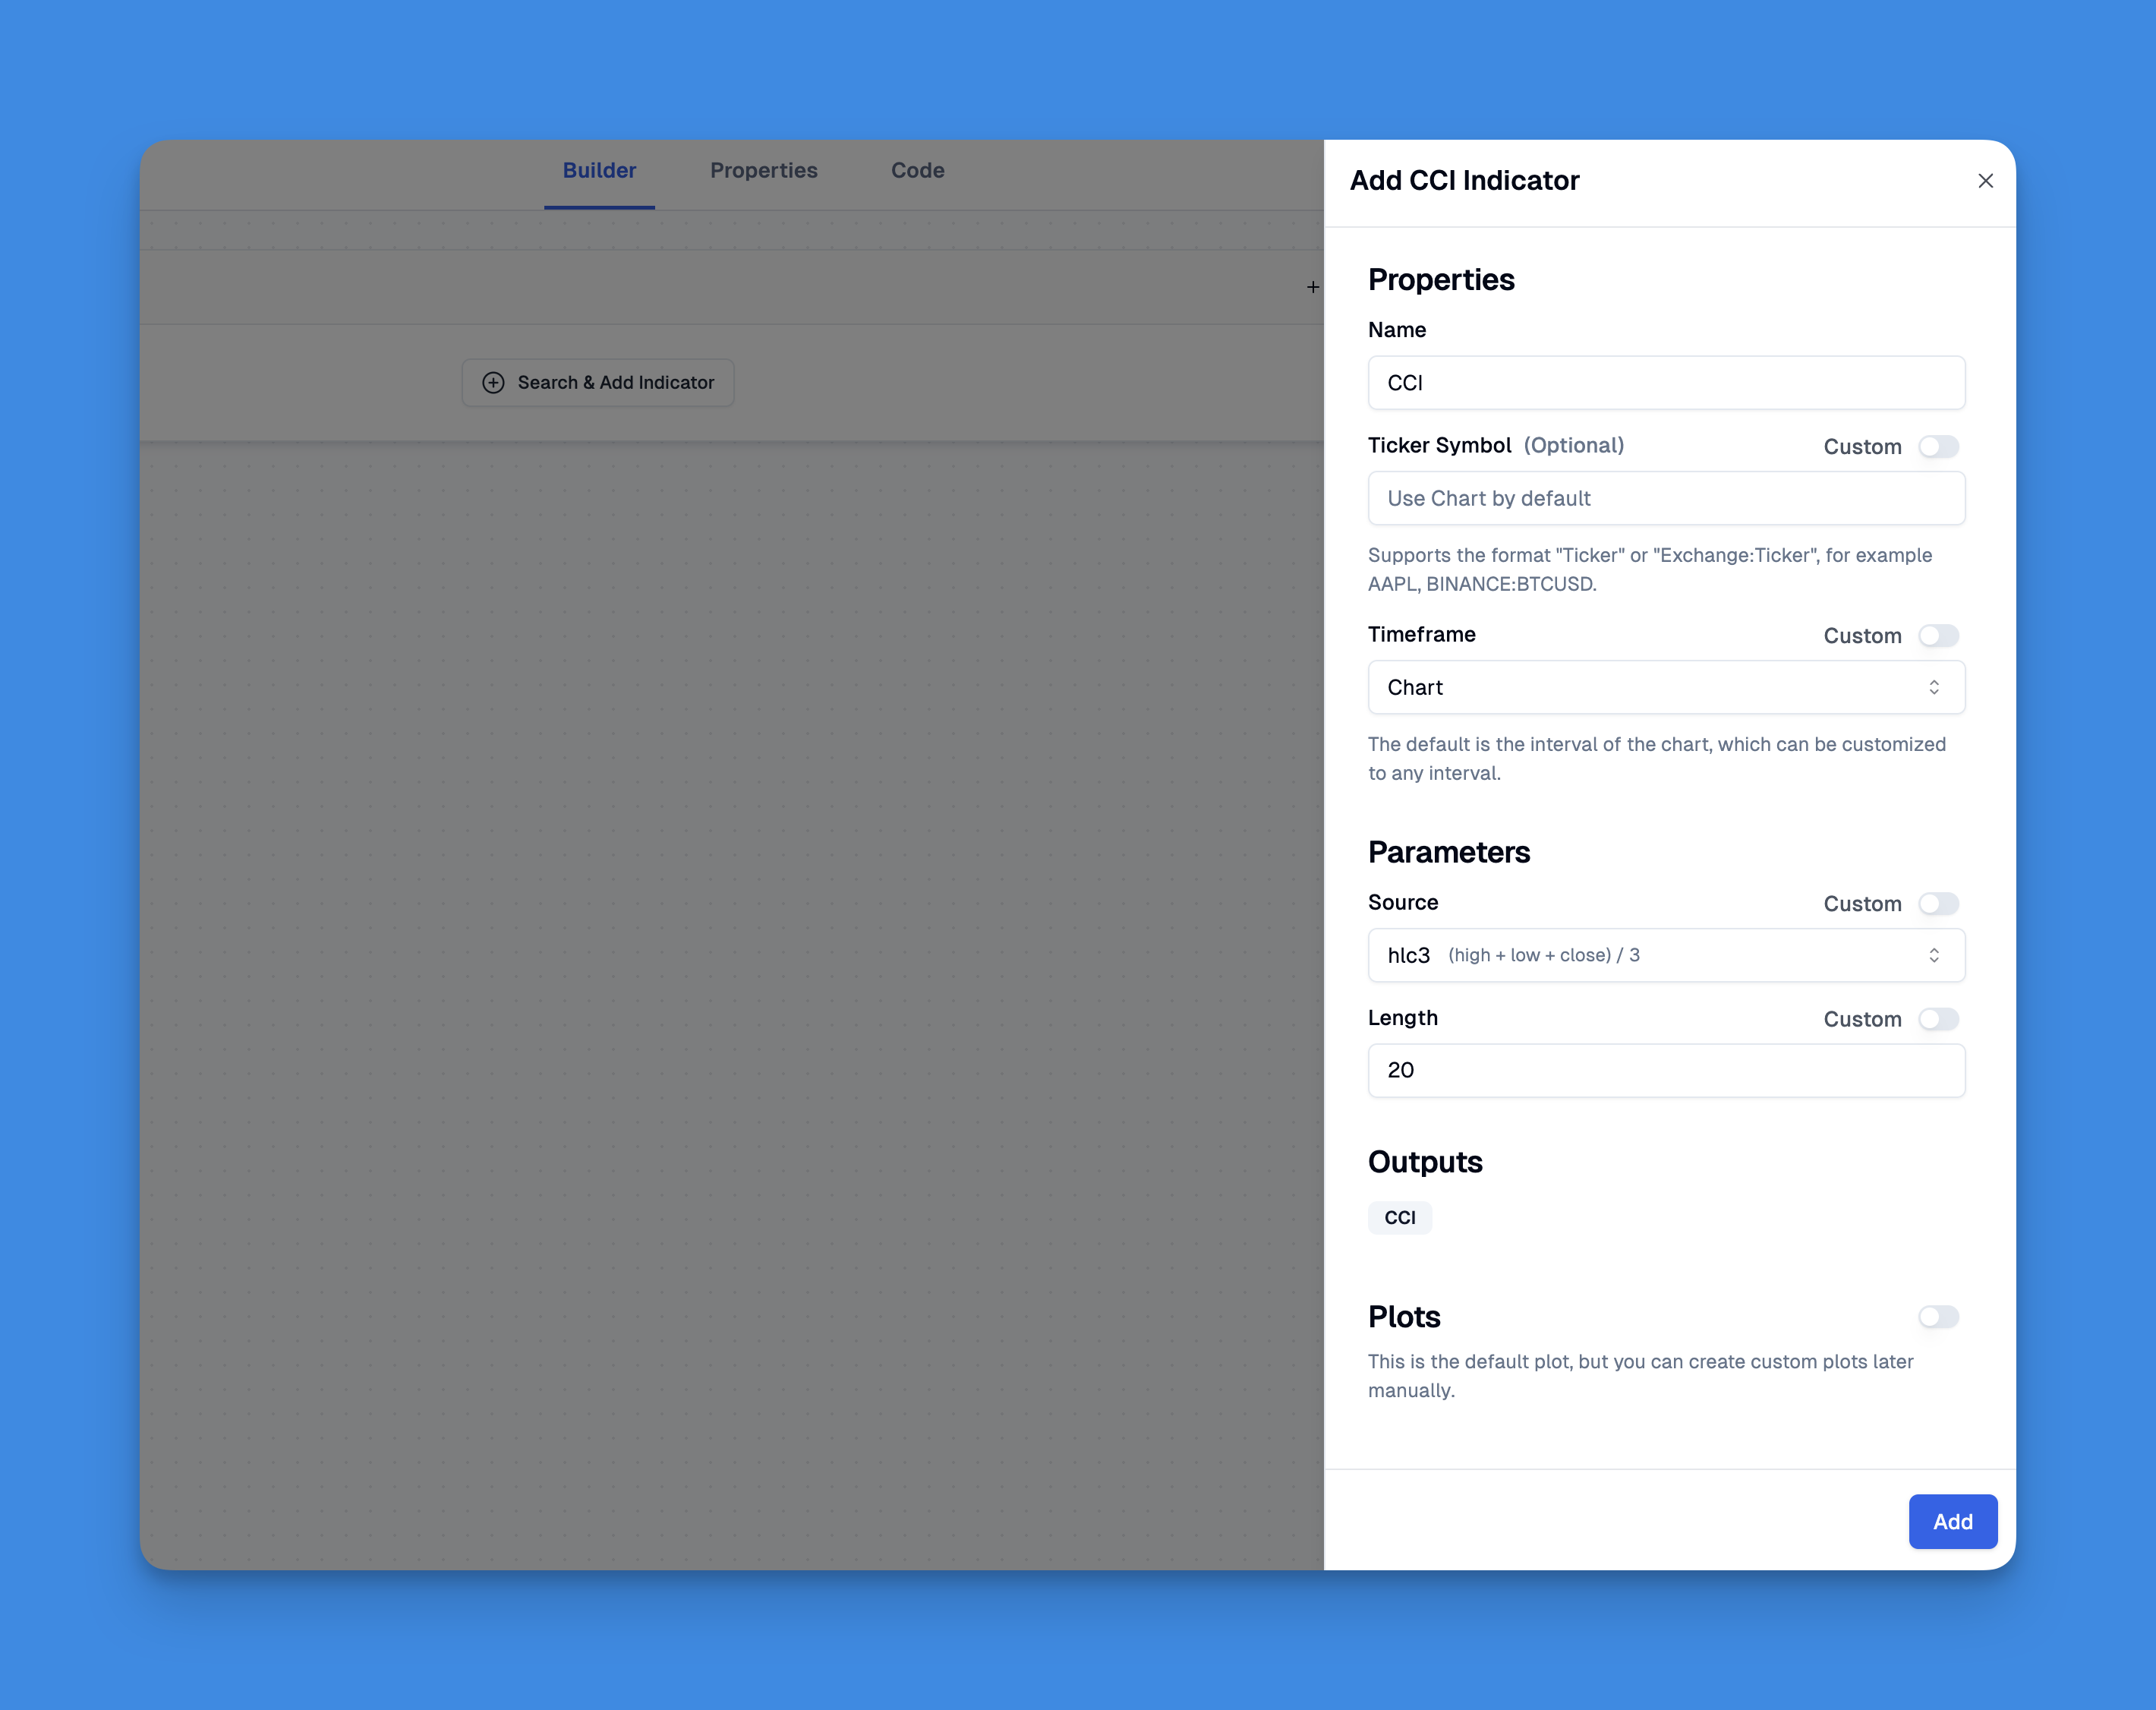
To add the Commodity Channel Index (CCI) to your TradingView chart without coding, Pineify offers an intuitive solution. Users can leverage Pineify's visual tools to quickly create and customize their CCI indicator. The platform allows you to bypass TradingView’s standard limitations on the number of indicators you can add, enabling you to plot as many as needed for comprehensive analysis.
Simply select the CCI from the available indicators in Pineify, adjust the settings according to your trading strategy, and apply it to your chart. This streamlined process saves time and eliminates the need for programming knowledge, making it accessible for traders at any skill level. With Pineify's powerful condition editor, you can also combine the CCI with other indicators for enhanced trading signals, ensuring you have a robust toolkit for market analysis.
Advantages of the CCI
The CCI offers several advantages for traders:
- Versatility: The CCI can be applied across various markets—stocks, commodities, forex—making it a flexible tool for different trading strategies.
- Trend Identification: It helps traders identify emerging trends early by measuring price deviations from an average.
- Overbought/Oversold Signals: The ability to signal overbought or oversold conditions allows traders to make informed decisions about entering or exiting positions.
- Divergence Detection: The indicator can highlight divergences that may precede significant price reversals, providing valuable insights into market behavior.
CCI in Trading Strategies
Incorporating the CCI into trading strategies can enhance decision-making:
- Momentum Trading Strategy: Traders may enter long positions when the CCI crosses above +100 and short positions when it drops below -100. This straightforward approach capitalizes on momentum shifts.
- Divergence Strategy: By analyzing divergences between price action and the CCI, traders can identify potential reversal points. For instance, if prices are making new highs but the CCI is not, this divergence could indicate a weakening trend.
- Combined Indicator Strategy: Using the CCI alongside other indicators (like moving averages or RSI) can provide additional confirmation of trade signals and improve overall strategy effectiveness.
Limitations of the CCI
While useful, the CCI has its limitations:
- False Signals: In volatile markets or during strong trends, the CCI can generate false signals. Traders should be cautious when relying solely on this indicator without additional confirmation.
- Interpretation Subjectivity: The interpretation of overbought or oversold levels can vary based on market conditions and individual trader experience. Historical context is crucial for accurate analysis.
- Lagging Indicator: As a lagging indicator, the CCI may not always provide timely signals for rapid market movements. Traders should consider combining it with leading indicators for better timing.
Conclusion
The Commodity Channel Index (CCI) is a powerful tool for traders seeking to understand market dynamics through momentum analysis. By identifying overbought and oversold conditions, confirming trends, and detecting divergences, the CCI provides valuable insights that enhance trading strategies across various markets.
Incorporating the CCI into your trading toolkit can improve decision-making and potentially lead to more successful trades. However, it's essential to recognize its limitations and use it in conjunction with other indicators for optimal results.