Multi-Timeframe SuperTrend Indicator for TradingView Pine Script
You know that feeling when you're staring at your 5-minute chart, convinced you've found the perfect trade setup, only to zoom out and realize the daily trend is completely against you? I've been there more times than I'd like to admit. That's exactly why I fell in love with this multi-timeframe SuperTrend indicator.
Think about it - how many times have you caught a "perfect" breakout on the 15-minute chart, only to watch it get crushed by resistance that was obvious on the 4-hour timeframe? This indicator fixes that problem by showing you both perspectives simultaneously. It's like having trading glasses that let you see the forest AND the trees at the same time.
Want to grab the code? Click below to get it for free.
Get the Multi-Timeframe SuperTrend Indicator
Why Multi-Timeframe Analysis Changes Everything

Here's the thing most traders don't realize: single timeframe analysis is like trying to navigate with only one eye open. You might get there eventually, but you're missing crucial depth perception.
The Classic SuperTrend Problem:
Regular SuperTrend indicators work great on trending markets, but they get whipsawed in choppy conditions. When you add a higher timeframe perspective, suddenly those false signals become much more obvious. If your 15-minute SuperTrend is bullish but the 4-hour is bearish, that's your cue to either wait or look for shorts instead.
How This Multi-Timeframe Version Works:
This isn't just two SuperTrend indicators slapped together. The algorithm intelligently combines signals from your current timeframe with a higher timeframe of your choice. When both timeframes align, you get clear directional signals. When they conflict, the indicator helps you see where the real momentum lies.
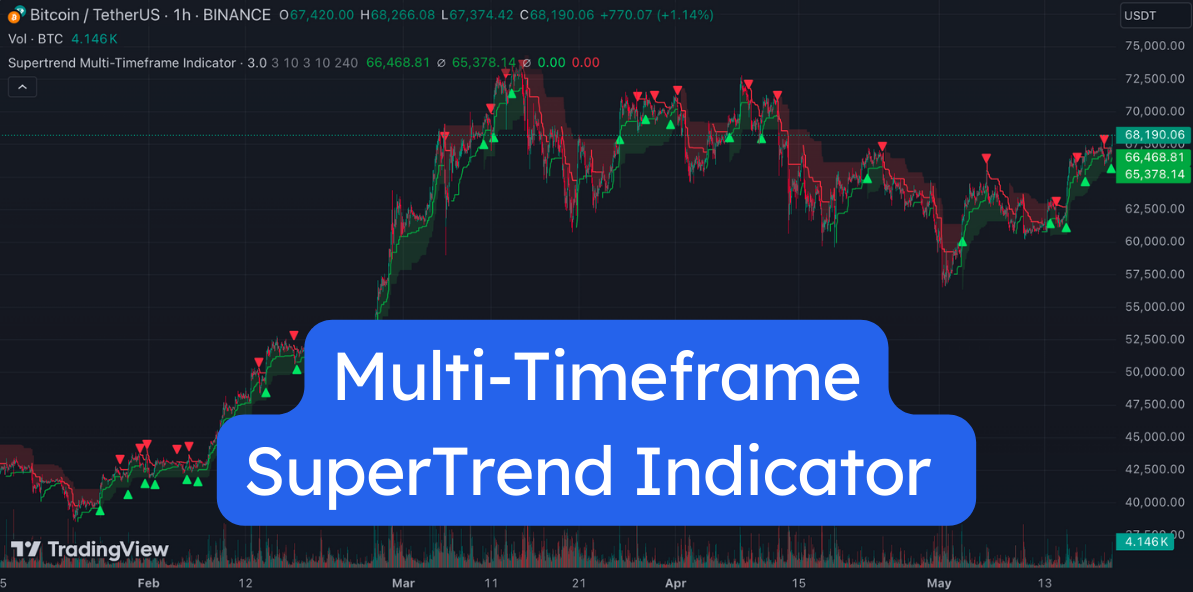
The visual design is intentionally simple:
- Green zones = both timeframes agree it's time to buy
- Red zones = both timeframes suggest selling pressure
- Mixed signals = stay on the sidelines or trade with extreme caution
Understanding the SuperTrend Foundation
Before we dive deeper, let's talk about what makes SuperTrend such a reliable trend-following tool. Unlike moving averages that can lag behind price action, SuperTrend uses Average True Range (ATR) to create dynamic support and resistance levels that adapt to market volatility.
The beauty of SuperTrend lies in its simplicity:
- During uptrends: The SuperTrend line stays below price, acting as dynamic support
- During downtrends: It moves above price, creating dynamic resistance
- Signal generation: When price crosses the SuperTrend line, it signals a potential trend change
But here's where it gets interesting with multi-timeframe analysis. When you combine two different timeframes, you're essentially getting a second opinion on every trade setup.
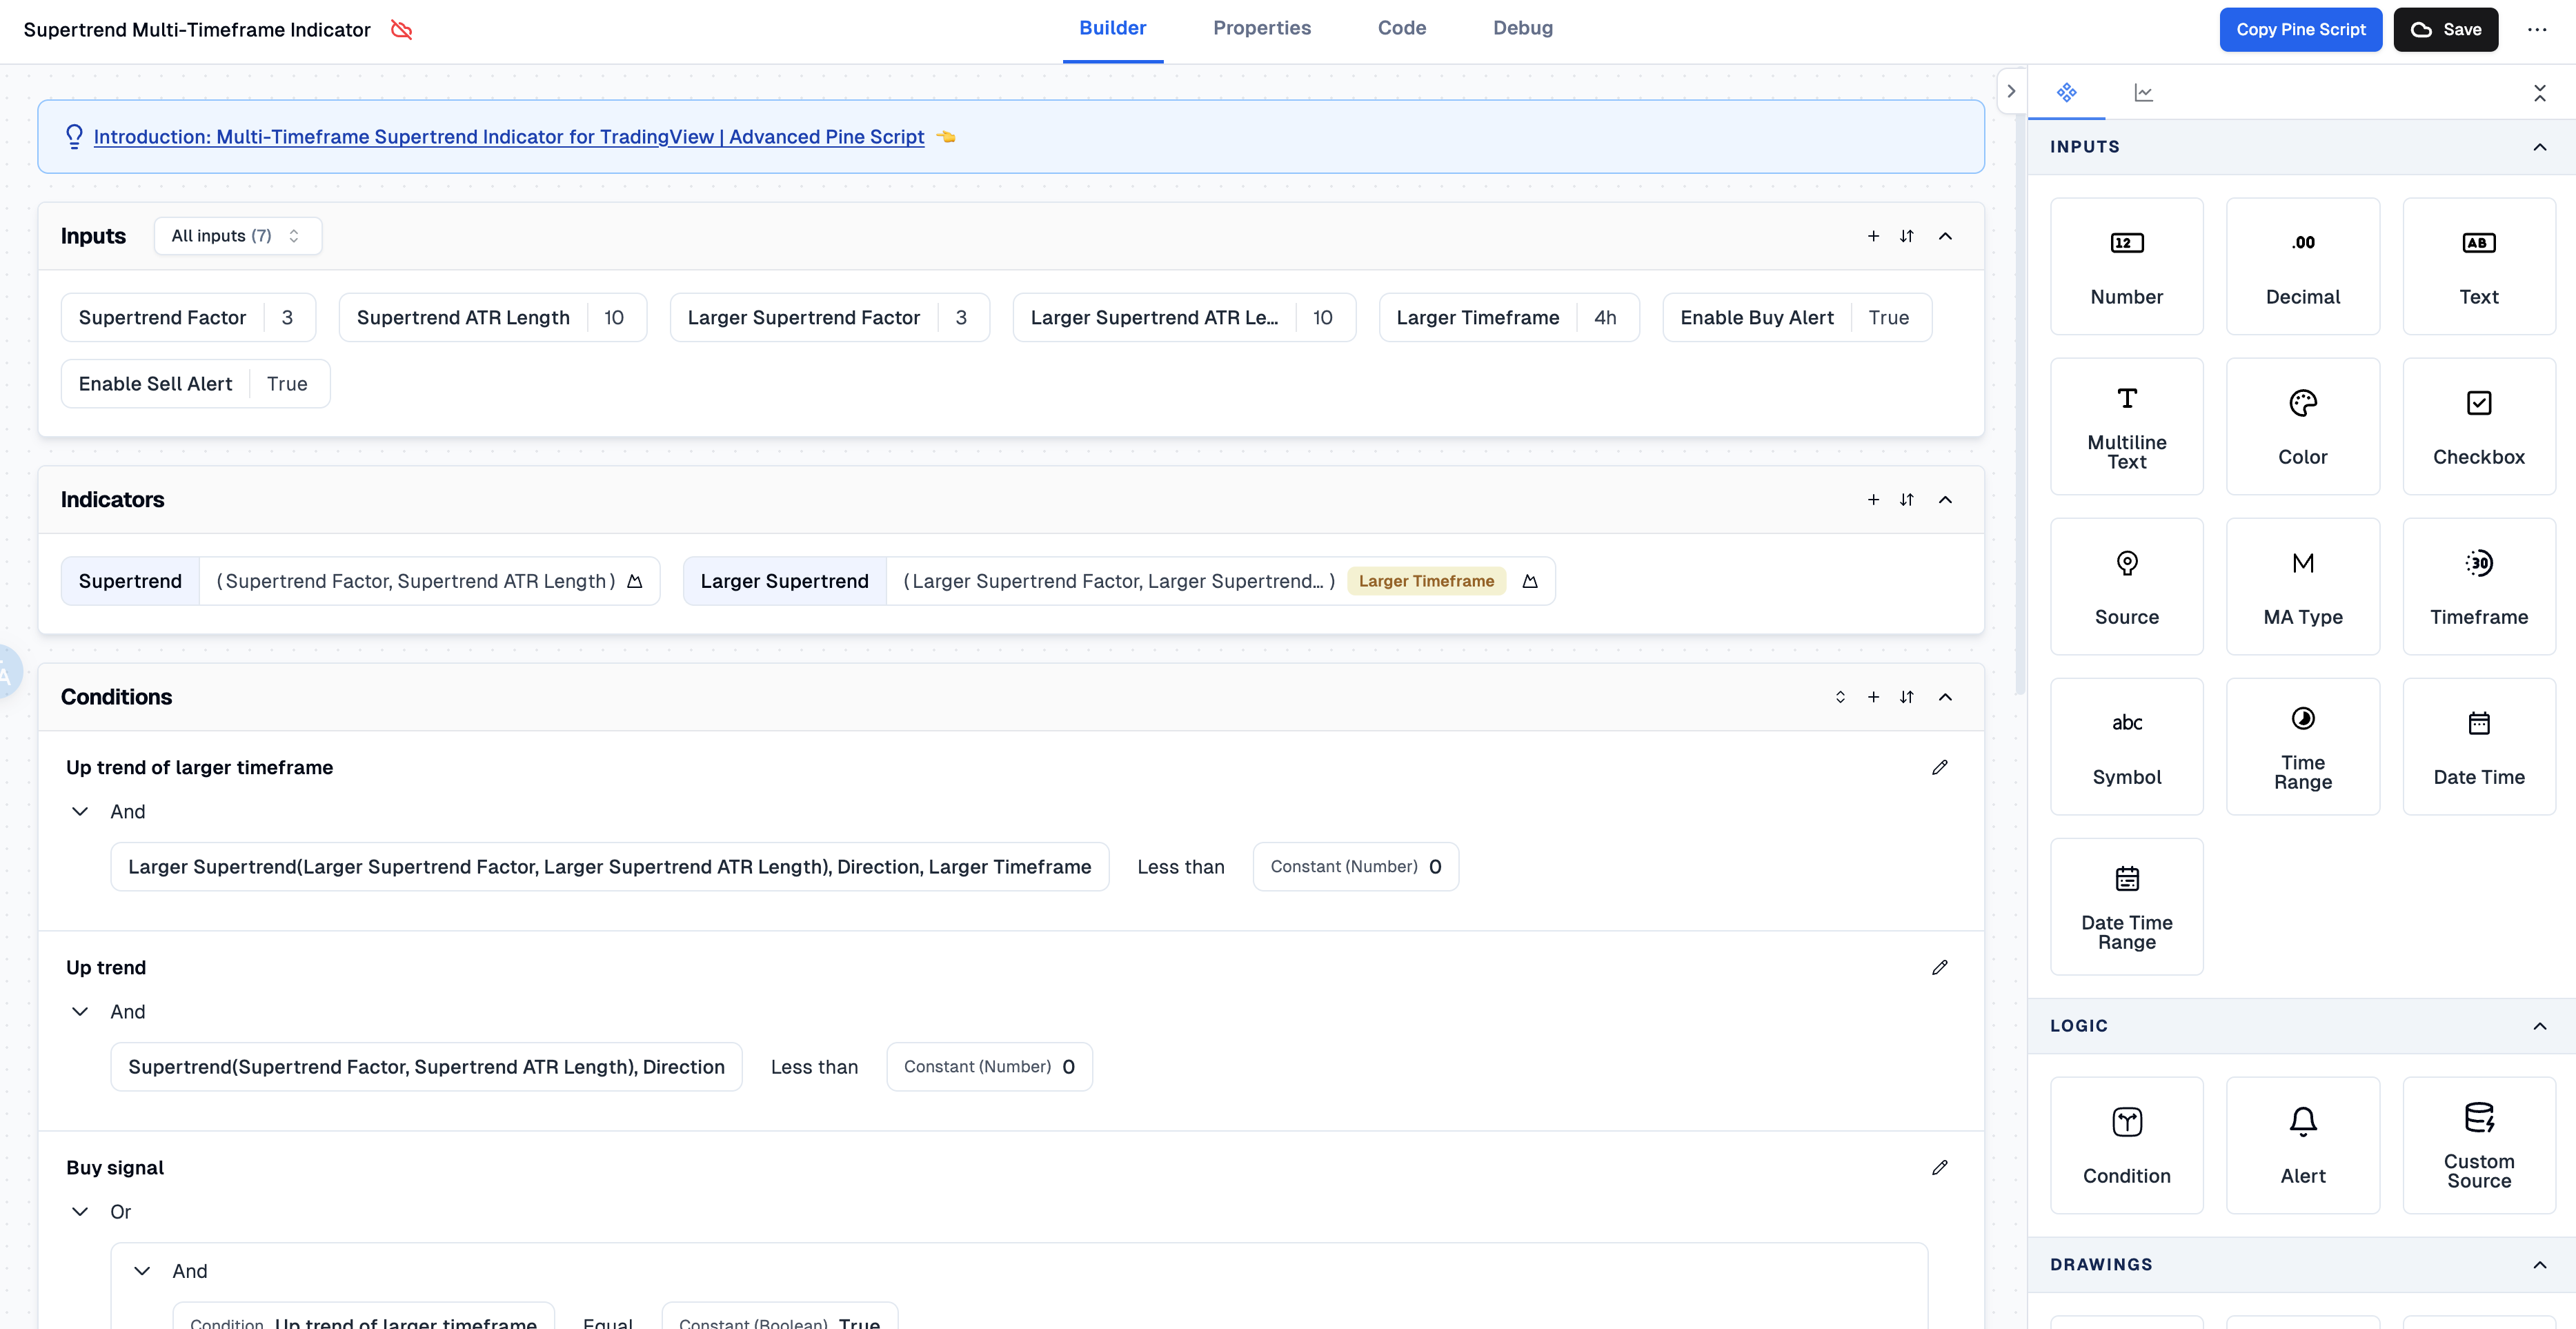
Setting Up Your Multi-Timeframe SuperTrend
Getting this indicator working properly requires a bit more thought than your typical Pine Script indicator setup. Here's how I approach it:
Step 1: Choose Your Timeframes Wisely
The relationship between your timeframes matters. I typically use a 4:1 or 6:1 ratio. For example:
- 5-minute chart with 20-minute higher timeframe
- 15-minute chart with 1-hour higher timeframe
- 1-hour chart with 4-hour higher timeframe
Step 2: Adjust the SuperTrend Parameters
The default settings work okay, but you'll want to tweak them based on your trading style:
- Factor: Controls sensitivity (2.0-3.0 works well for most assets)
- ATR Length: How many periods to calculate volatility (10-14 is standard)
- Higher Timeframe: Your chosen bigger picture timeframe
Step 3: Fine-Tune for Your Market
Different markets have different personalities. Crypto moves faster than forex, stocks behave differently than commodities. Spend time backtesting with your specific assets to find the sweet spot.
Advanced Trading Strategies with Multi-Timeframe SuperTrend
Once you've got the basics down, here are some advanced techniques I've developed over the years:
The Confluence Setup:
Wait for three things to align:
- Higher timeframe SuperTrend shows clear direction
- Current timeframe SuperTrend confirms the signal
- Price action supports the move (breakout, reversal pattern, etc.)
This triple confirmation dramatically improves your win rate, though you'll take fewer trades.
The Divergence Play:
Sometimes the multi-timeframe SuperTrend shows conflicting signals. Instead of avoiding these setups, you can use them strategically:
- If the higher timeframe is bullish but current timeframe turns bearish, look for short-term scalping opportunities
- When the current timeframe is bullish but higher timeframe is bearish, be ready for quick exits
Risk Management Integration:
This is where ATR-based stop losses become crucial. Use the higher timeframe ATR to set your stop loss, giving the trade enough room to breathe while the current timeframe signal helps you time your entry.
Common Mistakes (That I've Made So You Don't Have To)
Mistake #1: Ignoring Market Context
Even the best multi-timeframe setup can fail during major news events or in extremely choppy conditions. Always check the economic calendar before placing trades.
Mistake #2: Over-Optimizing Parameters
I spent months tweaking every little setting, trying to create the "perfect" indicator. The truth is, robust settings that work across different market conditions are better than hyper-optimized parameters that fail when markets change.
Mistake #3: Trading Every Signal
Just because the indicator gives a signal doesn't mean you have to take it. Some of my best trading days are when I pass on mediocre setups and wait for the high-probability ones.
Combining with Other Indicators
While this multi-timeframe SuperTrend is powerful on its own, it works even better when combined with complementary tools:
Volume Analysis:
Use volume indicators to confirm your SuperTrend signals. Strong trends should be accompanied by increasing volume in the direction of the move.
Support and Resistance:
SuperTrend works beautifully when combined with key levels. When a SuperTrend signal aligns with a major support or resistance level, the probability of success increases significantly.
Momentum Oscillators:
Tools like RSI or MACD can help you time entries and exits more precisely, especially when the SuperTrend signals are conflicting between timeframes.
Real-World Performance and Expectations
Let's be honest about what this indicator can and can't do. In trending markets, it's fantastic - you'll catch most of the major moves with fewer false signals than single-timeframe approaches. In choppy, sideways markets, it struggles just like any other trend-following tool.
From my experience:
- Win rate: Typically 60-70% in trending conditions
- Risk-reward: Best when targeting 2:1 or better
- Drawdowns: Expect losing streaks during consolidation periods
The key is understanding that no indicator works in all market conditions. The multi-timeframe SuperTrend excels at keeping you on the right side of major trends while filtering out much of the noise that plagues single-timeframe analysis.
Wrapping It Up
If you're tired of getting whipsawed by false signals or missing the big picture while focusing on lower timeframes, this multi-timeframe SuperTrend indicator might be exactly what you need. It's not going to turn you into a trading god overnight, but it will help you see market structure more clearly and make better-informed decisions.
The beauty of modern tools like this is that you don't need to be a coding expert to use sophisticated analysis. Whether you're building your own indicators or using pre-built solutions, the key is understanding the logic behind the signals and using them as part of a broader trading strategy.
Remember, successful trading isn't about finding the perfect indicator - it's about consistently applying proven methods with proper risk management. This multi-timeframe SuperTrend gives you a solid foundation for both.
Pineify: TradingView Pine Script Indicator & Strategy Generator
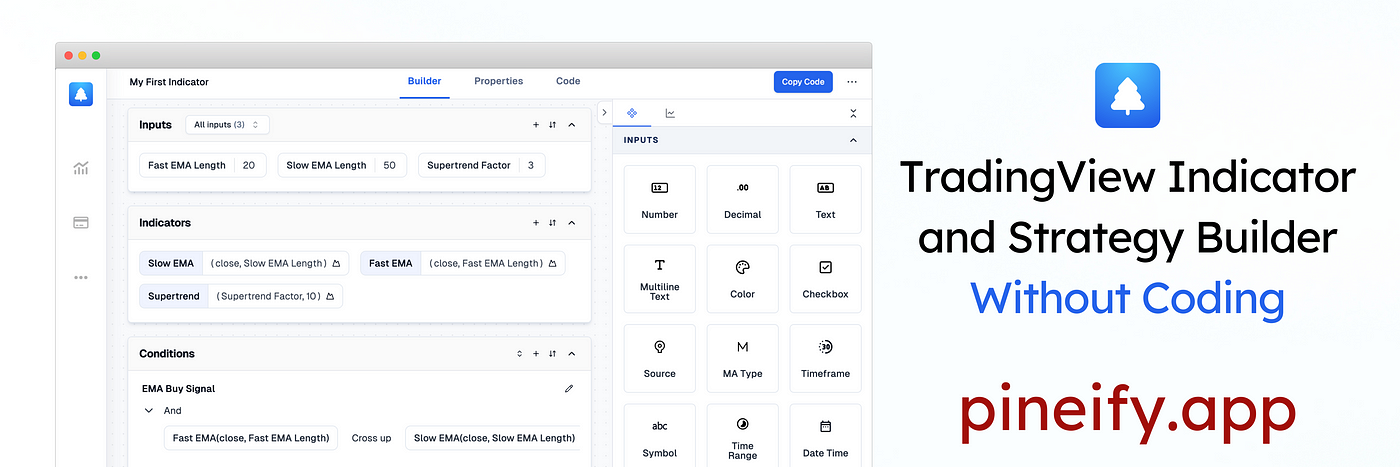
With Pineify, you can efficiently generate buy/sell indicators and custom strategies for TradingView Pine Script code creator. The best indicator and strategy backtest builder.
And you can easily create your own indicators and strategies without any coding skills, saving both time and money on freelancers.
TradingView Indicator & Strategy Generator: https://pineify.app/