SMA Pine Script: Plot Moving Averages Easily
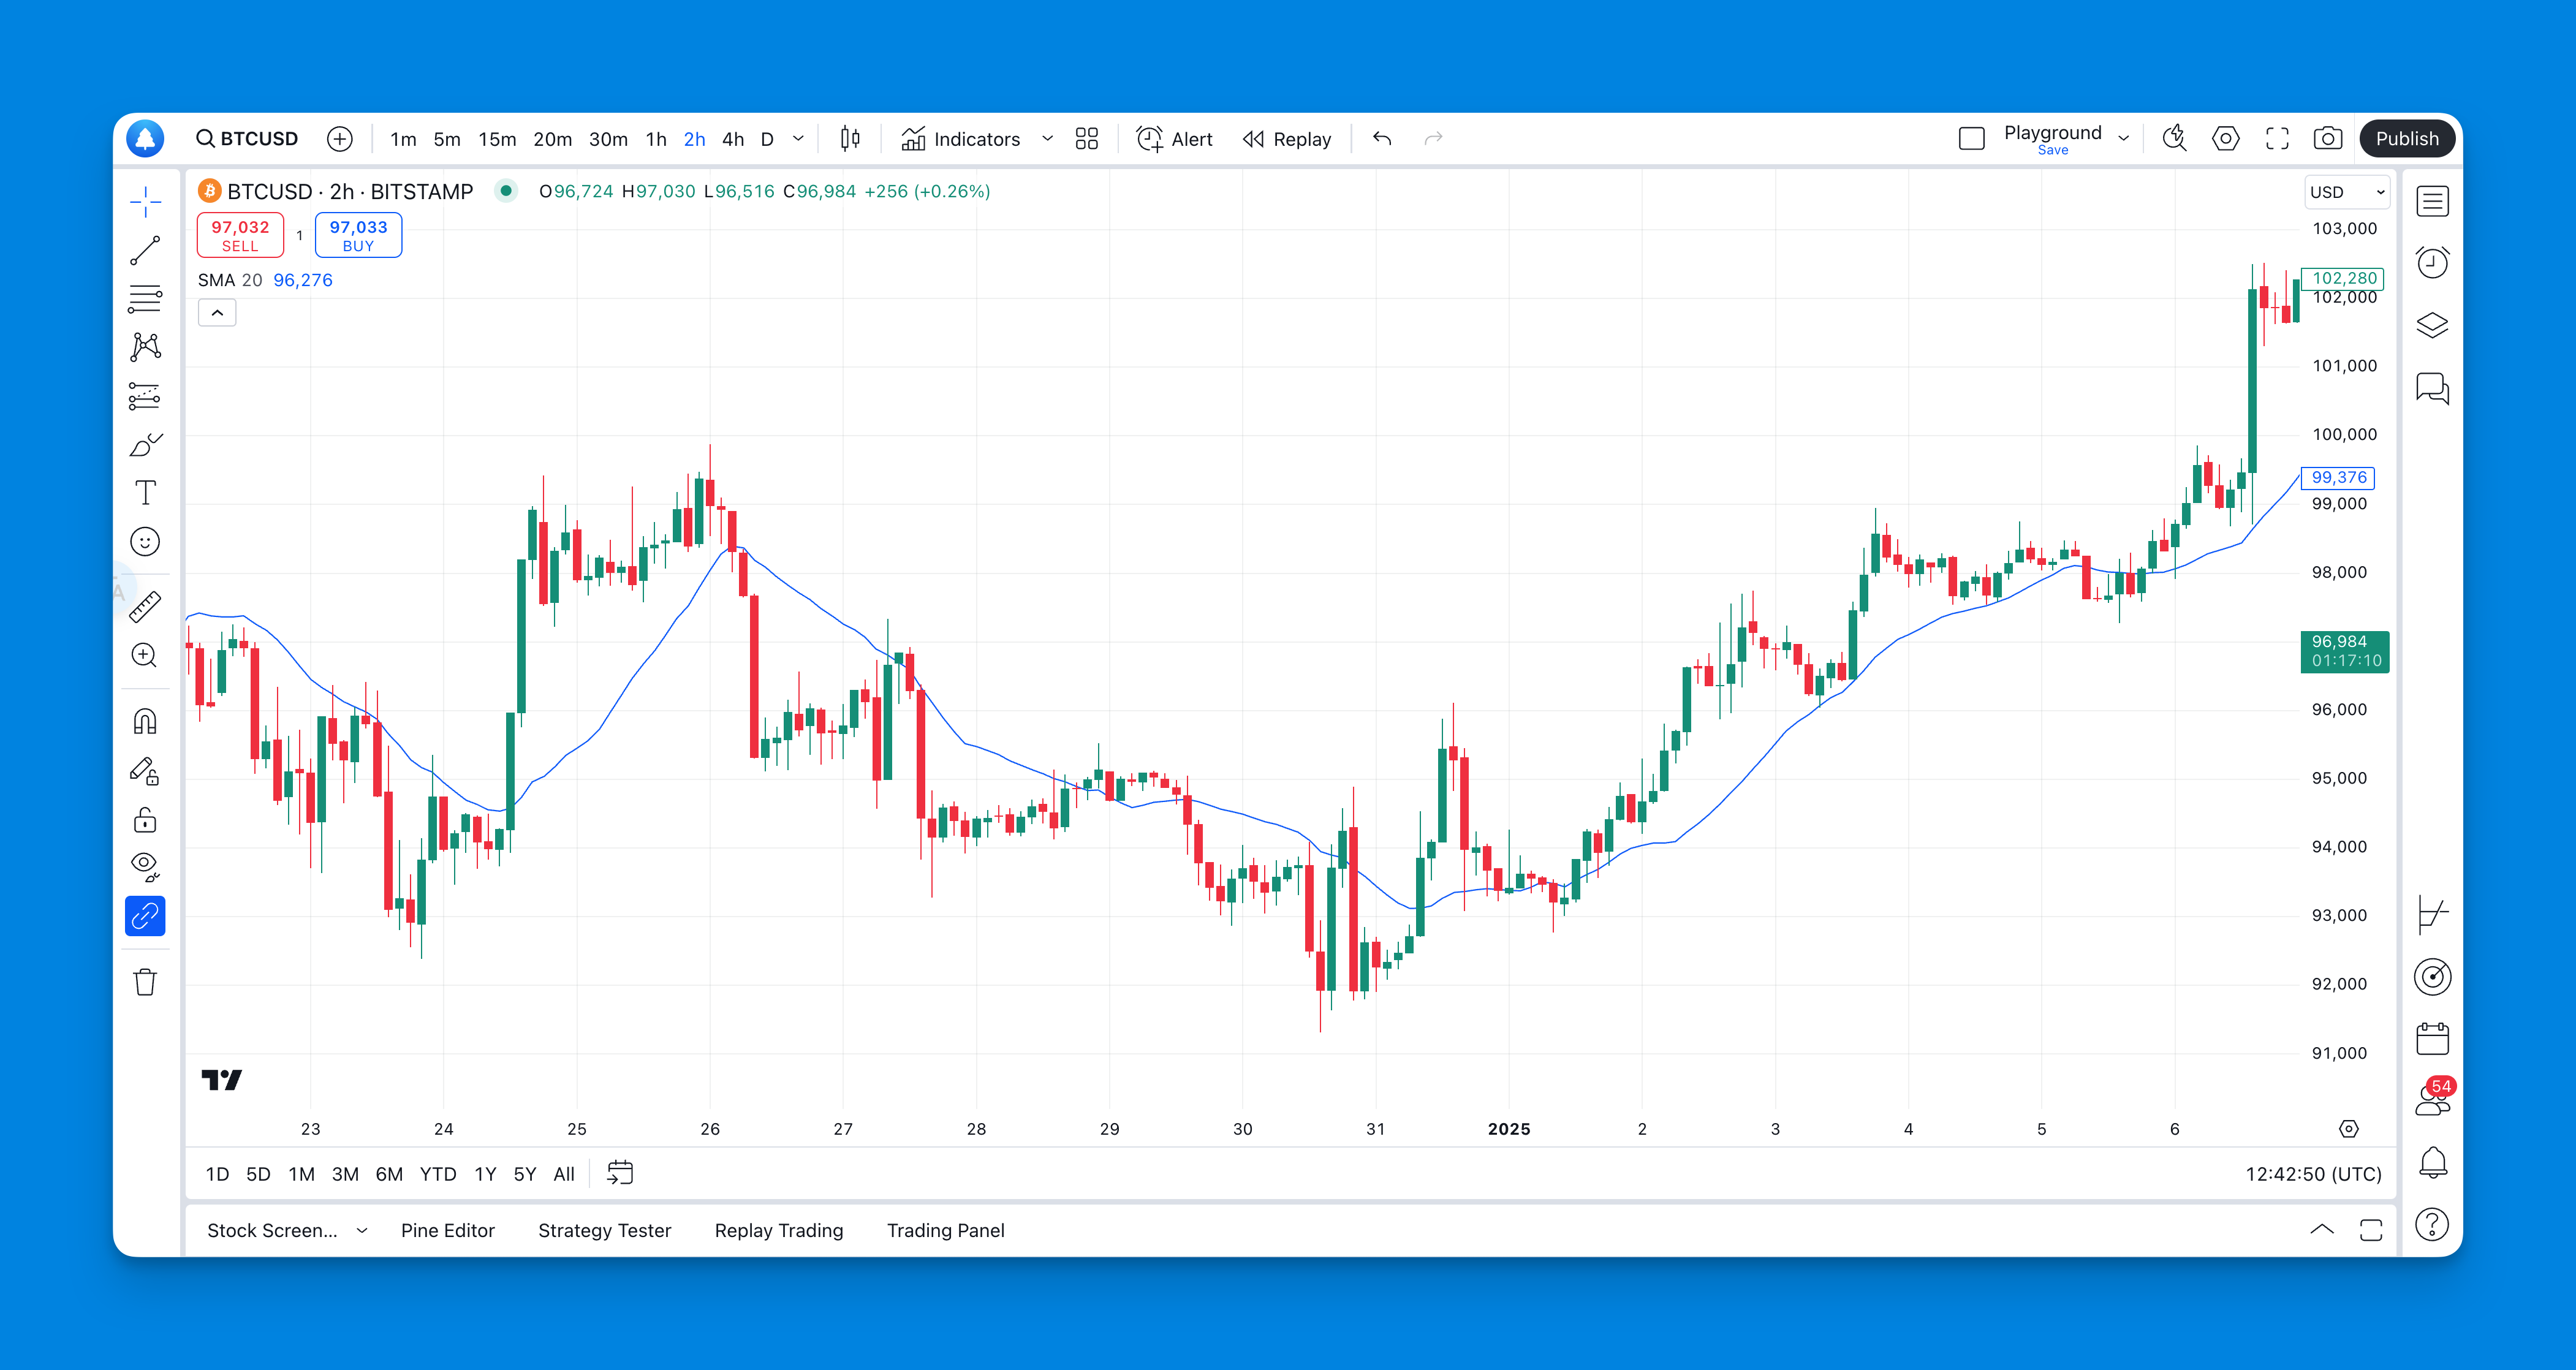
The Simple Moving Average (SMA) is a fundamental concept in technical analysis, widely used by traders to smooth out price data and identify trends over a specified period. In the context of Pine Script, TradingView's unique scripting language, the SMA can be easily calculated and plotted on charts, making it an essential tool for traders. This article will delve into the intricacies of implementing SMA in Pine Script, covering everything from basic syntax to advanced strategies.
Understanding Simple Moving Average (SMA)

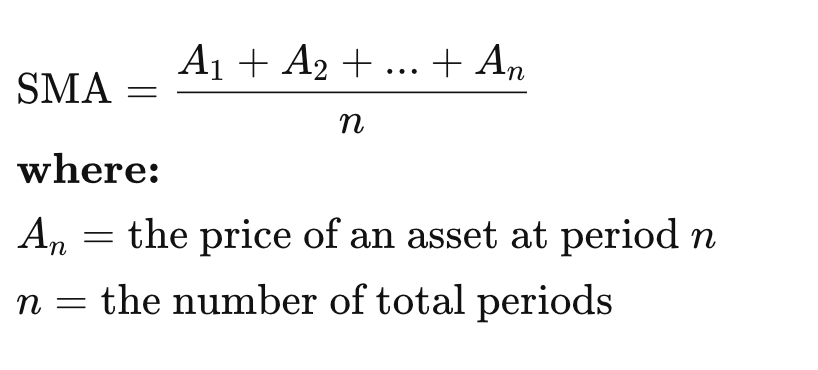
The Simple Moving Average (SMA) is calculated by taking the average of a set number of data points over a specified time period. For example, a 20-day SMA averages the closing prices of the last 20 days. The formula for calculating SMA is:
The Role of Pine Script in Trading
Pine Script is designed specifically for traders to create custom indicators and strategies on TradingView. With its straightforward syntax and built-in functions, it allows users to implement complex trading strategies without extensive programming knowledge. The ta.sma function is the built-in method for calculating the SMA in Pine Script.
Basic Syntax of ta.sma
The syntax for using the ta.sma function in Pine Script is as follows:
ta.sma(source, length)
- source: This is the series of values you want to average (e.g., closing prices).
- length: This indicates how many periods you want to include in your average.
Example Code
Here’s a simple example of how to implement an SMA in Pine Script:
// This source code is subject to the terms of the Mozilla Public License 2.0 at https://mozilla.org/MPL/2.0/
// © Pineify

//======================================================================//
//                    ____  _            _  __                          //
//                   |  _ \(_)_ __   ___(_)/ _|_   _                    //
//                   | |_) | | '_ \ / _ \ | |_| | | |                   //
//                   |  __/| | | | |  __/ |  _| |_| |                   //
//                   |_|   |_|_| |_|\___|_|_|  \__, |                   //
//                                             |___/                    //
//======================================================================//

//@version=6
indicator("[Pineify - Best Pine Script Generator] Simple Moving Average", shorttitle="SMA", overlay=true)
length = input(20, title="Length")
smaValue = ta.sma(close, length)
plot(smaValue, title="SMA", color=color.blue)
In this code:
- We declare the script version and set up an indicator.
- The user can input the length of the SMA.
- The
ta.smafunction calculates the SMA based on closing prices. - Finally, we plot the calculated SMA on the chart.
Add SMA Indicator On Pineify Without Coding

Website: Pineify
Pineify offers an intuitive interface for adding the SMA indicator, with no limits on the number of indicators unlike TradingView's restrictions.
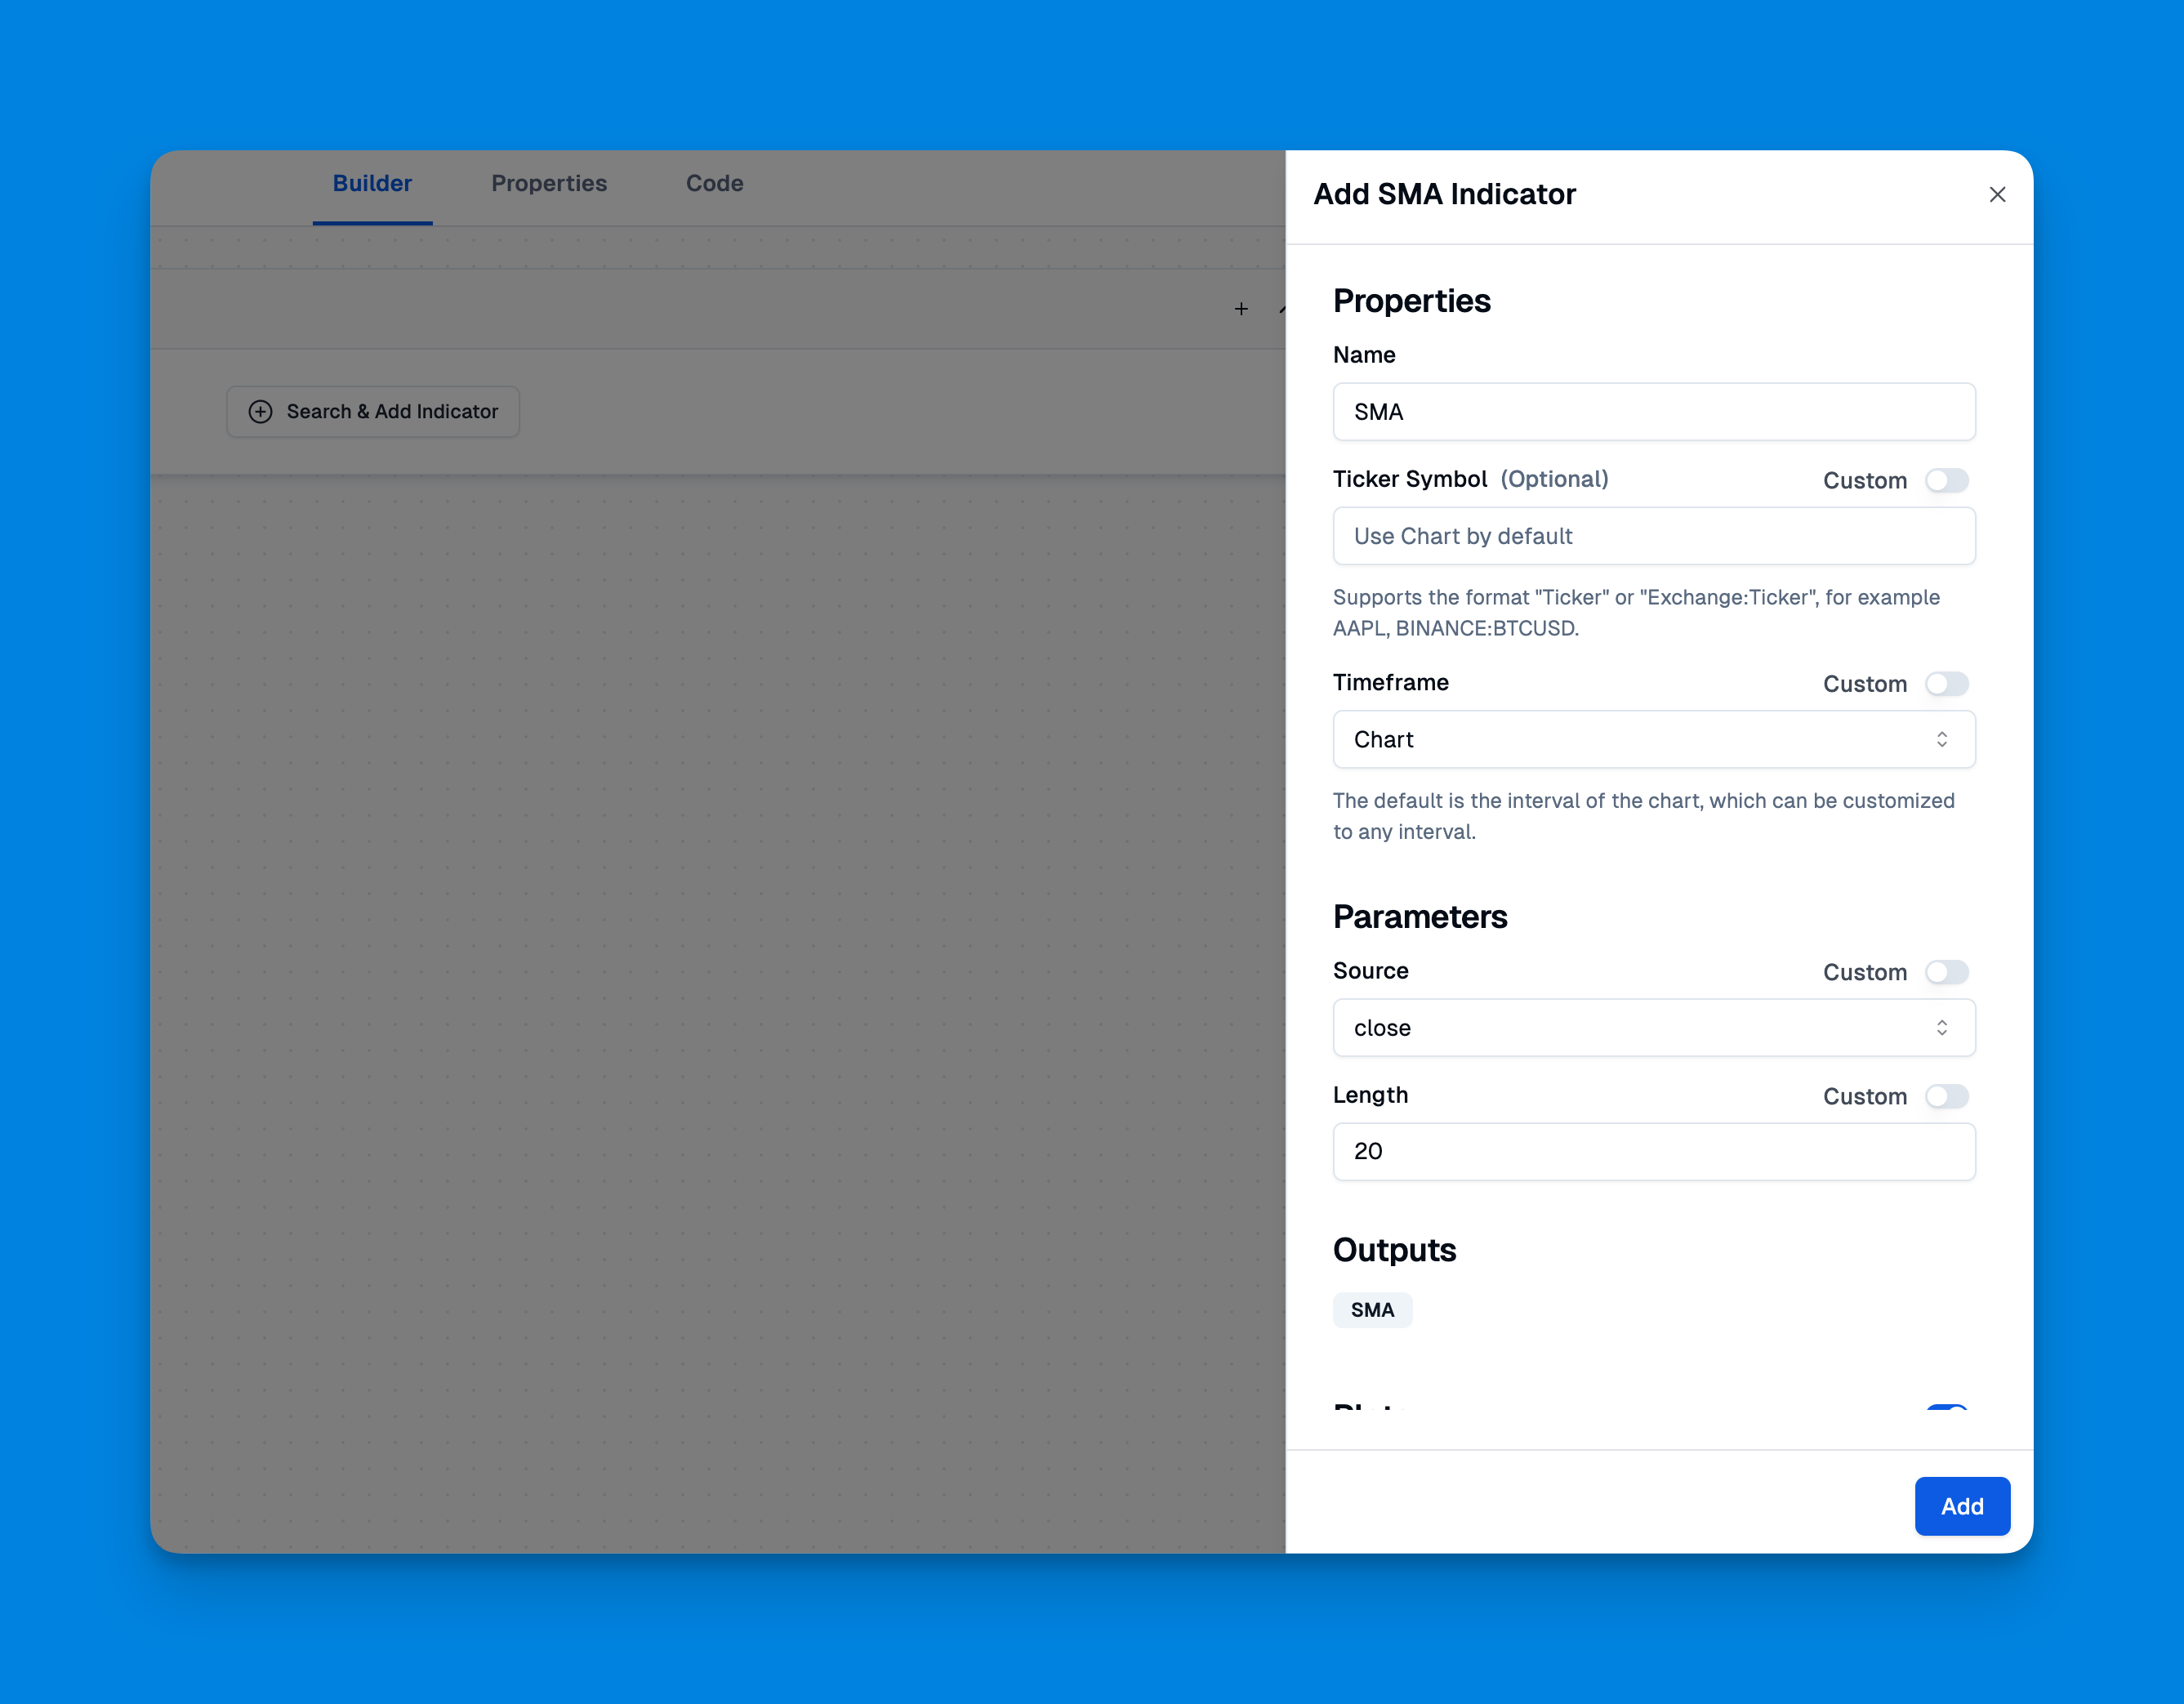
The platform allows users to add unlimited indicators to charts and customize SMA settings to match their trading preferences.
With its condition editor, traders can create sophisticated SMA-based trading rules to enhance their market strategies.
Click here to view all the features of Pineify.
Using SMA in Trading Strategies
SMA can be integrated into various trading strategies. One common approach is using crossover strategies where traders buy or sell based on the interaction between different SMAs.
Example: SMA Crossover Strategy
// This source code is subject to the terms of the Mozilla Public License 2.0 at https://mozilla.org/MPL/2.0/
// © Pineify

//======================================================================//
//                    ____  _            _  __                          //
//                   |  _ \(_)_ __   ___(_)/ _|_   _                    //
//                   | |_) | | '_ \ / _ \ | |_| | | |                   //
//                   |  __/| | | | |  __/ |  _| |_| |                   //
//                   |_|   |_|_| |_|\___|_|_|  \__, |                   //
//                                             |___/                    //
//======================================================================//

//@version=6
strategy("[Pineify - Best Pine Script Generator] SMA Crossover Strategy", overlay=true)

shortLength = input(9, title="Short SMA Length")
longLength = input(21, title="Long SMA Length")

shortSMA = ta.sma(close, shortLength)
longSMA = ta.sma(close, longLength)

plot(shortSMA, color=color.red)
plot(longSMA, color=color.green)

longCondition = ta.crossover(shortSMA, longSMA)
shortCondition = ta.crossunder(shortSMA, longSMA)

if (longCondition)
    strategy.entry("Long", strategy.long)

if (shortCondition)
    strategy.entry("Short", strategy.short)
In this strategy:
- Two SMAs are calculated: a short-term and a long-term.
- Buy signals are generated when the short-term SMA crosses above the long-term SMA.
- Sell signals occur when the short-term SMA crosses below the long-term SMA.
![[Pineify - Best Pine Script Generator] SMA Crossover Strategy](https://r2.pineify.app/assets/b589b69c6d562e4e137c7450969ce4e6.png)
Advanced Applications of SMA
Traders can enhance their strategies by combining SMAs with other indicators or using multi-timeframe analysis. For instance:
- Multi-Timeframe Analysis: You can calculate SMAs from different timeframes and plot them on your current chart. This helps identify trends across various market conditions.
Example: Multi-Timeframe SMA
// This source code is subject to the terms of the Mozilla Public License 2.0 at https://mozilla.org/MPL/2.0/
// © Pineify

//======================================================================//
//                    ____  _            _  __                          //
//                   |  _ \(_)_ __   ___(_)/ _|_   _                    //
//                   | |_) | | '_ \ / _ \ | |_| | | |                   //
//                   |  __/| | | | |  __/ |  _| |_| |                   //
//                   |_|   |_|_| |_|\___|_|_|  \__, |                   //
//                                             |___/                    //
//======================================================================//

//@version=6
indicator("[Pineify - Best Pine Script Generator] Multi-Timeframe SMA", overlay=true)

smaLength = input(50, title="SMA Length")
dailySMA = request.security(syminfo.tickerid, "D", ta.sma(close, smaLength))

plot(dailySMA, color=color.purple)
In this snippet:
- The
request.securityfunction fetches daily closing prices to calculate a daily SMA while viewing another timeframe (e.g., hourly).
Common Issues and Troubleshooting
When working with Pine Script and SMAs, traders may encounter issues such as discrepancies between plotted SMAs and those shown on standard indicators. Common causes include:
- Different Timeframes: Ensure that all SMAs are calculated from data of the same timeframe.
- Data Source Differences: Confirm that you are using consistent price data (e.g., close prices).
Conclusion
Mastering the implementation of Simple Moving Averages in Pine Script significantly enhances a trader's toolkit for technical analysis. By understanding how to calculate and utilize SMAs effectively—whether for basic trend analysis or complex trading strategies—traders can make more informed decisions in their trading activities.
References
- https://pinewizards.com/technical-analysis-functions/ta-sma-function-in-pine-script/
- https://github.com/BigBitsIO/TradingView/blob/master/Scripting Tutorial 1 - Simple Moving Average
- https://jamesbachini.com/pine-script-examples/
- https://www.tradingview.com/pine-script-docs/concepts/strategies/
- https://www.tradingview.com/pine-script-docs/v3/quickstart-guide/
- https://www.tradingview.com/pine-script-docs/v4/quickstart-guide/
- https://stackoverflow.com/questions/73636930/pine-script-smas-on-different-timeframes
- https://www.freelancer.com/jobs/pine-script
- https://www.youtube.com/watch?v=wBx0ebKJcG0
- https://www.forex.com/en/learn-trading/pine-script-user-guide-tradingview/
- https://stackoverflow.com/questions/55233395/sma-crossover-strategy-assistance
- https://algotrading101.com/learn/pine-script-tradingview-guide/
- https://www.tradingview.com/scripts/simplemovingaverage/
- https://www.youtube.com/watch?v=6Q3GheBbZ74
- https://www.smamarketing.net/blog/how-to-do-keyword-analysis
- https://stackoverflow.com/questions/67383323/pine-script-script-smas-dont-match-the-equivalent-on-the-main-chart
- https://www.tradingview.com/pine-script-docs/language/built-ins/
- https://www.reddit.com/r/pinescript/comments/oiqklx/need_help_with_sma/