How to Plot Vertical Lines in Pine Script: A Complete Guide
Are you looking to enhance your TradingView indicators with vertical lines? Plotting vertical lines in Pine Script can be a powerful way to display signals and important information on your trading charts. This guide will walk you through the process step by step.
Understanding Vertical Lines in Pine Script
Vertical lines serve as visual markers on your charts, highlighting specific points in time that may be significant for your trading strategy. Whether you’re marking market events, entry/exit signals, or time-based patterns, vertical lines can make your indicators more informative and visually appealing.
Methods to Plot Vertical Lines
Using line.new() Function
The most straightforward and recommended approach is using the line.new() function:
if (barstate.islast)
    line.new(bar_index, close, bar_index, close * 1.01, extend = extend.both)

This simple code creates a vertical line on the last bar of your chart. The extend = extend.both parameter ensures the line spans the entire height of your chart, making it truly vertical.
Simplify Vertical Line Creation with No-Code Solutions
While traditional Pine Script coding requires technical knowledge, modern tools like Pineify offer an accessible alternative for traders looking to plot vertical lines on their charts.
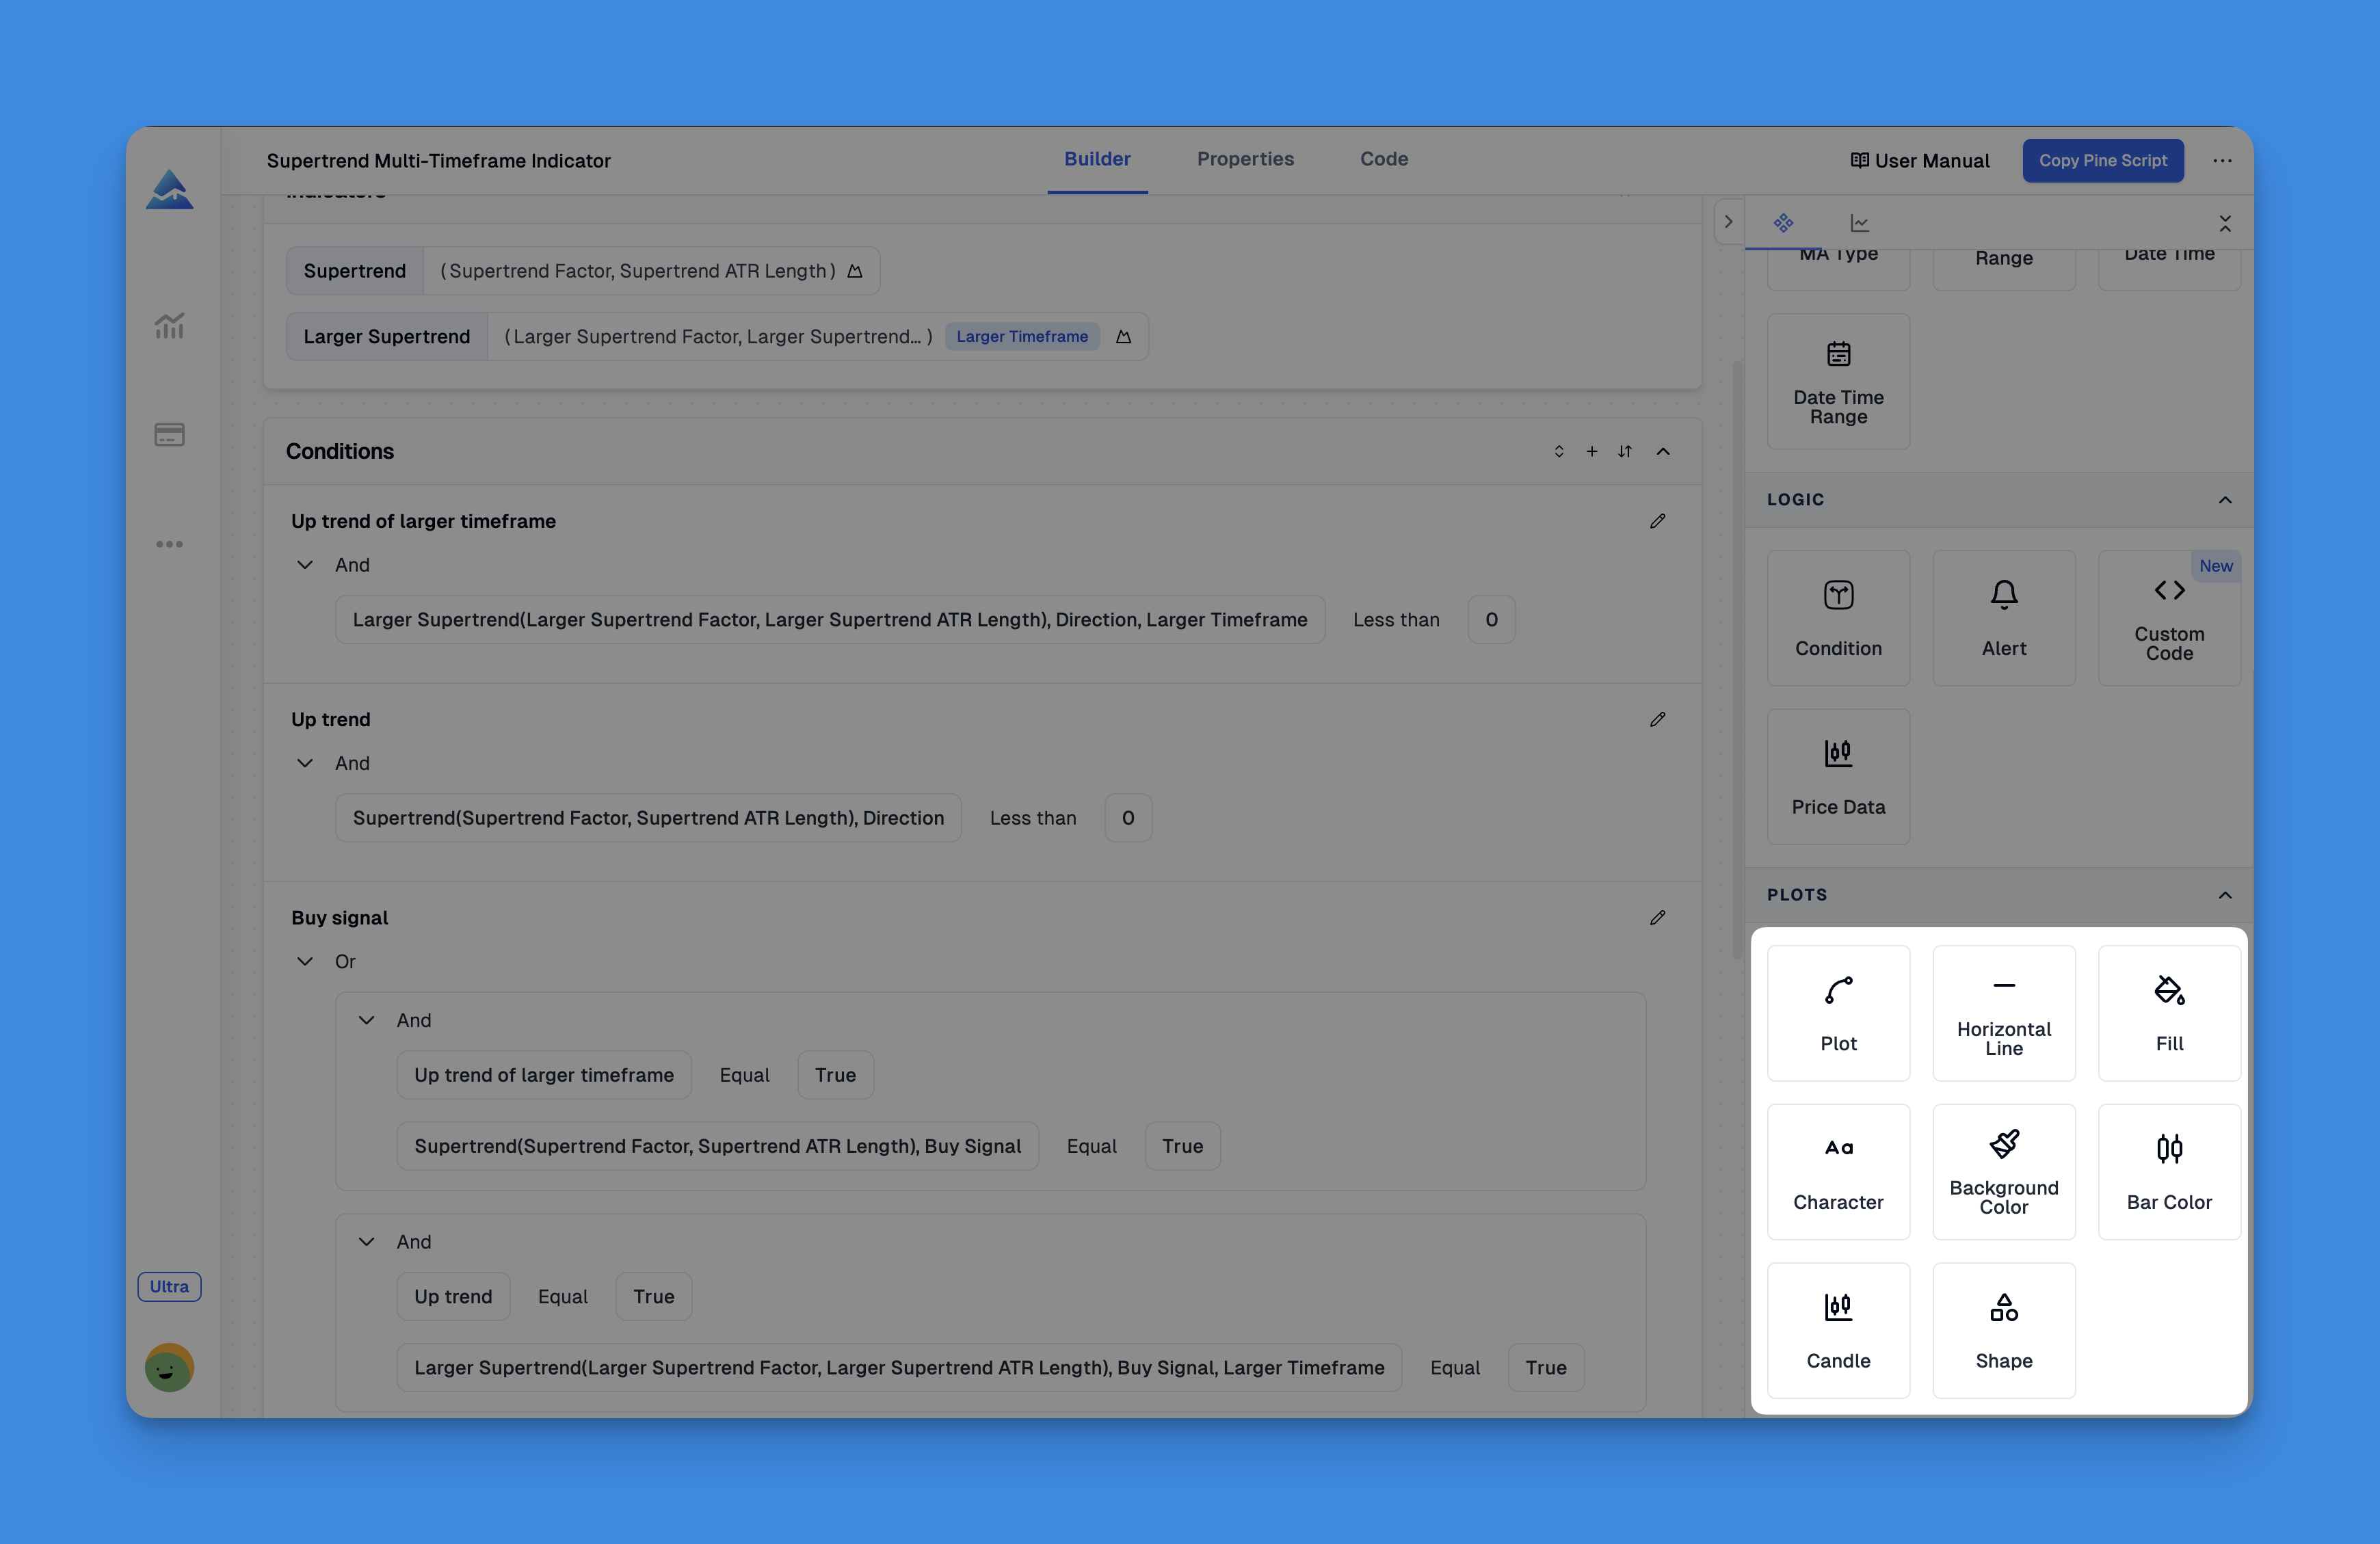
With Pineify's visual editor, you can create custom indicators—including vertical line markers—without writing a single line of code. The platform allows you to plot various visual elements on your TradingView charts, including lines, histograms, background colors, shapes, and characters.
Website: Pineify
Click here to view all the features of Pineify.Customizing Your Vertical Lines
You can easily style your vertical lines to match your indicator’s theme:
if (barstate.islast)
    line.new(bar_index, close, bar_index, close * 1.01,
             extend = extend.both,
             color = color.green,
             style = line.style_dotted,
             width = 3)
This code creates a green dotted line with increased width, making it more visible on your chart.
Alternative Methods
Using bgcolor() for Vertical Bars
For a different visual effect, you can use bgcolor() to create vertical bars:
trange(res, sess) => not na(time(res, sess))
vlinecol = #000000 // black
vline = trange("1", "0700-0701") ? vlinecol : na
bgcolor(vline, transp=0)
This approach colors the entire background of specific bars, creating the appearance of vertical lines.
Drawing Vertical Lines at Specific Dates
To plot a vertical line at a specific date and time, use the timestamp function:
indicator("My Vertical line", overlay=true, scale=scale.none)
plotTime = input.time(defval=timestamp("31 Jan 2022 02:20 +0000"), title="Time")
plot((time == plotTime) ? 10e20 : na, color = color.red, linewidth = 10, title = "MyLine", style = plot.style_histogram)
This code allows you to specify an exact date and time for your vertical line.
Best Practices for Vertical Lines
- Use sparingly: Too many vertical lines can make your chart cluttered and difficult to read
- Choose appropriate colors: Make your lines stand out against your chart background
- Consider line styles: Dotted or dashed lines can be less intrusive than solid lines
- Add tooltips or labels: When possible, add information to explain what each line represents
Conclusion
Plotting vertical lines in Pine Script is a versatile technique that can significantly enhance your TradingView indicators. Whether you’re using the modern line.new() function or alternative approaches like plot() with histogram style, vertical lines can help you and your users visualize important market events and signals.