Unlocking the Power of Pine Script: A Guide to bar_index
Pine Script, a popular programming language used in TradingView, offers a robust toolset for traders and analysts to create custom indicators and strategies. Among its key features is the bar_index, a built-in variable that plays a crucial role in referencing specific bars on a chart. This article delves into the world of bar_index, exploring its functionality, usage, and best practices for integration into your trading scripts.
What is bar_index?
bar_index is a fundamental concept in Pine Script, representing the index of the current bar being processed. It uses a zero-based indexing system, where the first bar on the chart is assigned an index of 0. This variable is of type series int, allowing it to dynamically change as you navigate through the chart。
Simplifying Pine Script with Pineify

Website: Pineify
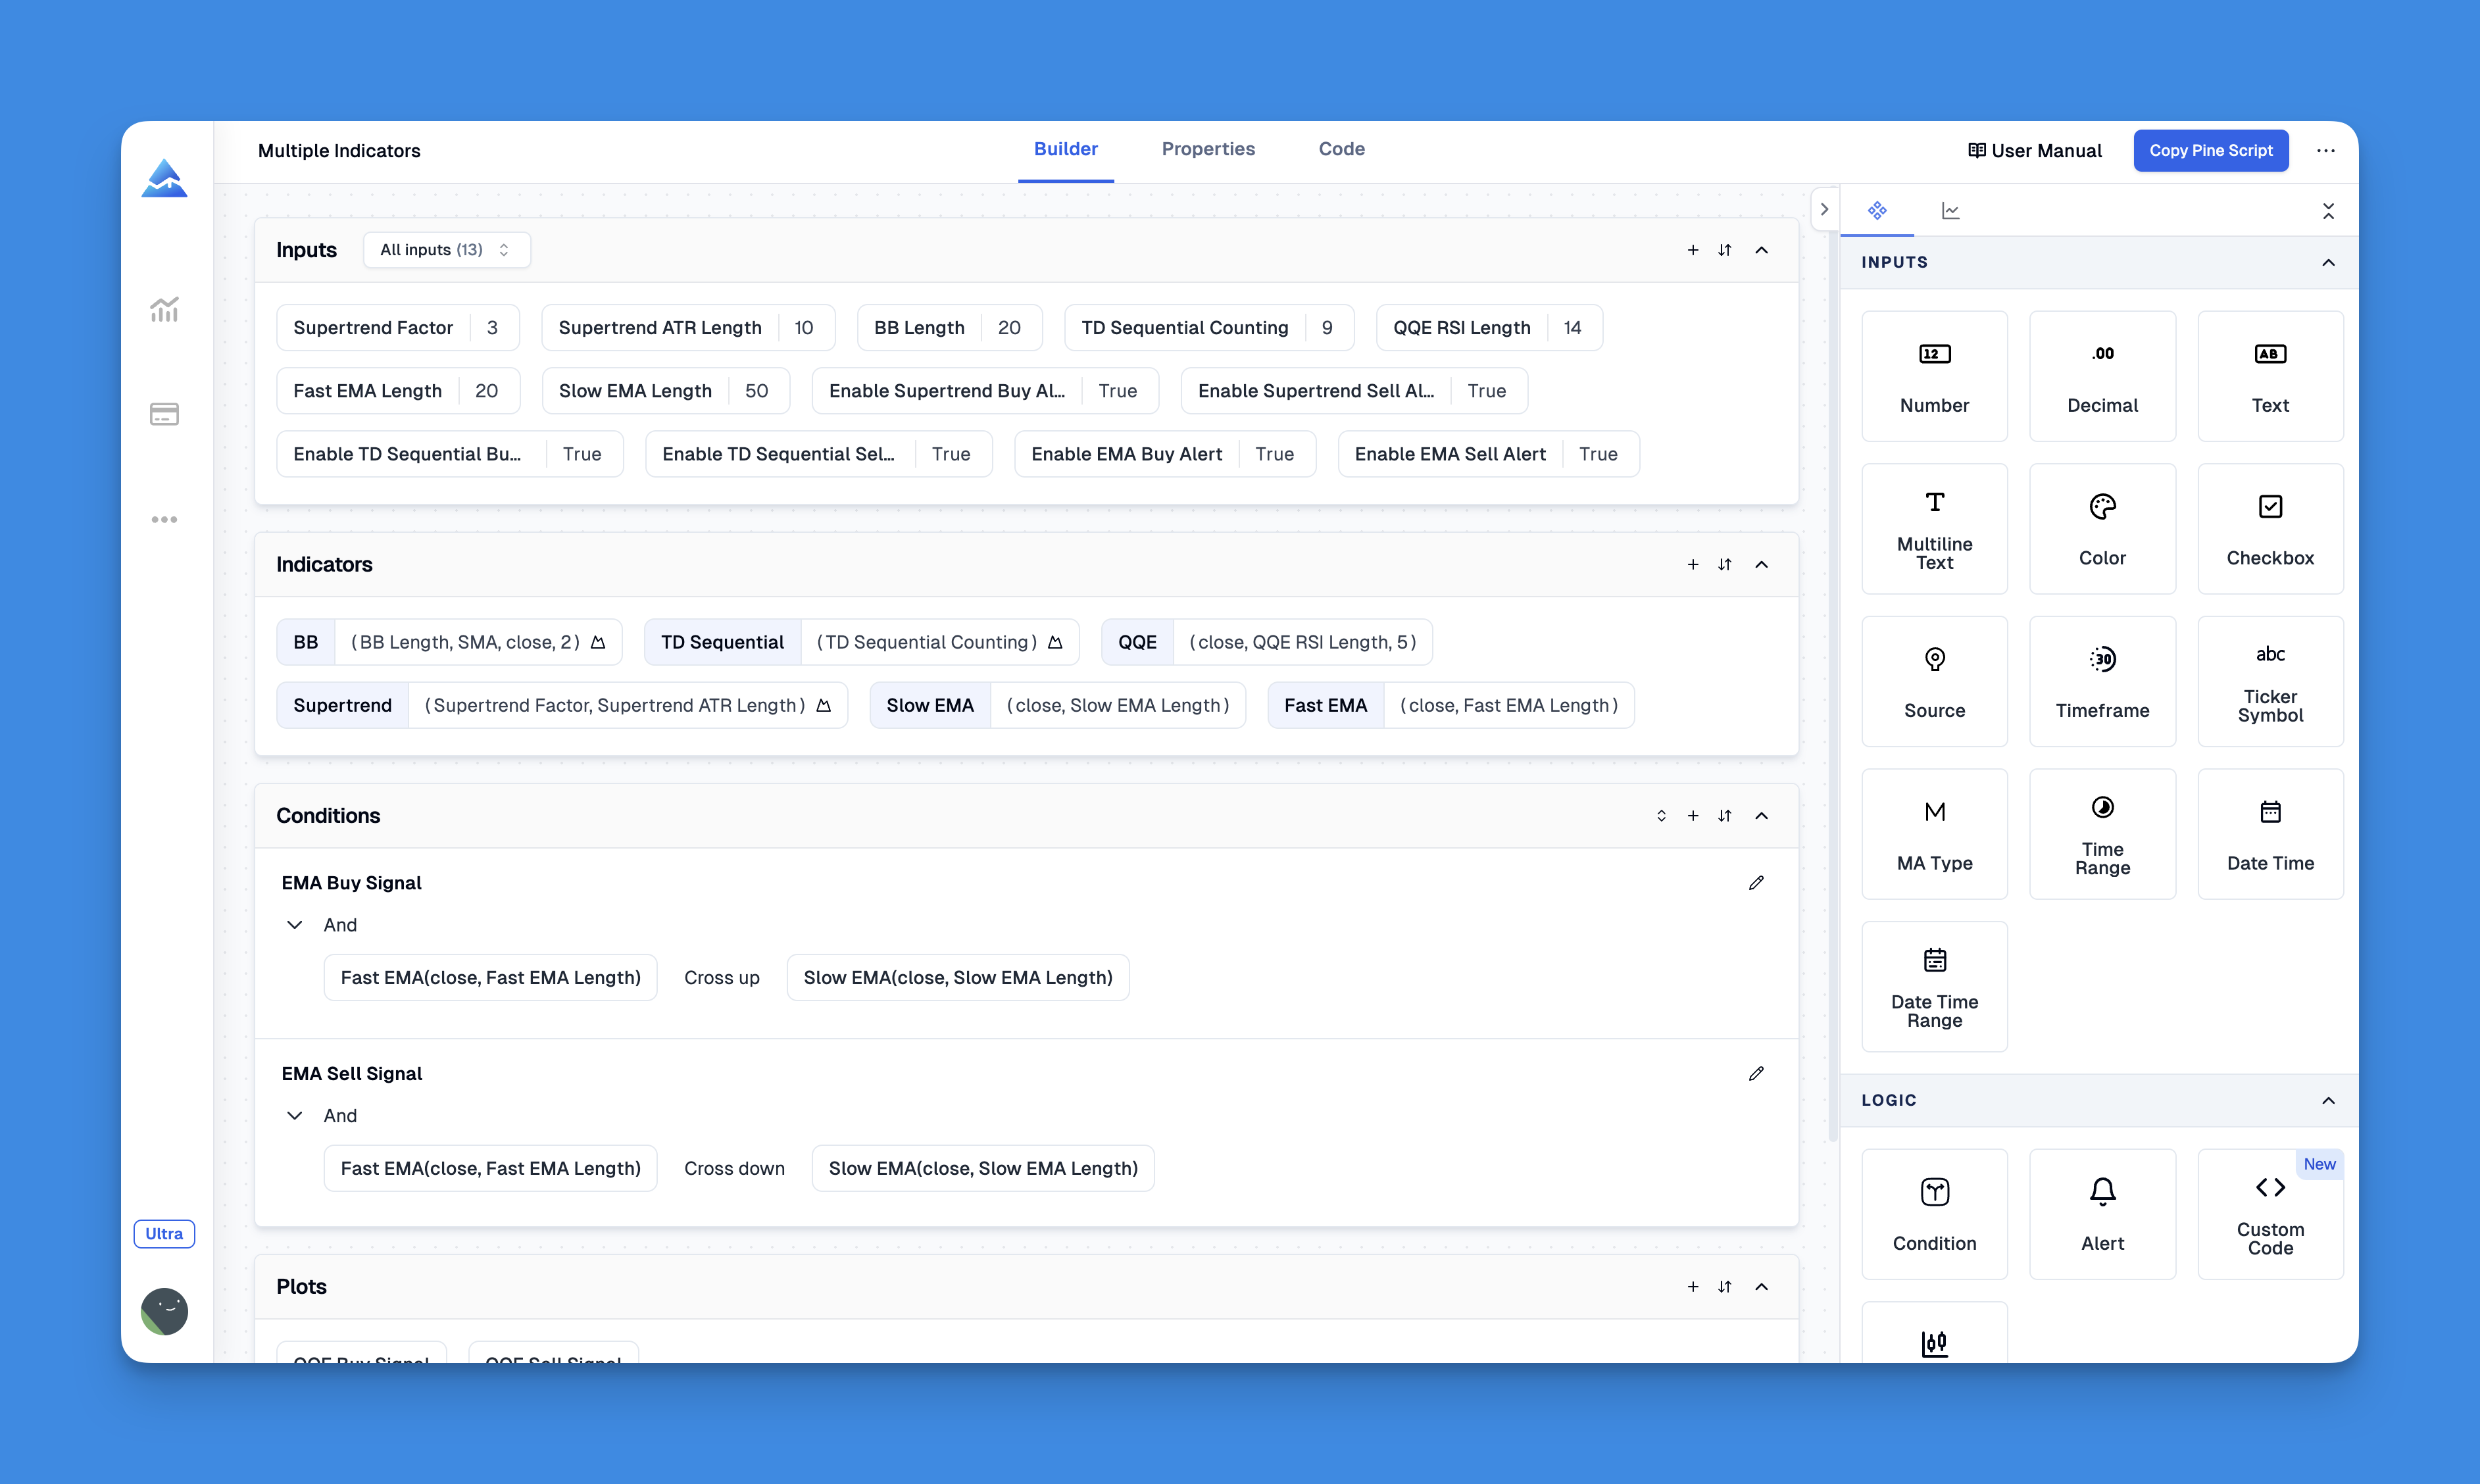
When working with Pine Script, particularly with functions like bar_index, creating and managing indicators and strategies can be complex. However, tools like Pineify simplify this process by allowing users to build indicators and strategies without needing to write code. Pineify offers a visual interface that enables traders to easily create, edit, and organize their indicators and strategies, bypassing the limitations of TradingView's free plan, which restricts the number of indicators that can be added to a chart.
The platform also includes a powerful condition editor, which enables users to combine multiple technical indicators and price data to create precise trading rules. This feature is particularly useful when working with bar_index, as it allows traders to define specific conditions based on historical data.
How to Use bar_index
Plotting and Conditional Logic
To visualize the bar_index, you can plot its value directly on the chart. Here’s an example:
// This source code is subject to the terms of the Mozilla Public License 2.0 at https://mozilla.org/MPL/2.0/
// © Pineify

//======================================================================//
//                    ____  _            _  __                          //
//                   |  _ \(_)_ __   ___(_)/ _|_   _                    //
//                   | |_) | | '_ \ / _ \ | |_| | | |                   //
//                   |  __/| | | | |  __/ |  _| |_| |                   //
//                   |_|   |_|_| |_|\___|_|_|  \__, |                   //
//                                             |___/                    //
//======================================================================//

//@version=6
indicator("eify - Best Pine Script Generator] My Custom Bar Index Indicator", overlay=false)
plot(bar_index)
plot(bar_index > 5000 ? close : na)
- Indicator Declaration: The script starts by declaring an indicator with
overlay=false, ensuring plots appear directly on the separate chart. - Plotting
bar_index: The firstplotfunction displays thebar_indexfor each bar, providing a visual representation of each bar’s position. - Conditional Plotting: The second
plotfunction demonstrates conditional plotting based onbar_index. It plots thecloseprice if the bar**** ****index exceeds 5000; otherwise, it plots nothing (na).

Key Features and Remarks
- Type:
bar_indexis aseries int, making it suitable for dynamic conditions and calculations. - Replacement of
nVariable: In Pine Script version 4,bar_indexreplaced thenvariable, standardizing bar index references. - Zero-Based Indexing: The indexing starts at 0, crucial for calculating offsets or comparing indices.
- Indicator Repainting: Be cautious of repainting issues when using
bar_index, as indicator values can change with new data.
Best Practices for Using bar_index
- Dynamic Calculations: Use
bar_indexfor dynamic calculations that progress along the chart. - Conditional Triggers: Implement conditional triggers based on specific bar indices to enhance strategy precision.
- Avoid Repainting: Ensure strategies account for repainting to avoid misleading signals.
Conclusion
Incorporating bar_index into your Pine Script indicators or strategies unlocks a deeper level of control and precision, enabling the creation of more nuanced trading tools. Whether you’re a seasoned trader or just starting out, mastering bar_index can significantly enhance your trading experience.