Volume Weighted Average Price (VWAP) in Pine Script
Volume Weighted Average Price (VWAP) is a sophisticated technical analysis indicator that combines price and volume data to determine the average price at which a security has traded throughout the day. This overview explores how VWAP works, its applications in trading, and its implementation in Pine Script.
What is the VWAP?
Volume Weighted Average Price (VWAP) is a critical technical analysis tool that provides traders with an average price of a security, weighted by the volume of trades over a specific period. Unlike simple moving averages, which treat all prices equally, VWAP emphasizes prices at which higher volumes were traded, making it particularly useful for understanding market dynamics during intraday trading.
VWAP is calculated throughout the trading day and resets at the beginning of each new session, allowing traders to gauge whether a stock is trading above or below its average price for that day. This makes VWAP a popular benchmark among institutional investors and traders who seek to execute large orders without significantly impacting the market price.
How to Use VWAP Indicator

The VWAP indicator can be used in various ways to enhance trading strategies:
- Trend Confirmation: Traders often use VWAP to confirm trends. If the price is consistently above the VWAP, it indicates bullish sentiment, while prices below suggest bearish conditions.
- Support and Resistance Levels: VWAP can act as a dynamic support or resistance level. Traders may look to buy when prices approach VWAP from below (acting as support) and sell when they approach from above (acting as resistance).
- Entry and Exit Points: Many traders use VWAP as a reference for entry and exit points. For instance, entering long positions when the price crosses above VWAP or exiting short positions when it crosses below can be effective strategies.
- Mean Reversion Strategy: This strategy involves buying when the price drops below VWAP, anticipating a bounce back towards it, and selling when it rises above VWAP, expecting a pullback.
- Breakout Strategy: Traders may enter long positions when the price breaks above VWAP or short positions when it falls below, indicating potential continuation of the trend.
What is TradingView and Pineify?
TradingView is a popular platform for traders and investors that offers advanced charting tools, social networking features, and a wide array of technical indicators. It enables users to analyze financial markets in real-time and share insights with a community of traders.
Pineify, on the other hand, is an innovative tool designed specifically for TradingView users that allows them to create and manage custom trading indicators and strategies without any coding knowledge. By utilizing Pineify, traders can generate complex indicators quickly, saving significant time and effort compared to traditional coding methods.

Website: Pineify
Click here to view all the features of Pineify.Adding the VWAP to TradingView Chart Without Coding
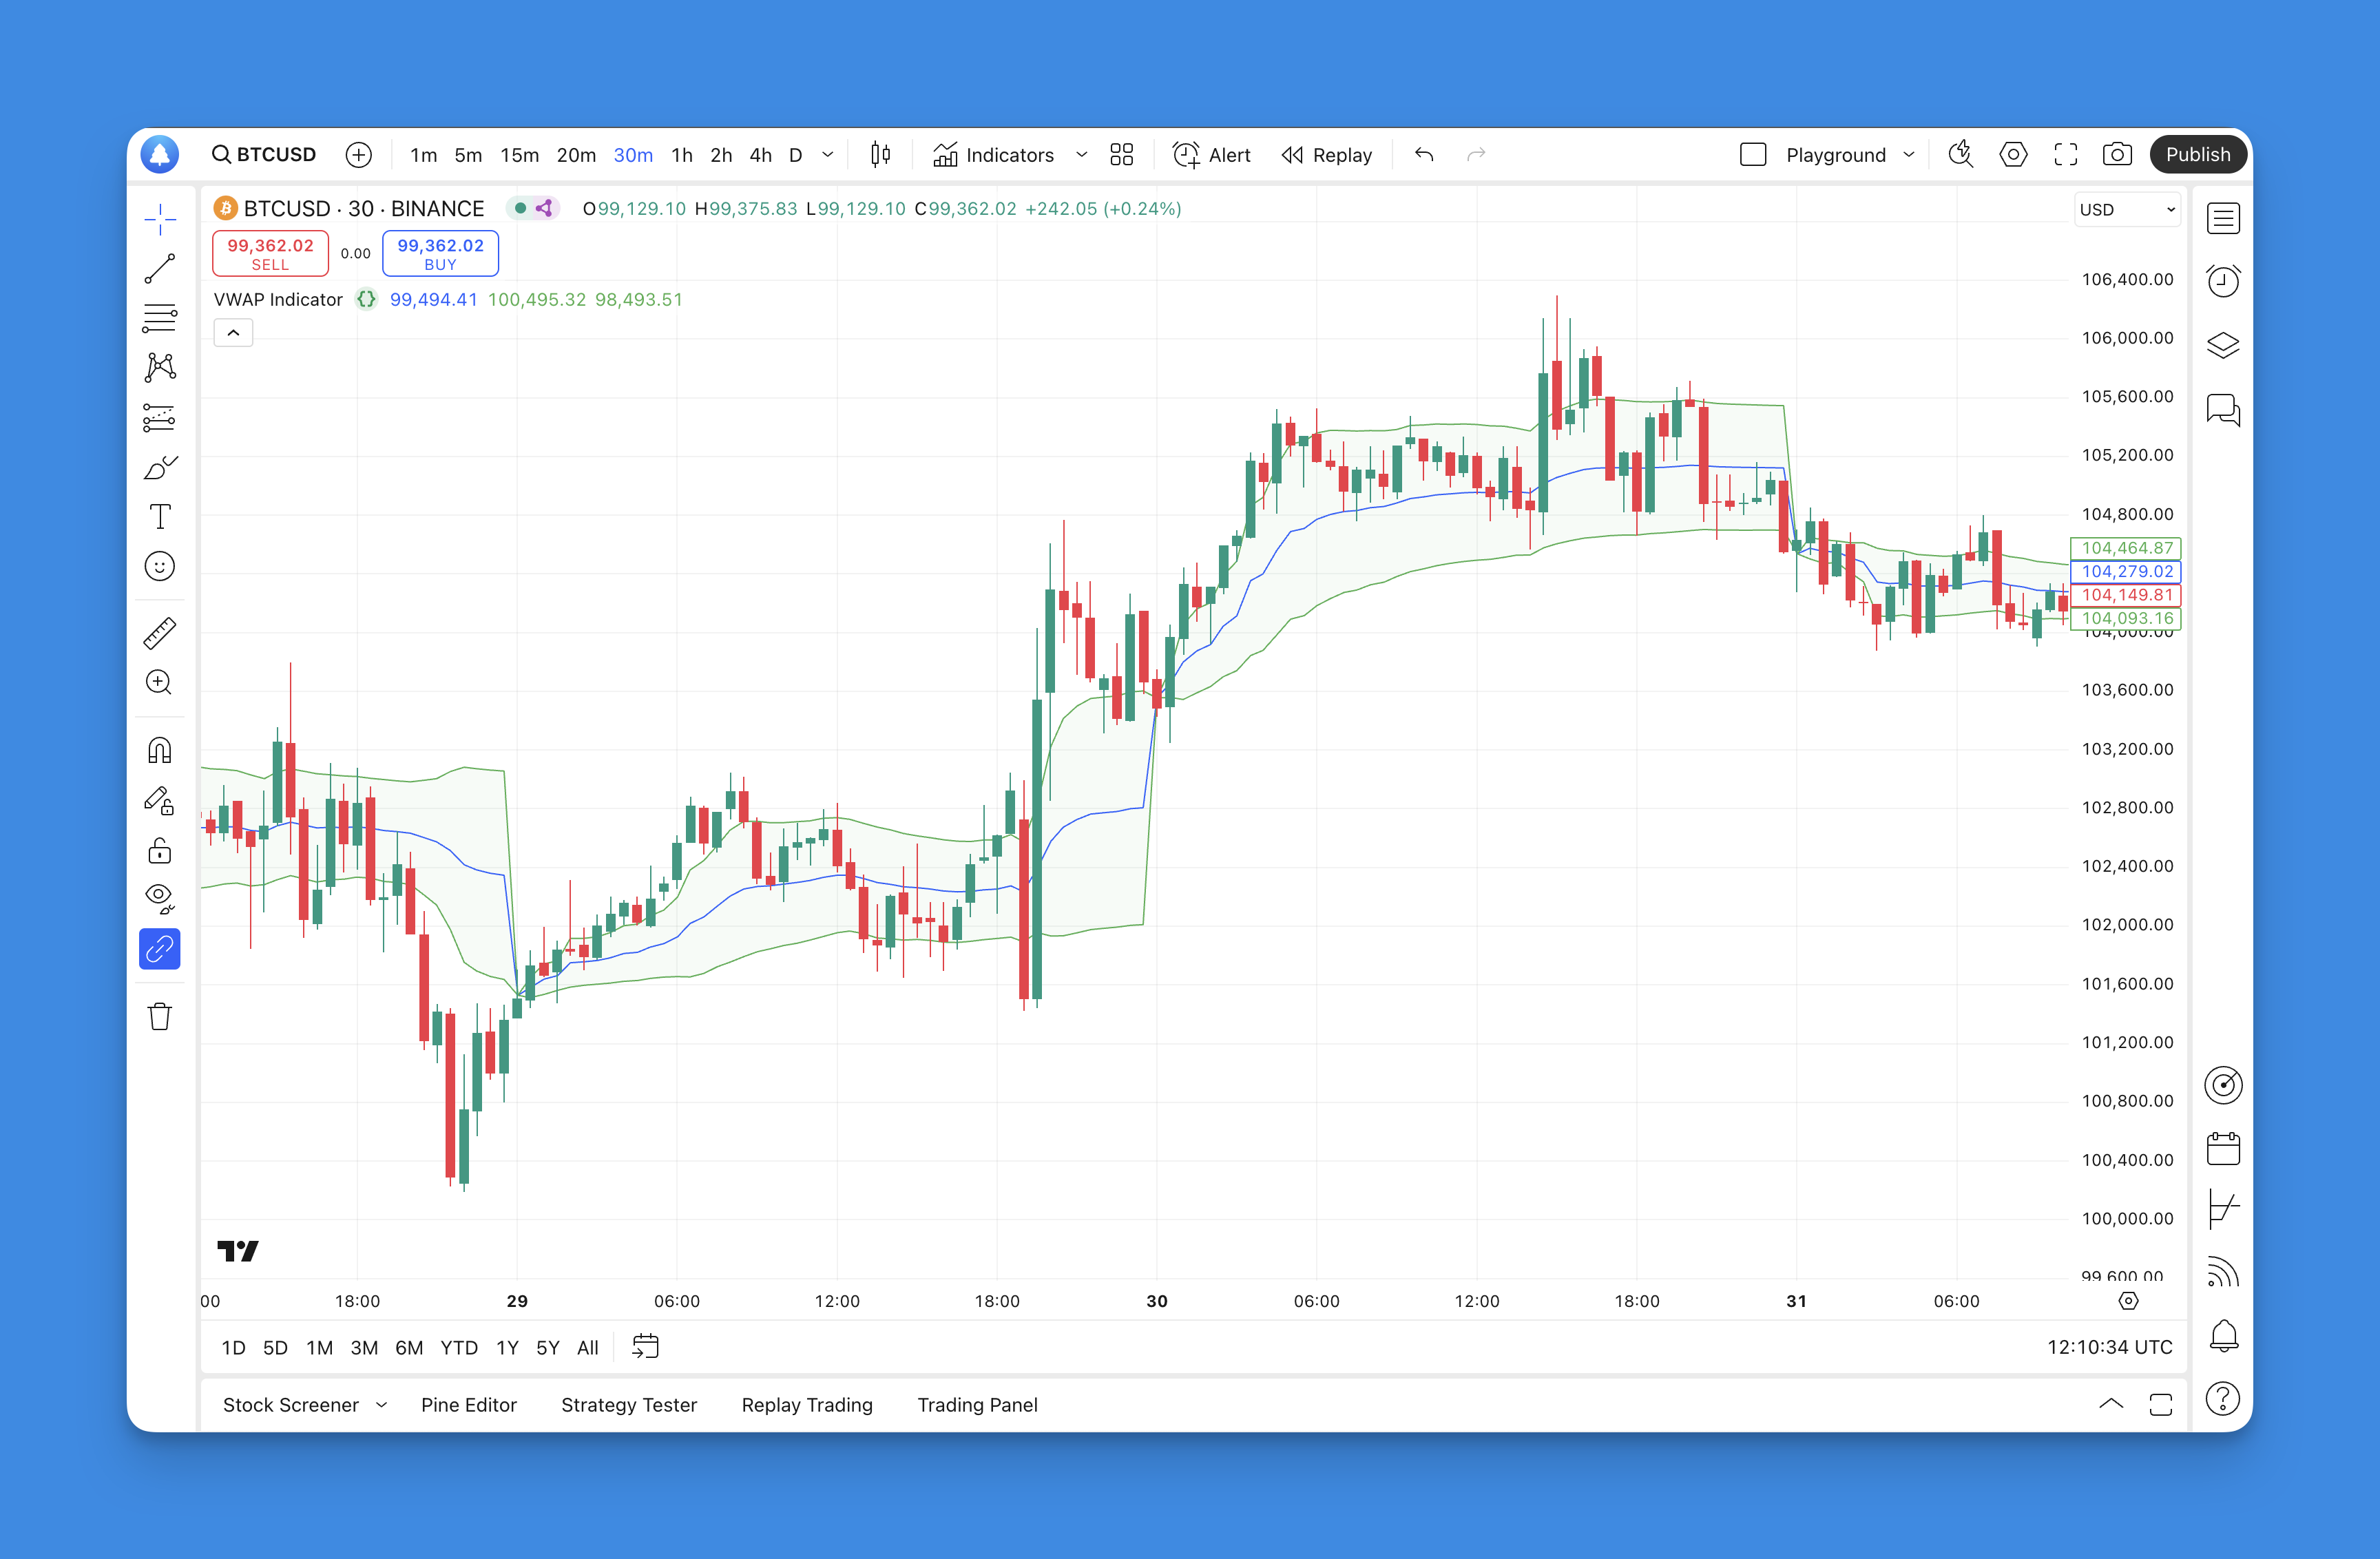
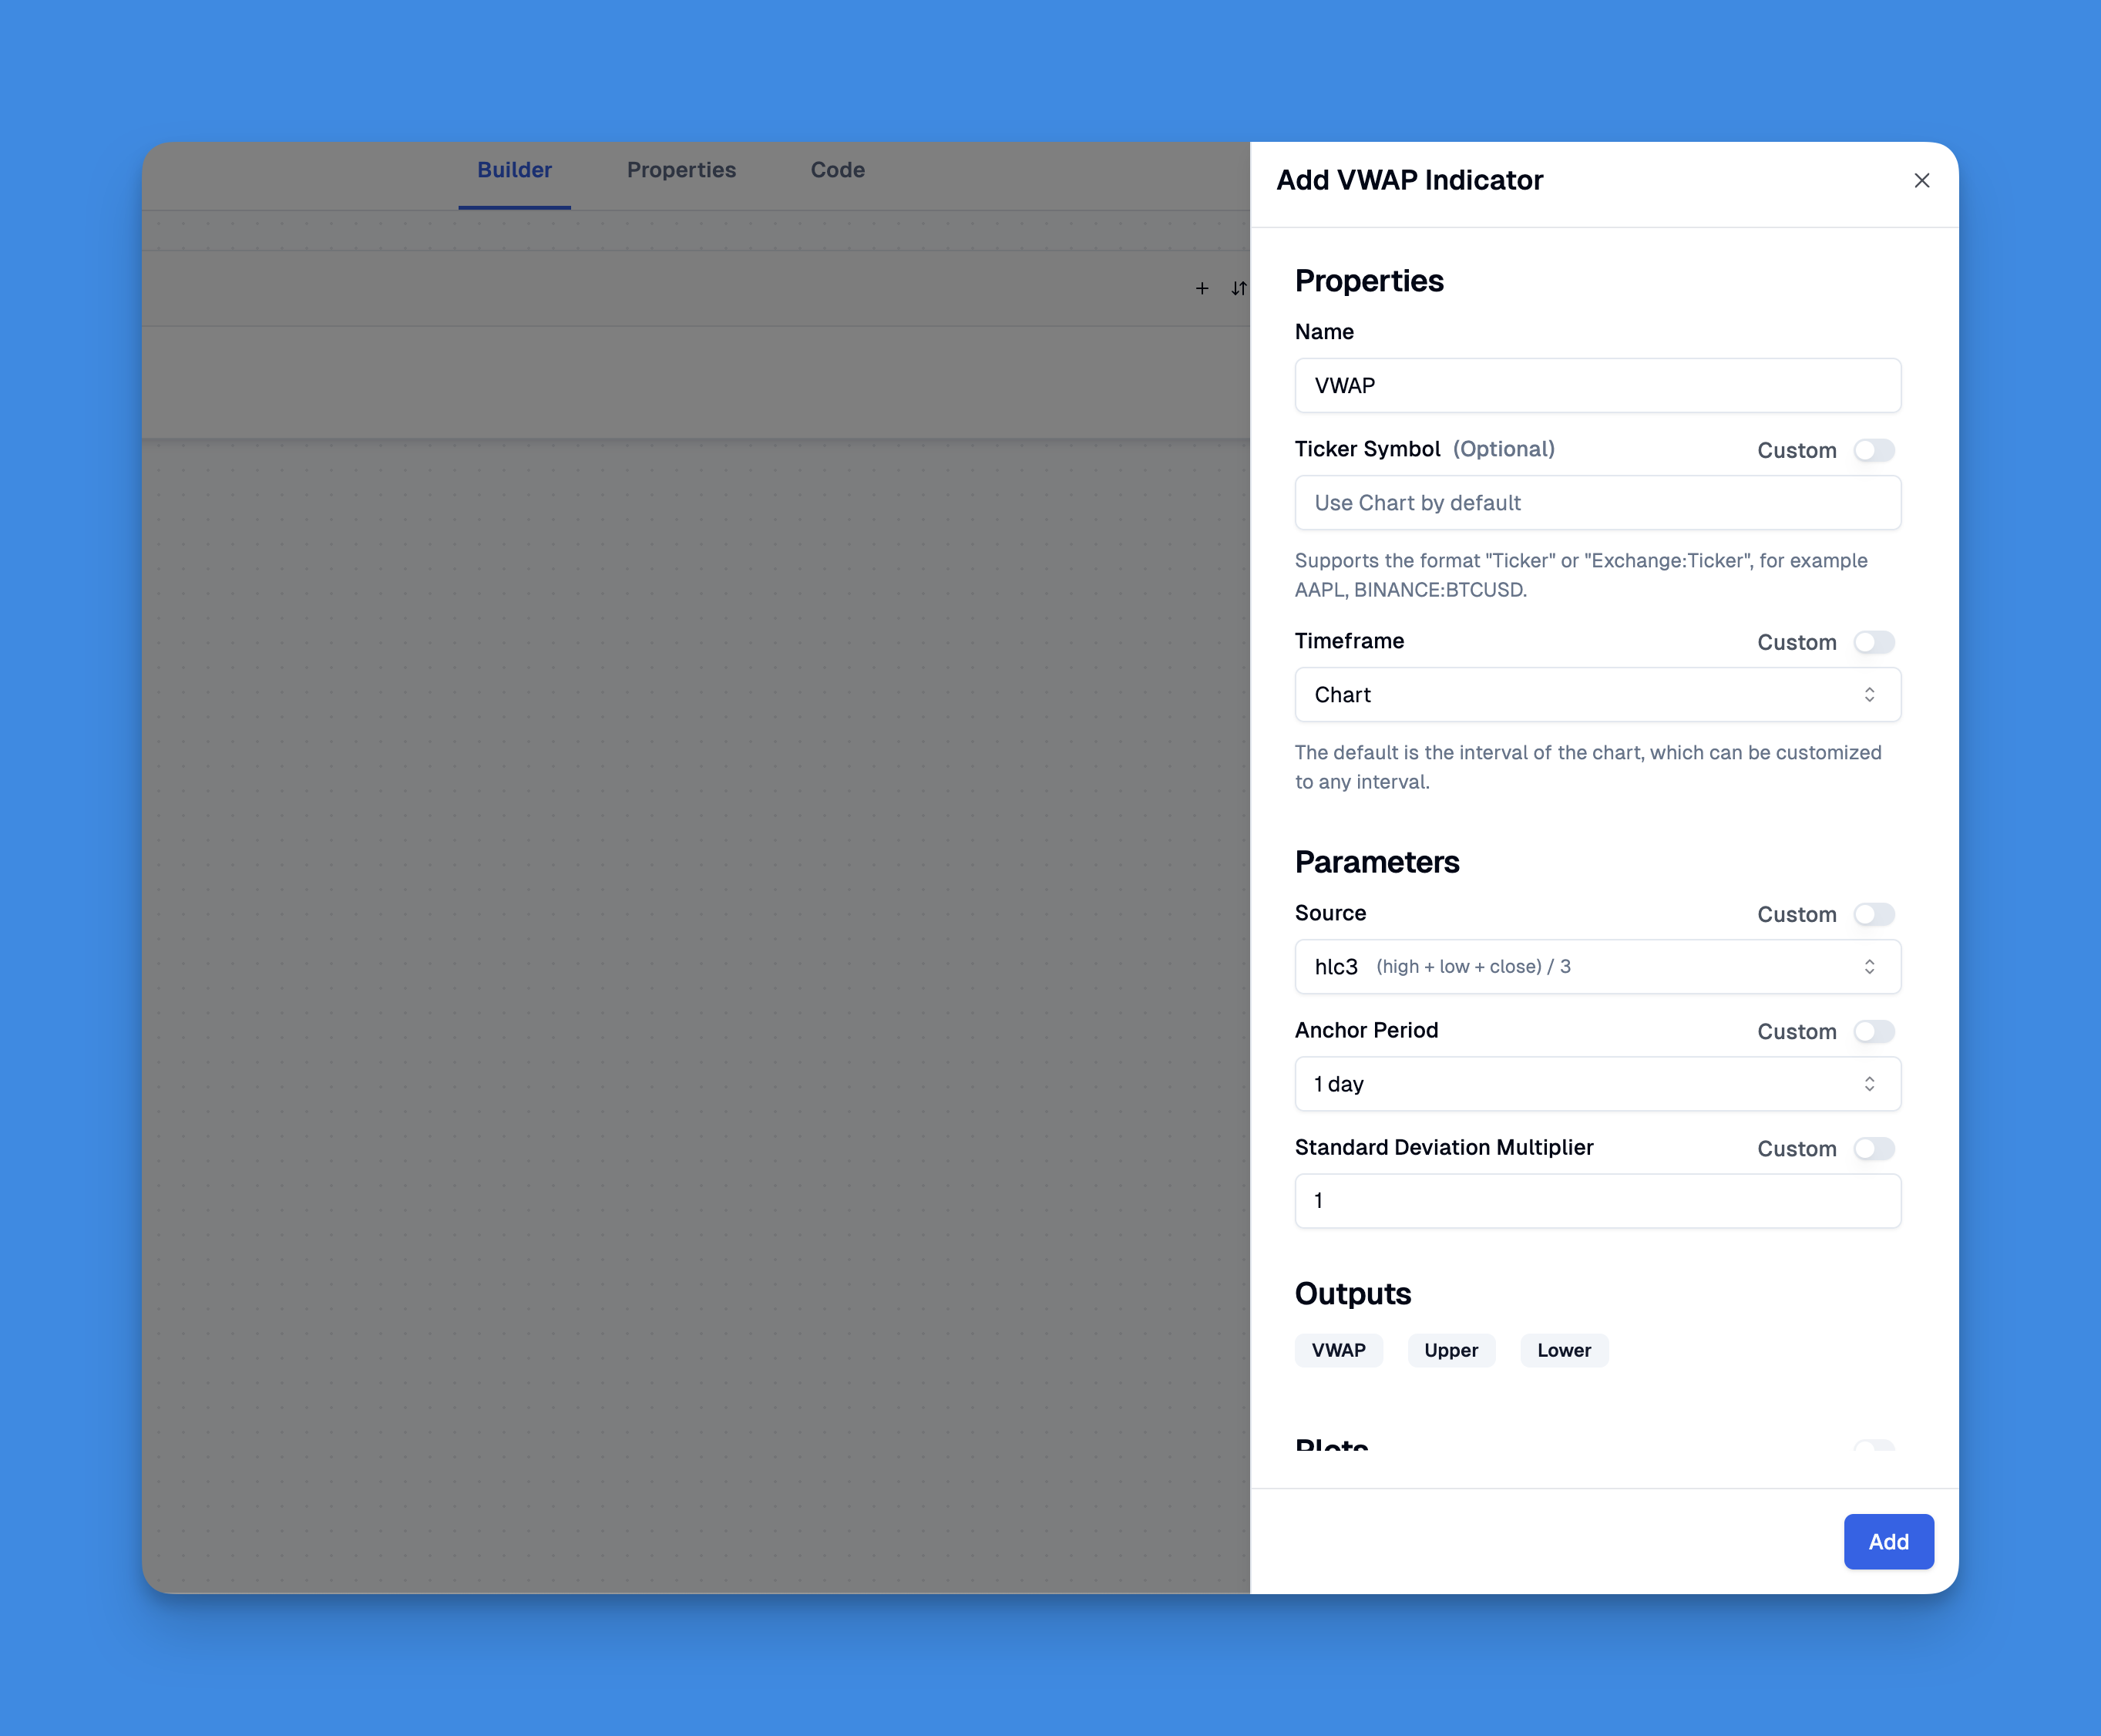
Incorporating the Volume Weighted Average Price (VWAP) into your TradingView charts can enhance your trading strategy. With Pineify, this process becomes straightforward and accessible even for those without programming skills. Users can easily add the VWAP indicator by leveraging Pineify's intuitive UI, which allows for the customization of inputs and plots.
VWAP Pine Script
// This source code is subject to the terms of the Mozilla Public License 2.0 at https://mozilla.org/MPL/2.0/
// © Pineify
//======================================================================//
// ____ _ _ __ //
// | _ \(_)_ __ ___(_)/ _|_ _ //
// | |_) | | '_ \ / _ \ | |_| | | | //
// | __/| | | | | __/ | _| |_| | //
// |_| |_|_| |_|\___|_|_| \__, | //
// |___/ //
//======================================================================//
//@version=6
indicator(title="VWAP Indicator", overlay=true, max_labels_count=500)
//#region —————————————————————————————————————————————————— Custom Code
//#endregion ———————————————————————————————————————�—————————————————————
//#region —————————————————————————————————————————————————— Common Dependence
p_comm_time_range_to_unix_time(string time_range, int date_time = time, string timezone = syminfo.timezone) =>
int start_unix_time = na
int end_unix_time = na
int start_time_hour = na
int start_time_minute = na
int end_time_hour = na
int end_time_minute = na
if str.length(time_range) == 11
// Format: hh:mm-hh:mm
start_time_hour := math.floor(str.tonumber(str.substring(time_range, 0, 2)))
start_time_minute := math.floor(str.tonumber(str.substring(time_range, 3, 5)))
end_time_hour := math.floor(str.tonumber(str.substring(time_range, 6, 8)))
end_time_minute := math.floor(str.tonumber(str.substring(time_range, 9, 11)))
else if str.length(time_range) == 9
// Format: hhmm-hhmm
start_time_hour := math.floor(str.tonumber(str.substring(time_range, 0, 2)))
start_time_minute := math.floor(str.tonumber(str.substring(time_range, 2, 4)))
end_time_hour := math.floor(str.tonumber(str.substring(time_range, 5, 7)))
end_time_minute := math.floor(str.tonumber(str.substring(time_range, 7, 9)))
start_unix_time := timestamp(timezone, year(date_time, timezone), month(date_time, timezone), dayofmonth(date_time, timezone), start_time_hour, start_time_minute, 0)
end_unix_time := timestamp(timezone, year(date_time, timezone), month(date_time, timezone), dayofmonth(date_time, timezone), end_time_hour, end_time_minute, 0)
[start_unix_time, end_unix_time]
p_comm_time_range_to_start_unix_time(string time_range, int date_time = time, string timezone = syminfo.timezone) =>
int start_time_hour = na
int start_time_minute = na
if str.length(time_range) == 11
// Format: hh:mm-hh:mm
start_time_hour := math.floor(str.tonumber(str.substring(time_range, 0, 2)))
start_time_minute := math.floor(str.tonumber(str.substring(time_range, 3, 5)))
else if str.length(time_range) == 9
// Format: hhmm-hhmm
start_time_hour := math.floor(str.tonumber(str.substring(time_range, 0, 2)))
start_time_minute := math.floor(str.tonumber(str.substring(time_range, 2, 4)))
timestamp(timezone, year(date_time, timezone), month(date_time, timezone), dayofmonth(date_time, timezone), start_time_hour, start_time_minute, 0)
p_comm_time_range_to_end_unix_time(string time_range, int date_time = time, string timezone = syminfo.timezone) =>
int end_time_hour = na
int end_time_minute = na
if str.length(time_range) == 11
end_time_hour := math.floor(str.tonumber(str.substring(time_range, 6, 8)))
end_time_minute := math.floor(str.tonumber(str.substring(time_range, 9, 11)))
else if str.length(time_range) == 9
end_time_hour := math.floor(str.tonumber(str.substring(time_range, 5, 7)))
end_time_minute := math.floor(str.tonumber(str.substring(time_range, 7, 9)))
timestamp(timezone, year(date_time, timezone), month(date_time, timezone), dayofmonth(date_time, timezone), end_time_hour, end_time_minute, 0)
p_comm_timeframe_to_seconds(simple string tf) =>
float seconds = 0
tf_lower = str.lower(tf)
value = str.tonumber(str.substring(tf_lower, 0, str.length(tf_lower) - 1))
if str.endswith(tf_lower, 's')
seconds := value
else if str.endswith(tf_lower, 'd')
seconds := value * 86400
else if str.endswith(tf_lower, 'w')
seconds := value * 604800
else if str.endswith(tf_lower, 'm')
seconds := value * 2592000
else
seconds := str.tonumber(tf_lower) * 60
seconds
p_custom_sources() =>
[open, high, low, close, volume]
//#endregion —————————————————————————————————————————————————————————————————
//#region —————————————————————————————————————————————————— Ta Dependence
p_ta_vwap(series float source, simple string anchor_timeframe, series float stdev_mult) =>
anchor = timeframe.change(anchor_timeframe)
[vwap, upper, lower] = ta.vwap(source, anchor, stdev_mult)
[vwap, upper, lower]
//#endregion —————————————————————————————————————————————————————————————
//#region —————————————————————————————————————————————————— Constants
// Input Groups
string P_GP_1 = ""
//#endregion —————————————————————————————————————————————————————————
//#region —————————————————————————————————————————————————— Inputs
//#endregion ———————————————————————————————————————————————————————
//#region —————————————————————————————————————————————————— Price Data
//#endregion ———————————————————————————————————————————————————————————
//#region —————————————————————————————————————————————————— Indicators
[p_ind_1_vwap, p_ind_1_upper, p_ind_1_lower] = p_ta_vwap(hlc3, "1D", 1) // VWAP
//#endregion ———————————————————————————————————————————————————————————
//#region —————————————————————————————————————————————————— Conditions
//#endregion ———————————————————————————————————————————————————————————
//#region —————————————————————————————————————————————————— Indicator Plots
// VWAP
plot(p_ind_1_vwap, title="VWAP", color=color.rgb(41, 98, 255, 0), linewidth=1)
p_ind_1_upper_plot = plot(p_ind_1_upper, title="VWAP - Upper Band", color=color.rgb(76, 175, 80, 0), linewidth=1)
p_ind_1_lower_plot = plot(p_ind_1_lower, title="VWAP - Lower Band", color=color.rgb(76, 175, 80, 0), linewidth=1)
fill(p_ind_1_upper_plot, p_ind_1_lower_plot, color=color.rgb(76, 175, 80, 95), title="VWAP - Background")
//#endregion ————————————————————————————————————————————————————————————————
//#region —————————————————————————————————————————————————— Custom Plots
//#endregion —————————————————————————————————————————————————————————————
//#region —————————————————————————————————————————————————— Alert
//#endregion ——————————————————————————————————————————————————————
Advantages of the VWAP
Using VWAP offers several advantages that make it an essential tool for traders:
- Benchmark for Trade Execution: VWAP serves as a benchmark against which traders can evaluate their execution prices. Buying below the VWAP or selling above it can indicate favorable trade execution.
- Market Sentiment Indicator: By analyzing whether prices are above or below VWAP, traders can gain insights into market sentiment and adjust their strategies accordingly.
- Volume Sensitivity: Since VWAP incorporates volume into its calculation, it provides a more accurate representation of market value compared to simple averages. This sensitivity helps traders identify significant price movements driven by high trading volumes.
- Institutional Use: Many institutional traders rely on VWAP to minimize market impact when executing large orders. Understanding how institutions use this indicator can provide retail traders with valuable insights into potential price movements.
VWAP in Trading Strategies��
VWAP can be integrated into various trading strategies to enhance decision-making:
- Intraday Trading: Day traders commonly use VWAP to identify intraday trends and establish entry and exit points based on real-time price movements relative to the average.
- Combining with Other Indicators: Incorporating VWAP with other technical indicators—such as moving averages or momentum indicators—can provide more robust trading signals and improve overall strategy effectiveness.
- Automated Trading Systems: Many algorithmic trading systems utilize VWAP as part of their execution strategy, allowing for precise entry and exit points based on real-time calculations.
- Anchored VWAP: This variation allows traders to anchor the VWAP calculation to significant price points (e.g., earnings announcements) for better insight into market reactions around those events.
Limitations of the VWAP
While VWAP is a powerful tool, it comes with certain limitations:
- Lagging Indicator: As a cumulative indicator based on historical data, VWAP may lag behind current market movements. This delay can lead to missed opportunities in fast-moving markets.
- Single-Day Focus: Since VWAP resets daily, it may not be effective for longer-term analysis or trends that span multiple days. Traders should consider this limitation when developing their strategies.
- Sensitivity to Low Volume: In illiquid markets or during periods of low trading volume, the reliability of the VWAP can diminish, leading to distorted signals that do not accurately reflect market sentiment.
- Potential for Manipulation: Large trades can significantly impact the VWAP calculation, potentially skewing its representation of true market value during volatile periods.
Conclusion
The Volume Weighted Average Price (VWAP) is an invaluable tool for both institutional and retail traders seeking to navigate complex market dynamics. By incorporating volume into its calculation, VWAP provides a nuanced view of asset pricing that aids in identifying trends, support and resistance levels, and optimal entry and exit points.
If you're ready to elevate your trading strategy using Volume Weighted Average Price (VWAP), start experimenting with Pine Script today! Explore different strategies, backtest your ideas, and engage with fellow traders to share insights. Remember, mastering tools like VWAP takes practice—so dive in and start enhancing your trading toolkit now!