Drawing Lines with Pine Script: A Comprehensive Guide
Pine Script, a powerful programming language used in TradingView, allows users to create custom indicators and strategies by drawing lines directly on charts. The line.new() function is a key tool for this purpose, enabling users to visualize trends, support levels, and resistance levels dynamically. In this article, we’ll explore how to use Pine Script to draw lines effectively, enhancing your trading analysis and strategy development.
Understanding the line.new() Function
The line.new() function is used to create new line objects on a TradingView chart. It requires several parameters to define the line’s characteristics:
- x1 and x2: These represent the starting and ending points of the line, which can be based on the bar index or UNIX time, depending on the
xlocparameter. - y1 and y2: These denote the price values at the starting and ending points of the line.
- xloc: This determines whether
x1andx2are bar indices (xloc.bar_index) or UNIX times (xloc.bar_time). - extend: Controls how the line extends beyond the defined points. Options include
extend.none,extend.right,extend.left, andextend.both. - color: Specifies the line color.
- style: Defines the line style, such as solid, dotted, dashed, or arrow styles.
- width: Sets the line width in pixels.

Creating Custom Line Indicators Without Coding Knowledge
Don't worry if you can't code - there are now easy-to-use tools (Pineify) that help you create custom chart lines for trading. While Pine Script traditionally needs coding knowledge to set up lines with different styles and rules, new visual tools make this much simpler.
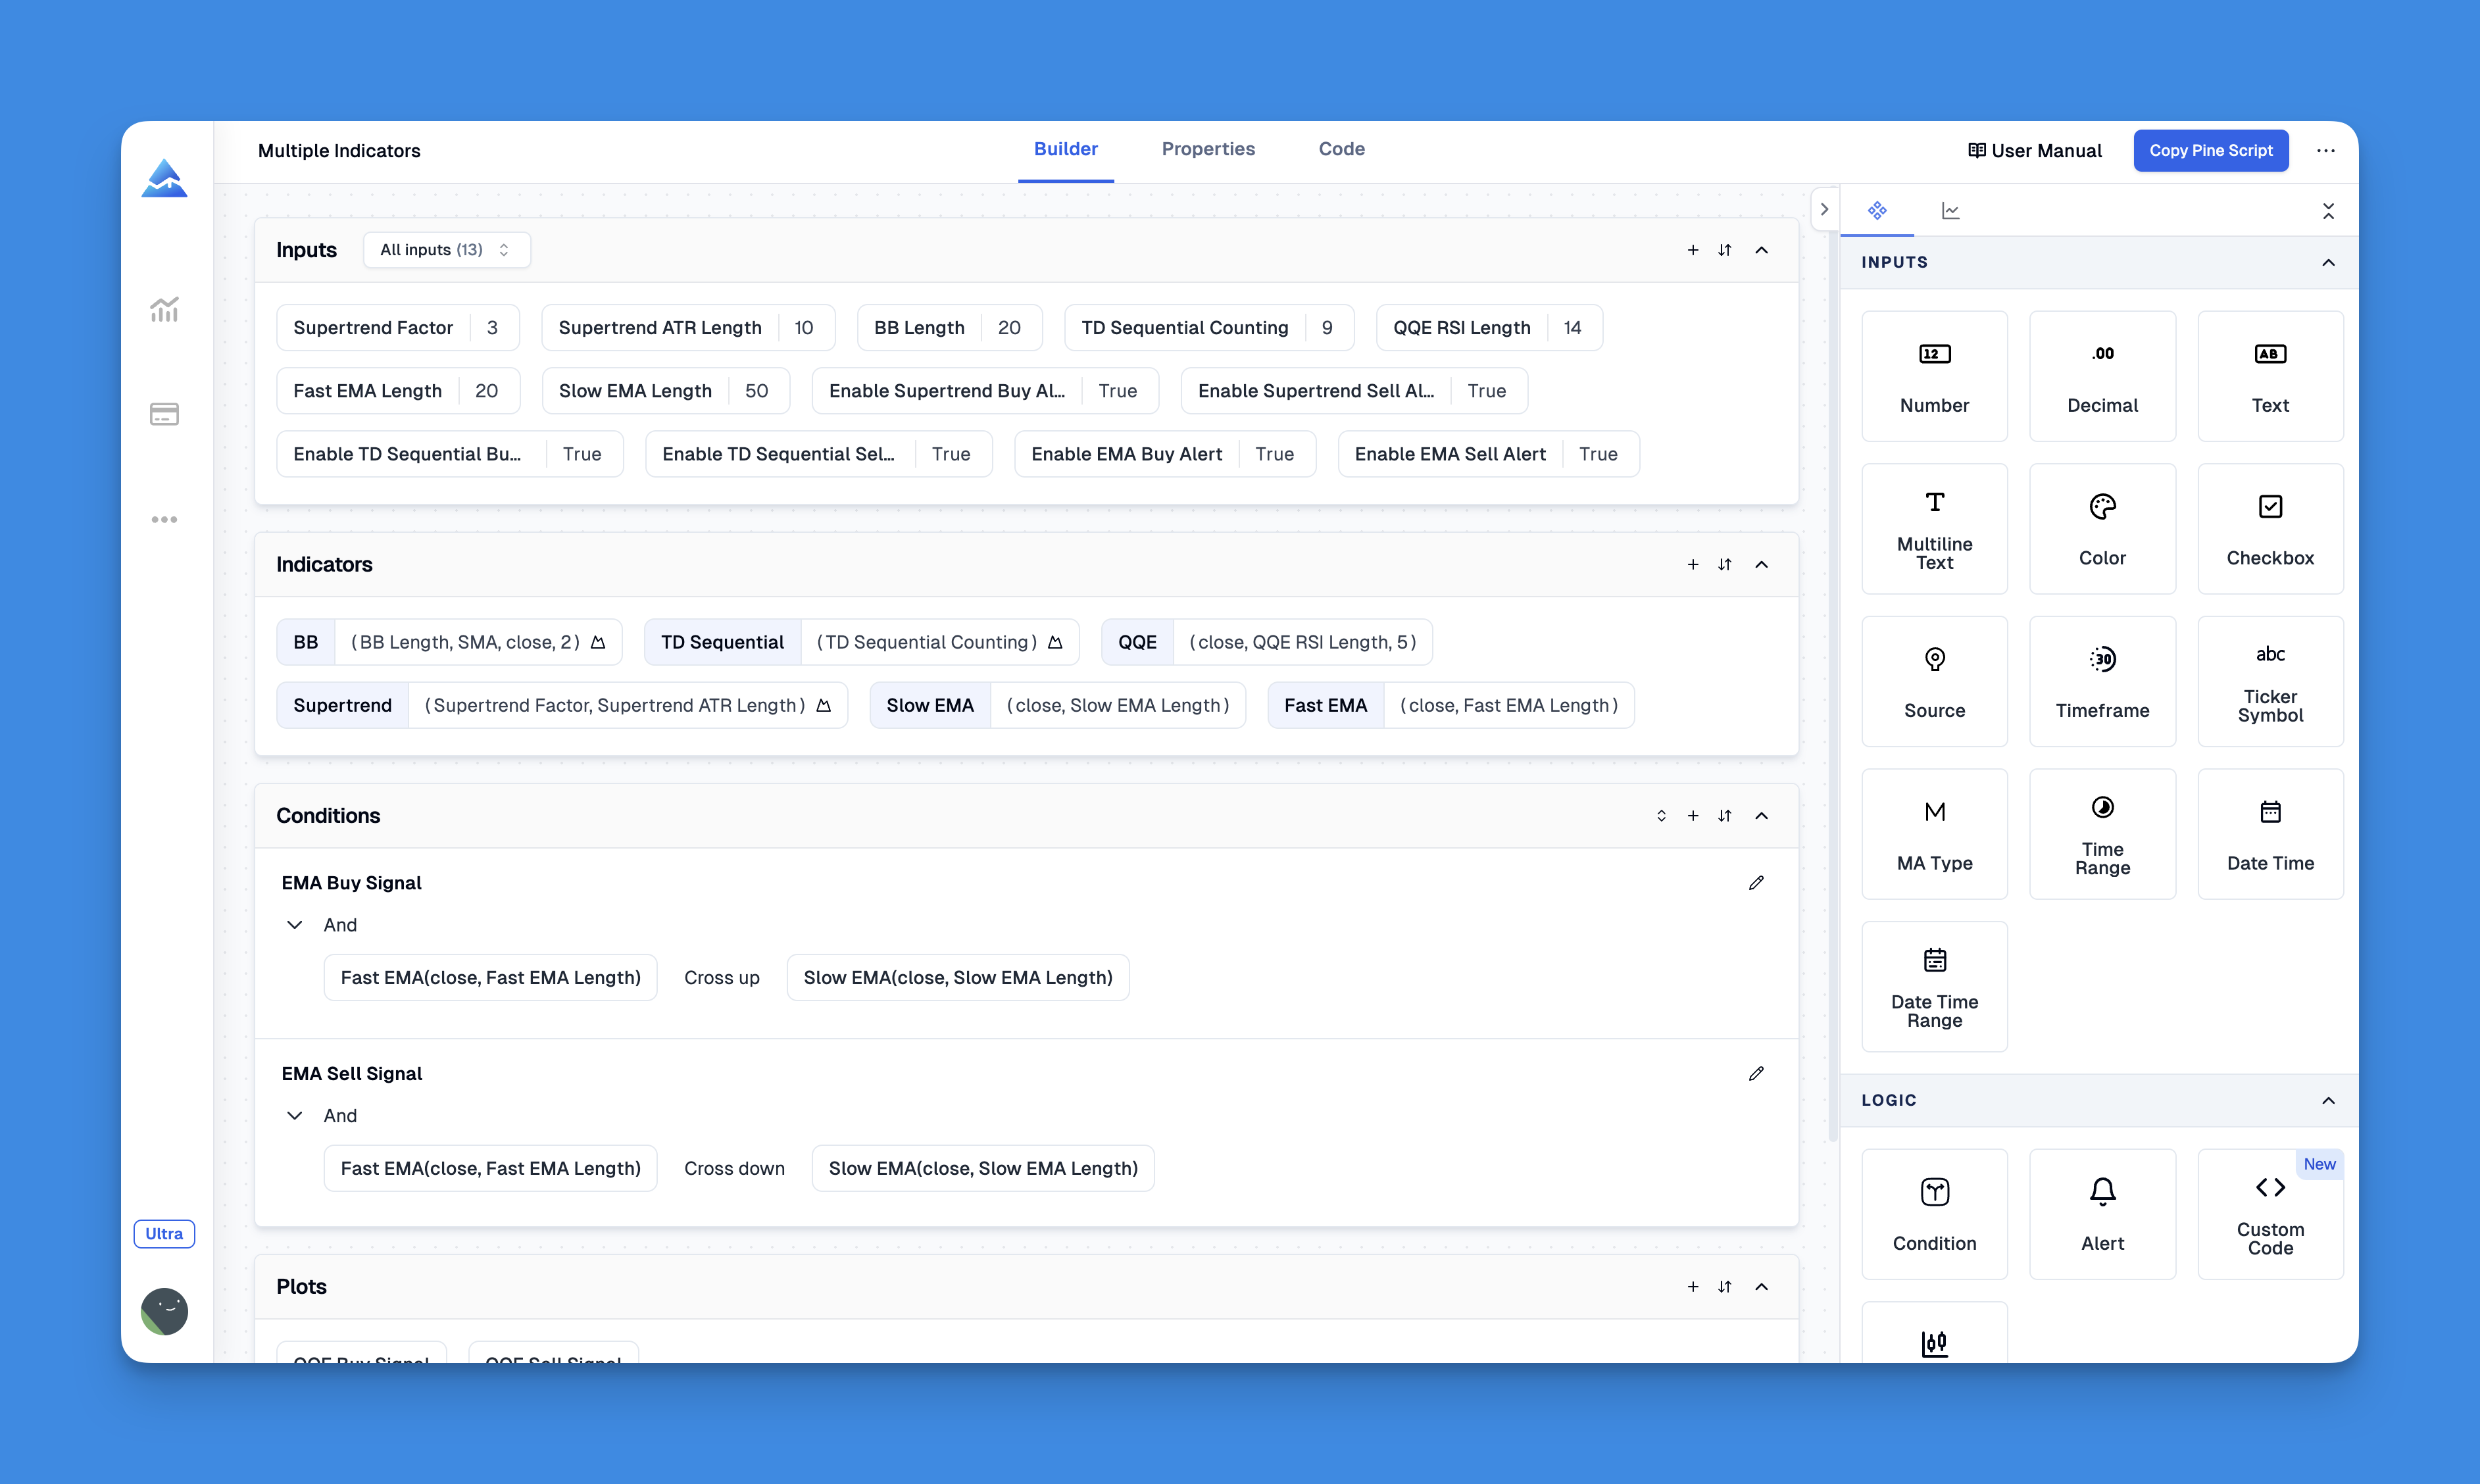
These visual tools let you draw all kinds of lines on your charts by clicking and selecting options - no coding required. You can create trend lines, support and resistance levels, moving averages, Bollinger Bands, and other custom lines through a simple menu system. Just choose the type of line you want, set up your preferences using simple options, and specify when you want the lines to appear on your charts.
Website: Pineify
Click here to view all the features of Pineify.Practical Applications of Drawing Lines
Drawing lines in Pine Script is essential for various trading strategies:
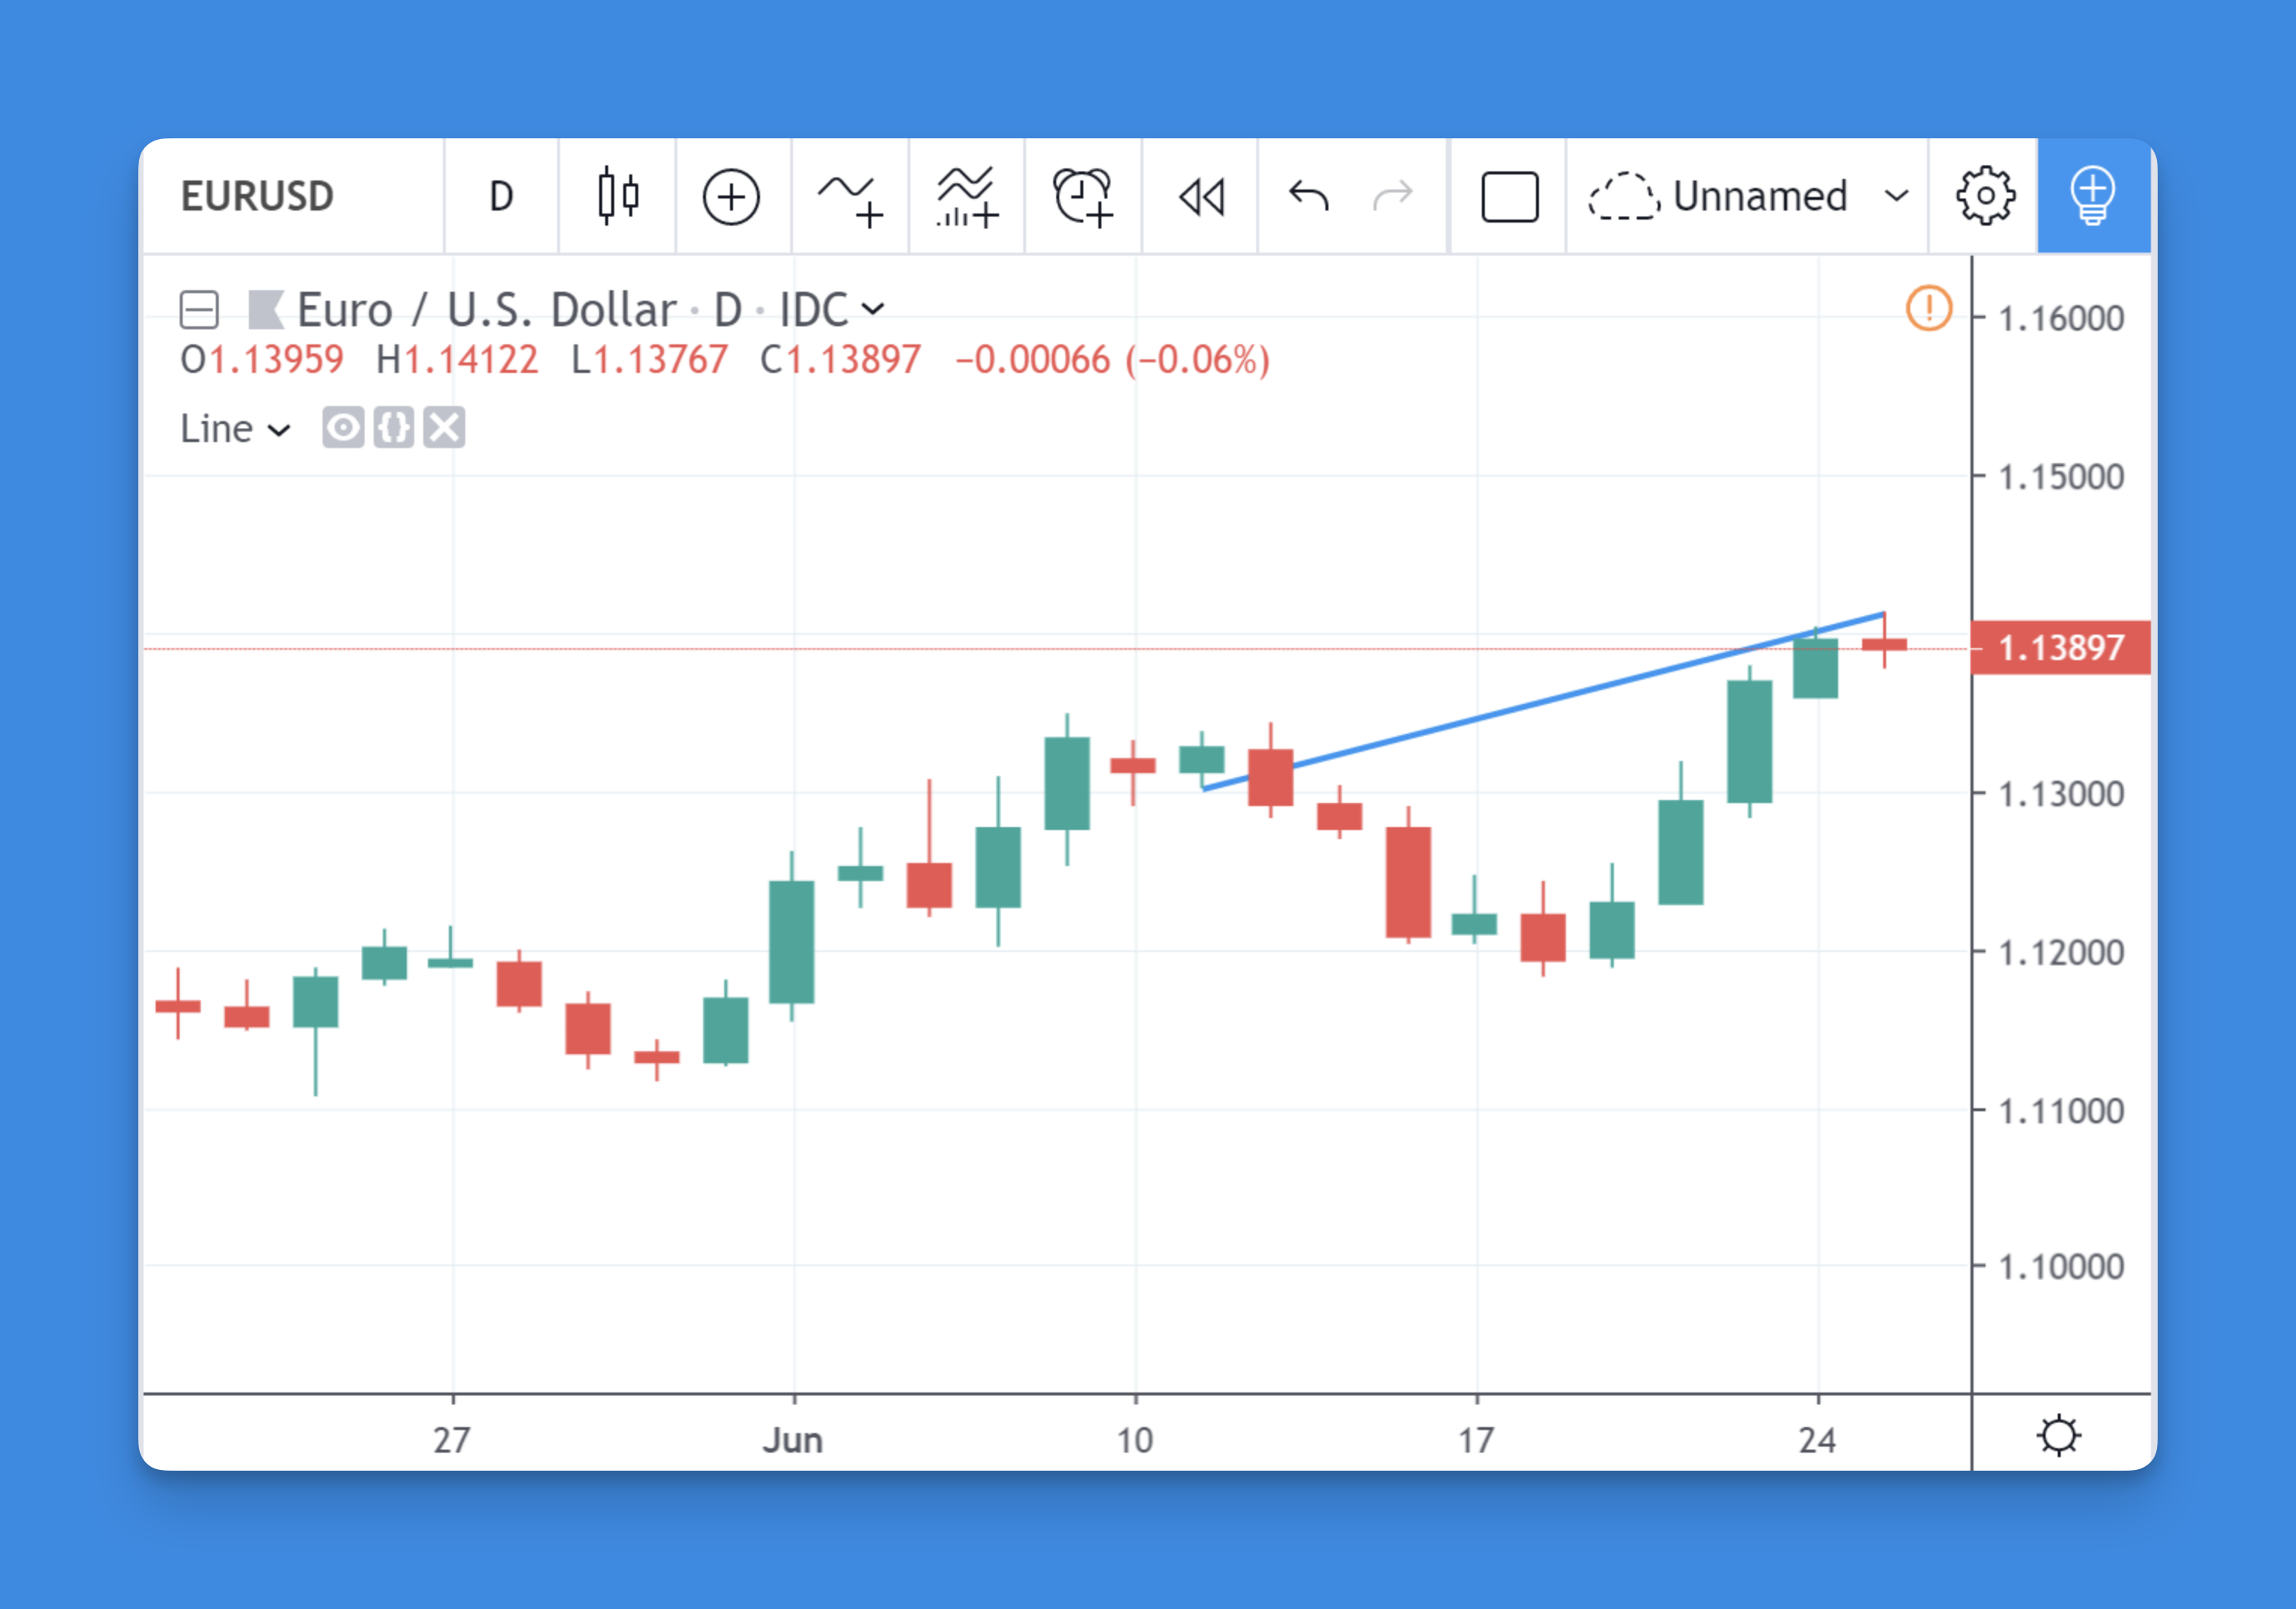
- Trend Lines: Use
line.new()to connect highs or lows over time, visualizing trends. - Support and Resistance: Plot horizontal lines at key price levels to identify potential support and resistance areas.
- Custom Indicators: Integrate lines into custom indicators to highlight specific market conditions or patterns.
Example Code for Drawing Lines
Here’s a simple example of how to draw a line from the low of the current bar to the high of the next bar:
//@version=5
indicator("Line Example")

var line line1 = na

if barstate.islast
    line1 := line.new(bar_index, low, bar_index + 1, high, extend=extend.right)
Tips for Effective Line Drawing
- Use Meaningful Colors: Differentiate between lines by using distinct colors to represent different types of trends or levels.
- Adjust Line Styles: Use dotted or dashed lines for less prominent levels and solid lines for key trends.
- Experiment with Extensions: Use
extend.rightorextend.leftto draw rays that highlight future price movements.
Conclusion
Drawing lines with Pine Script is a powerful way to enhance your trading strategies and visualizations. By mastering the line.new() function, you can create dynamic and informative charts that help you make better trading decisions.