Multiple EMA Indicator: Five Moving Averages for Trend Analysis
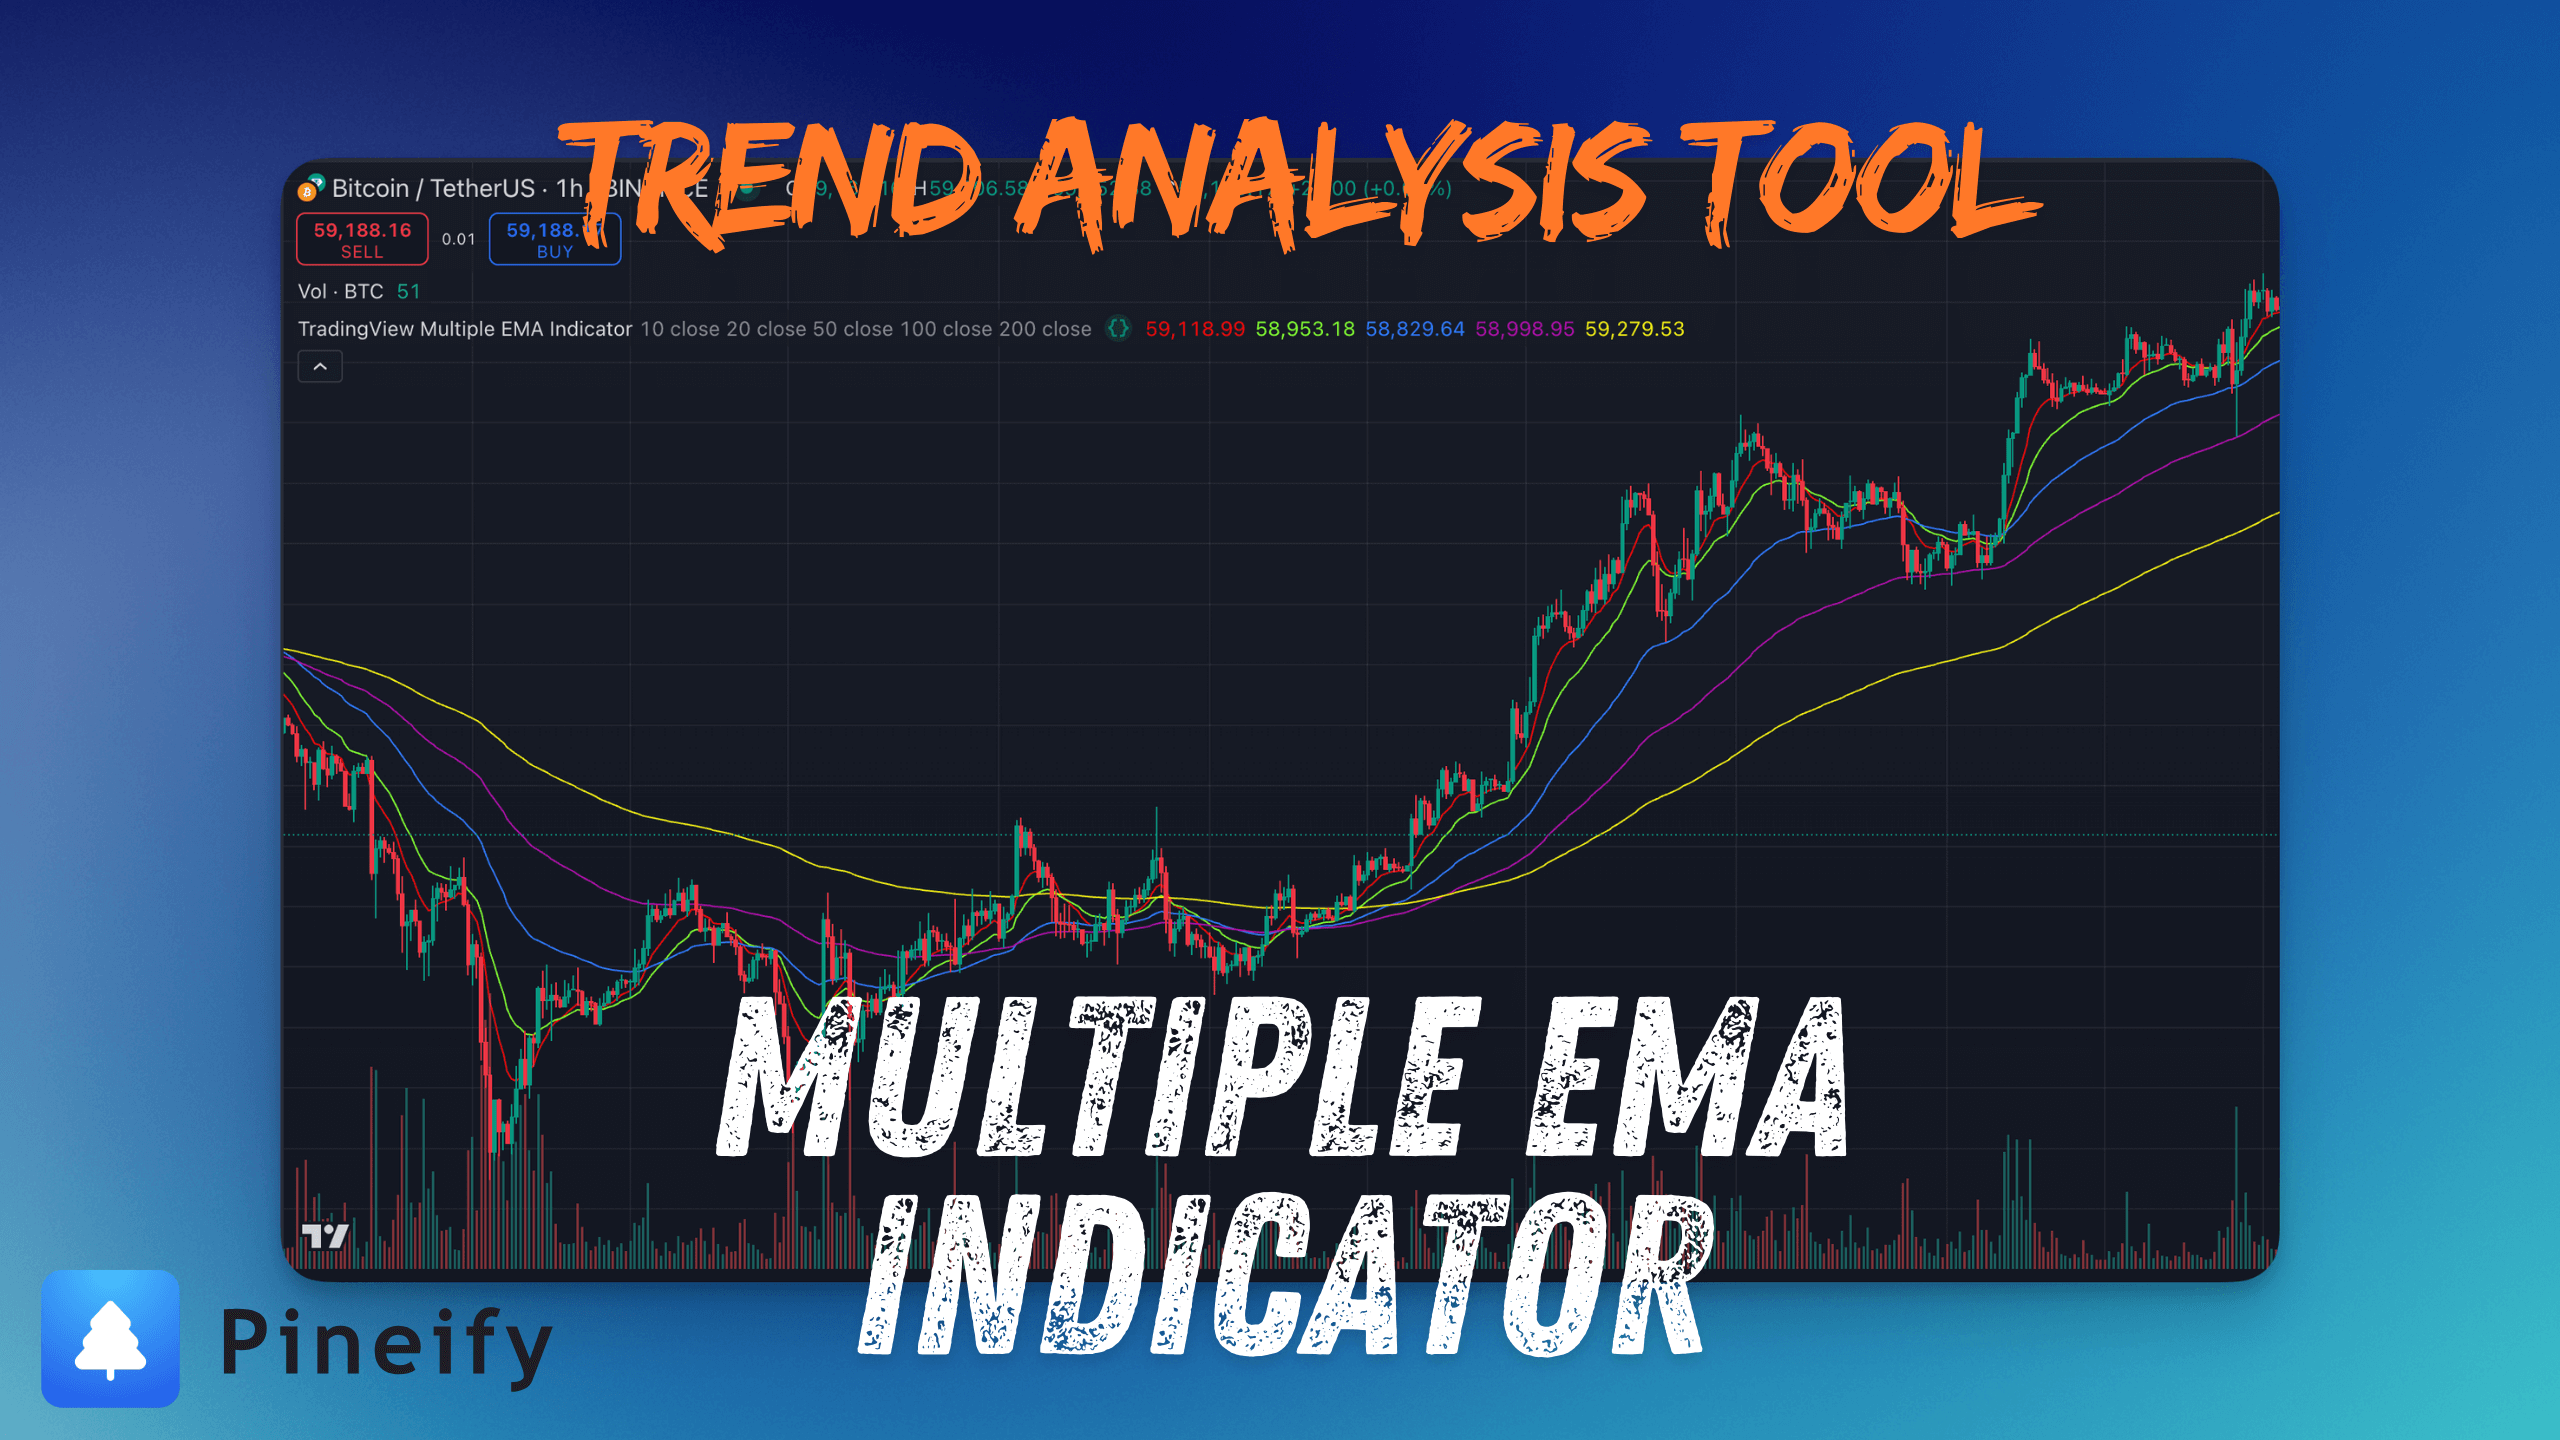
The Multiple EMA Indicator is a TradingView tool that plots five exponential moving averages—typically the 10, 20, 50, 100, and 200-period—on the price chart at once. It gives you short-term reaction speed, medium-term context, and long-term trend direction without flipping between windows.
Ever feel like you're drowning in charts, constantly switching between timeframes just to figure out what the market's really doing? Yeah, me too. That's exactly why I started using this setup instead of juggling five separate indicators.
 👉 Copy Indicator Script
Why This Setup Works
I've tried tons of indicators over the years, and most either overcomplicate things or tell you stuff you already knew. This one's different.
Five EMAs, five time perspectives. Each moving average represents a different timeframe's read on where the market's headed. The 10-period EMA catches momentum shifts fast—good for entries. The 200-period EMA shows the big picture—better for trend confirmation. I watched NVDA's 10-period slice through the 50 on May 15, 2024, and that breakout ran another 12% before the daily close.
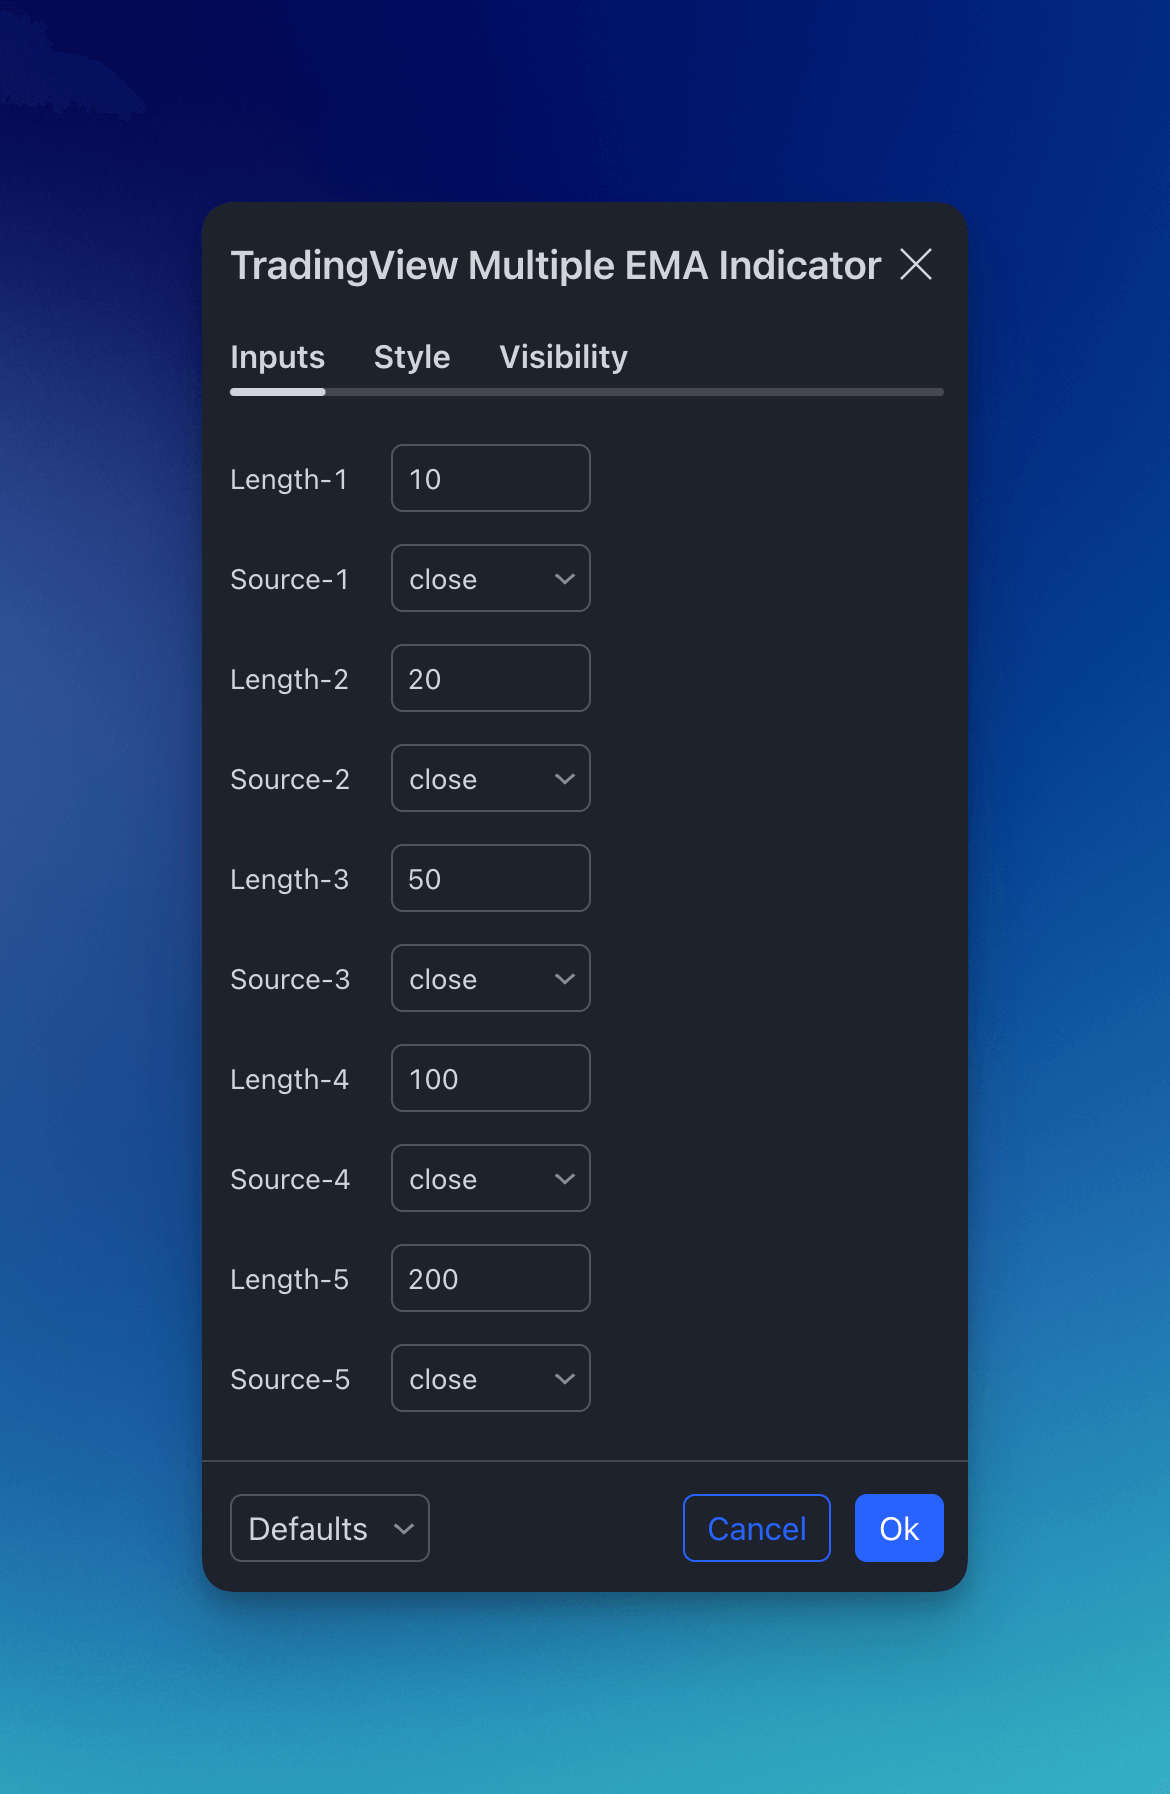
Customizable price sources. You can tell each EMA to look at opens, highs, lows, or closes. I prefer using high prices on the 10-period EMA during volatile M5 sessions—it catches reversals a candle or two earlier. I haven't tested this on forex pairs outside EUR/USD, so your mileage may vary.
Color coding saves time. Each line gets its own color. Sounds basic, but when you're reading five lines at once, you won't be squinting at the legend every five seconds.
Everything on one chart. No separate indicator windows. Clean, simple, effective.

The Default Setup
I typically configure the five EMAs this way, though you can tweak them:
- Red (10-period): Early warning for momentum shifts
- Green (20-period): Confirms what the 10-period tells you
- Blue (50-period): Separates short-term from medium-term trends
- Purple (100-period): Medium-term market sentiment
- Yellow (200-period): The trend heavyweight—price above this means bull territory
When they're all aligned (faster above slower), you've got a strong trend. When they start crossing, something's changing.
| EMA Period | Purpose | Typical Use Case |
|---|---|---|
| 10 | Fast momentum | Entry timing, scalping signals |
| 20 | Short-term confirmation | Trend filter for M15-H1 charts |
| 50 | Medium-term direction | Swing trade bias, pullback entries |
| 100 | Broader sentiment | Trailing stop reference |
| 200 | Major trend anchor | Position trade filter |
The EMA Formula
The exponential moving average gives more weight to recent prices than a simple moving average:
EMA = (Price × multiplier) + (previous EMA × (1 − multiplier))
Where multiplier = 2 ÷ (period + 1). For the 10-period EMA, the multiplier is 0.1818. For the 200-period, it's 0.00995. That's why the 200-period reacts much slower—it smooths out nearly all the daily noise.
Reading the Market
After using this setup for months, here are the patterns I trust.
The EMA Stack
When 10 > 20 > 50 > 100 > 200, that's a confirmed uptrend. Flip it and the bears are in control. Tightly bunched EMAs usually mean consolidation is coming.
Crossover Signals
The 10-period crossing the 20-period is your standard momentum shift. But I've seen the 10 rocket past the 50 in a single sweep—that's usually an explosive move. When TSLA did this on January 19, 2025, I added to my position and the stock gained 9% over the next three sessions.
I don't chase every crossover, though. In choppy markets, you'll get fakeouts. Wait for at least two EMAs to confirm.
Dynamic Support and Resistance
These EMAs act as moving support and resistance levels. I've seen price bounce off the 50-period EMA countless times. The 200-period is especially sticky—BTC/USD touched it four times in February 2025 and reversed each time within 2%.
The Spacing Tell
When EMAs are tight together, the market is consolidating. When they spread apart, volatility's picking up and a strong trend is developing. This is one pattern I check before touching any leveraged position.
Combining with Other Indicators
I pair this with volume analysis to confirm whether EMA crossovers have real backing. High volume during a crossover usually means the move has legs.
For momentum checks, RSI tells me when price is stretched too far from the EMA cluster. And when I'm looking for entries, Bollinger Bands help time the bounce back toward the EMA stack.
By Trading Style
Day Trading: Focus on the 10 and 20-period EMAs. When price pulls back to the 20-period in a strong trend, that's your entry window. I don't use the 200-period here—it's too slow to matter on M5.
Swing Trading: The 50 and 100-period EMAs work best. Use them as trailing stops. I set mine two ticks below the 50-period in uptrends.
Position Trading: Stay long above the 200-period EMA, stay out below it. That's it.
Common Mistakes
Don't chase every crossover. I've made that mistake plenty of times. In ranging markets, crossovers happen constantly and mean nothing. Wait for multiple EMAs to agree.
EMAs lag. That's by design. They confirm trends, they don't predict them. If you're waiting for a full EMA stack to form before entering, you'll miss the first 5-10% of a move. I accept that tradeoff because the confirmation saves me from bigger losses.
Don't ignore the bigger picture. The 10-period pointing up is irrelevant if price is below the 200-period and the 200 is sloping down.
Adjusting for Market Conditions
- Volatile markets: Lengthen periods to 12, 26, 55, 110, 220 to filter noise
- Trending markets: Default settings work fine
- Sideways markets: Switch faster EMAs to high/low price sources for earlier signals
No indicator is perfect, and this isn't a magic wand. But if you're tired of flipping between charts, five EMAs on a single pane give you a cleaner read on market trends than most multi-window setups I've tested.
▶What is the Multiple EMA indicator in TradingView?
It plots five exponential moving averages—usually 10, 20, 50, 100, and 200-period—on your price chart. You get short-term, medium-term, and long-term trend info without switching between separate windows.
▶How do you read the EMA stack for trend direction?
When faster EMAs sit above slower ones (10 above 20, 20 above 50, and so on), you're in an uptrend. Flip that order and it's a downtrend. A mixed or bunched stack usually means the market is deciding where to go next.
▶Which EMA crossovers matter for entries?
The 10-period crossing the 20-period is the most common signal for short-term momentum. A bigger move often follows when the 10 sweeps straight through the 50 in one go. I always wait for a second EMA to confirm before I enter.
▶Can I customize EMA periods and price sources in Pineify?
Yes. Pineify lets you set each of the five EMAs to any period length and pick a different price source per line. Using high instead of close on the faster EMAs can give earlier signals during volatile sessions.
▶How does the Multiple EMA indicator act as support and resistance?
Price regularly pulls back to the 50 or 200-period EMA and bounces off them in trending markets. Traders use these as dynamic support in uptrends and dynamic resistance in downtrends, which helps with stop-loss placement and re-entry timing.
▶What's the difference between golden cross and death cross here?
The golden cross happens when the 50-period EMA moves above the 200-period—a long-term bullish shift. The death cross is the reverse. Having all five EMAs visible lets you see these forming before they complete.
▶Which EMA periods work for day trading versus swing trading?
Day traders get the most from the 10 and 20-period EMAs. Swing traders rely on the 50 and 100-period for pullback entries and trailing stops. Position traders use the 200-period as their primary trend filter.