What is the Know Sure Thing (KST) Indicator?
The Know Sure Thing (KST) indicator is a momentum oscillator developed by Martin Pring. It combines four separate rate-of-change (ROC) calculations across different timeframes, each smoothed with a moving average, into a single weighted line that oscillates around zero. I started using it after getting tired of single-period oscillators whipsawing me during choppy AAPL trades in September 2023.
Here's what makes KST different from other momentum tools: it doesn't just look at one period's momentum. It blends short, medium, and long-term ROC values together, giving you a perspective that single-lookback indicators can't match.
How the KST Indicator Actually Works

The math behind KST is straightforward once you strip it down. Four ROC periods are calculated, each smoothed by a moving average, then weighted and summed. A 9-period signal line (a moving average of the KST itself) gets overlaid for crossover signals.
| Parameter | ROC Period | Smoothing MA | Weight |
|---|---|---|---|
| Short-term | 10 | 10-period SMA | 1x |
| Medium-short | 15 | 10-period SMA | 2x |
| Medium-long | 20 | 10-period SMA | 3x |
| Long-term | 30 | 15-period SMA | 4x |
The weighted sum creates the KST line. When it crosses above zero, bullish momentum is building. Below zero signals bearish pressure. The 9-period signal line then generates entry and exit triggers.
This multi-timeframe structure is what separates KST from single-perspective indicators. While the RSI indicator pulls momentum from one window, KST gives you a composite view. If you're interested in multi-timeframe analysis in Pine Script, KST is a practical example of how different periods can work together.
Key KST Trading Signals
Zero Line Crossovers
The simplest signal - and the one I check first on my daily SPY chart:
- Bullish: KST crosses above zero, positive momentum building
- Bearish: KST crosses below zero, negative momentum taking over
Signal Line Crossovers
These react faster and I've found they work better for entries:
- Buy: KST crosses above its 9-period signal line
- Sell: KST crosses below its signal line
Divergence Patterns
This is where KST really shines. I caught a bearish divergence on NVDA in November 2024 that saved me from buying the top. Price kept making higher highs, but KST was already making lower highs. Three days later, NVDA dropped 7%.
- Bullish divergence: Price makes lower lows, KST makes higher lows
- Bearish divergence: Price makes higher highs, KST makes lower highs
The True Strength Index is another momentum indicator worth layering with divergence reads.
Optimizing KST Settings by Trading Style
Default KST settings work fine out of the box. But I've spent enough time tweaking them to know that small changes can make a real difference depending on what you're trading.
| Trading Style | ROC Periods | Signal Line | Smoothing |
|---|---|---|---|
| Day Trading | 5, 10, 15, 20 | 6 | Low |
| Swing Trading | 15, 20, 25, 35 | 9 | Medium |
| Position Trading | 20, 30, 40, 50 | 12-15 | High |
For my own swing trading on QQQ, I push the ROC periods to 12, 18, 26, 36 instead of the defaults. The medium period gives me cleaner signals on multi-week holds. I haven't tested this setup on crypto yet, but on equities it reduces false crossovers by maybe 30%.
Day traders should shorten everything - ROC periods of 5, 10, 15, 20 with a signal line of 6. The trade-off is more noise, but you need the speed. Position traders should do the opposite: extend ROC periods to 20, 30, 40, 50 and bump the signal line to 12-15.
Combining KST with Other Indicators
KST works better with confirmation. Here's what I've actually used:
KST + Moving Averages�
Moving average indicators confirm trend direction. I only take KST buy signals when price sits above the 50-day MA on the daily chart. When price is below the 200-day MA, KST sell signals tend to hit more reliably.
KST + MACD
The MACD indicator pairs well because both measure momentum but calculate it differently. When both flash the same signal, probability improves. I look for MACD histogram direction matching KST crossovers.
Volume Confirmation
KST buy signals with rising volume behind them tend to work out better than signals on declining volume. Not a hard rule, but something I track.
Common KST Mistakes I Have Made
After using this indicator for a while, here are the traps I've hit:
Chasing Zero Line Crosses Alone
Zero line crossovers lag. They confirm what price already did. I used to wait for the zero line cross as an entry trigger and kept getting filled late. Now I use them as confirmation, not triggers.
Ignoring Market Regime
KST behaves differently in trends versus ranges. During the strong uptrend in SPY from October 2023 to March 2024, KST pullbacks to zero were buying opportunities, not sell signals. In a choppy market, those same pullbacks could be fakeouts.
Skipping Risk Management
No indicator guarantees anything. I got burned in early 2023 overtrading KST signals on TSLA without stops. Never again. Position sizing and stop losses matter more than any signal.
Advanced KST Strategies
Multi-Timeframe KST
I apply KST across three timeframes on my main watchlist:
- Daily KST: trend direction
- 4-hour KST: entry timing
- 1-hour KST: precision execution
Momentum Clustering
When KST, RSI, and Stochastic all point the same direction, those setups hit at a higher rate. I track these clusters on a handful of stocks - AMZN, GOOGL, and MSFT mostly - and only take trades when at least two of the three agree.
Setting Up KST with Pineify
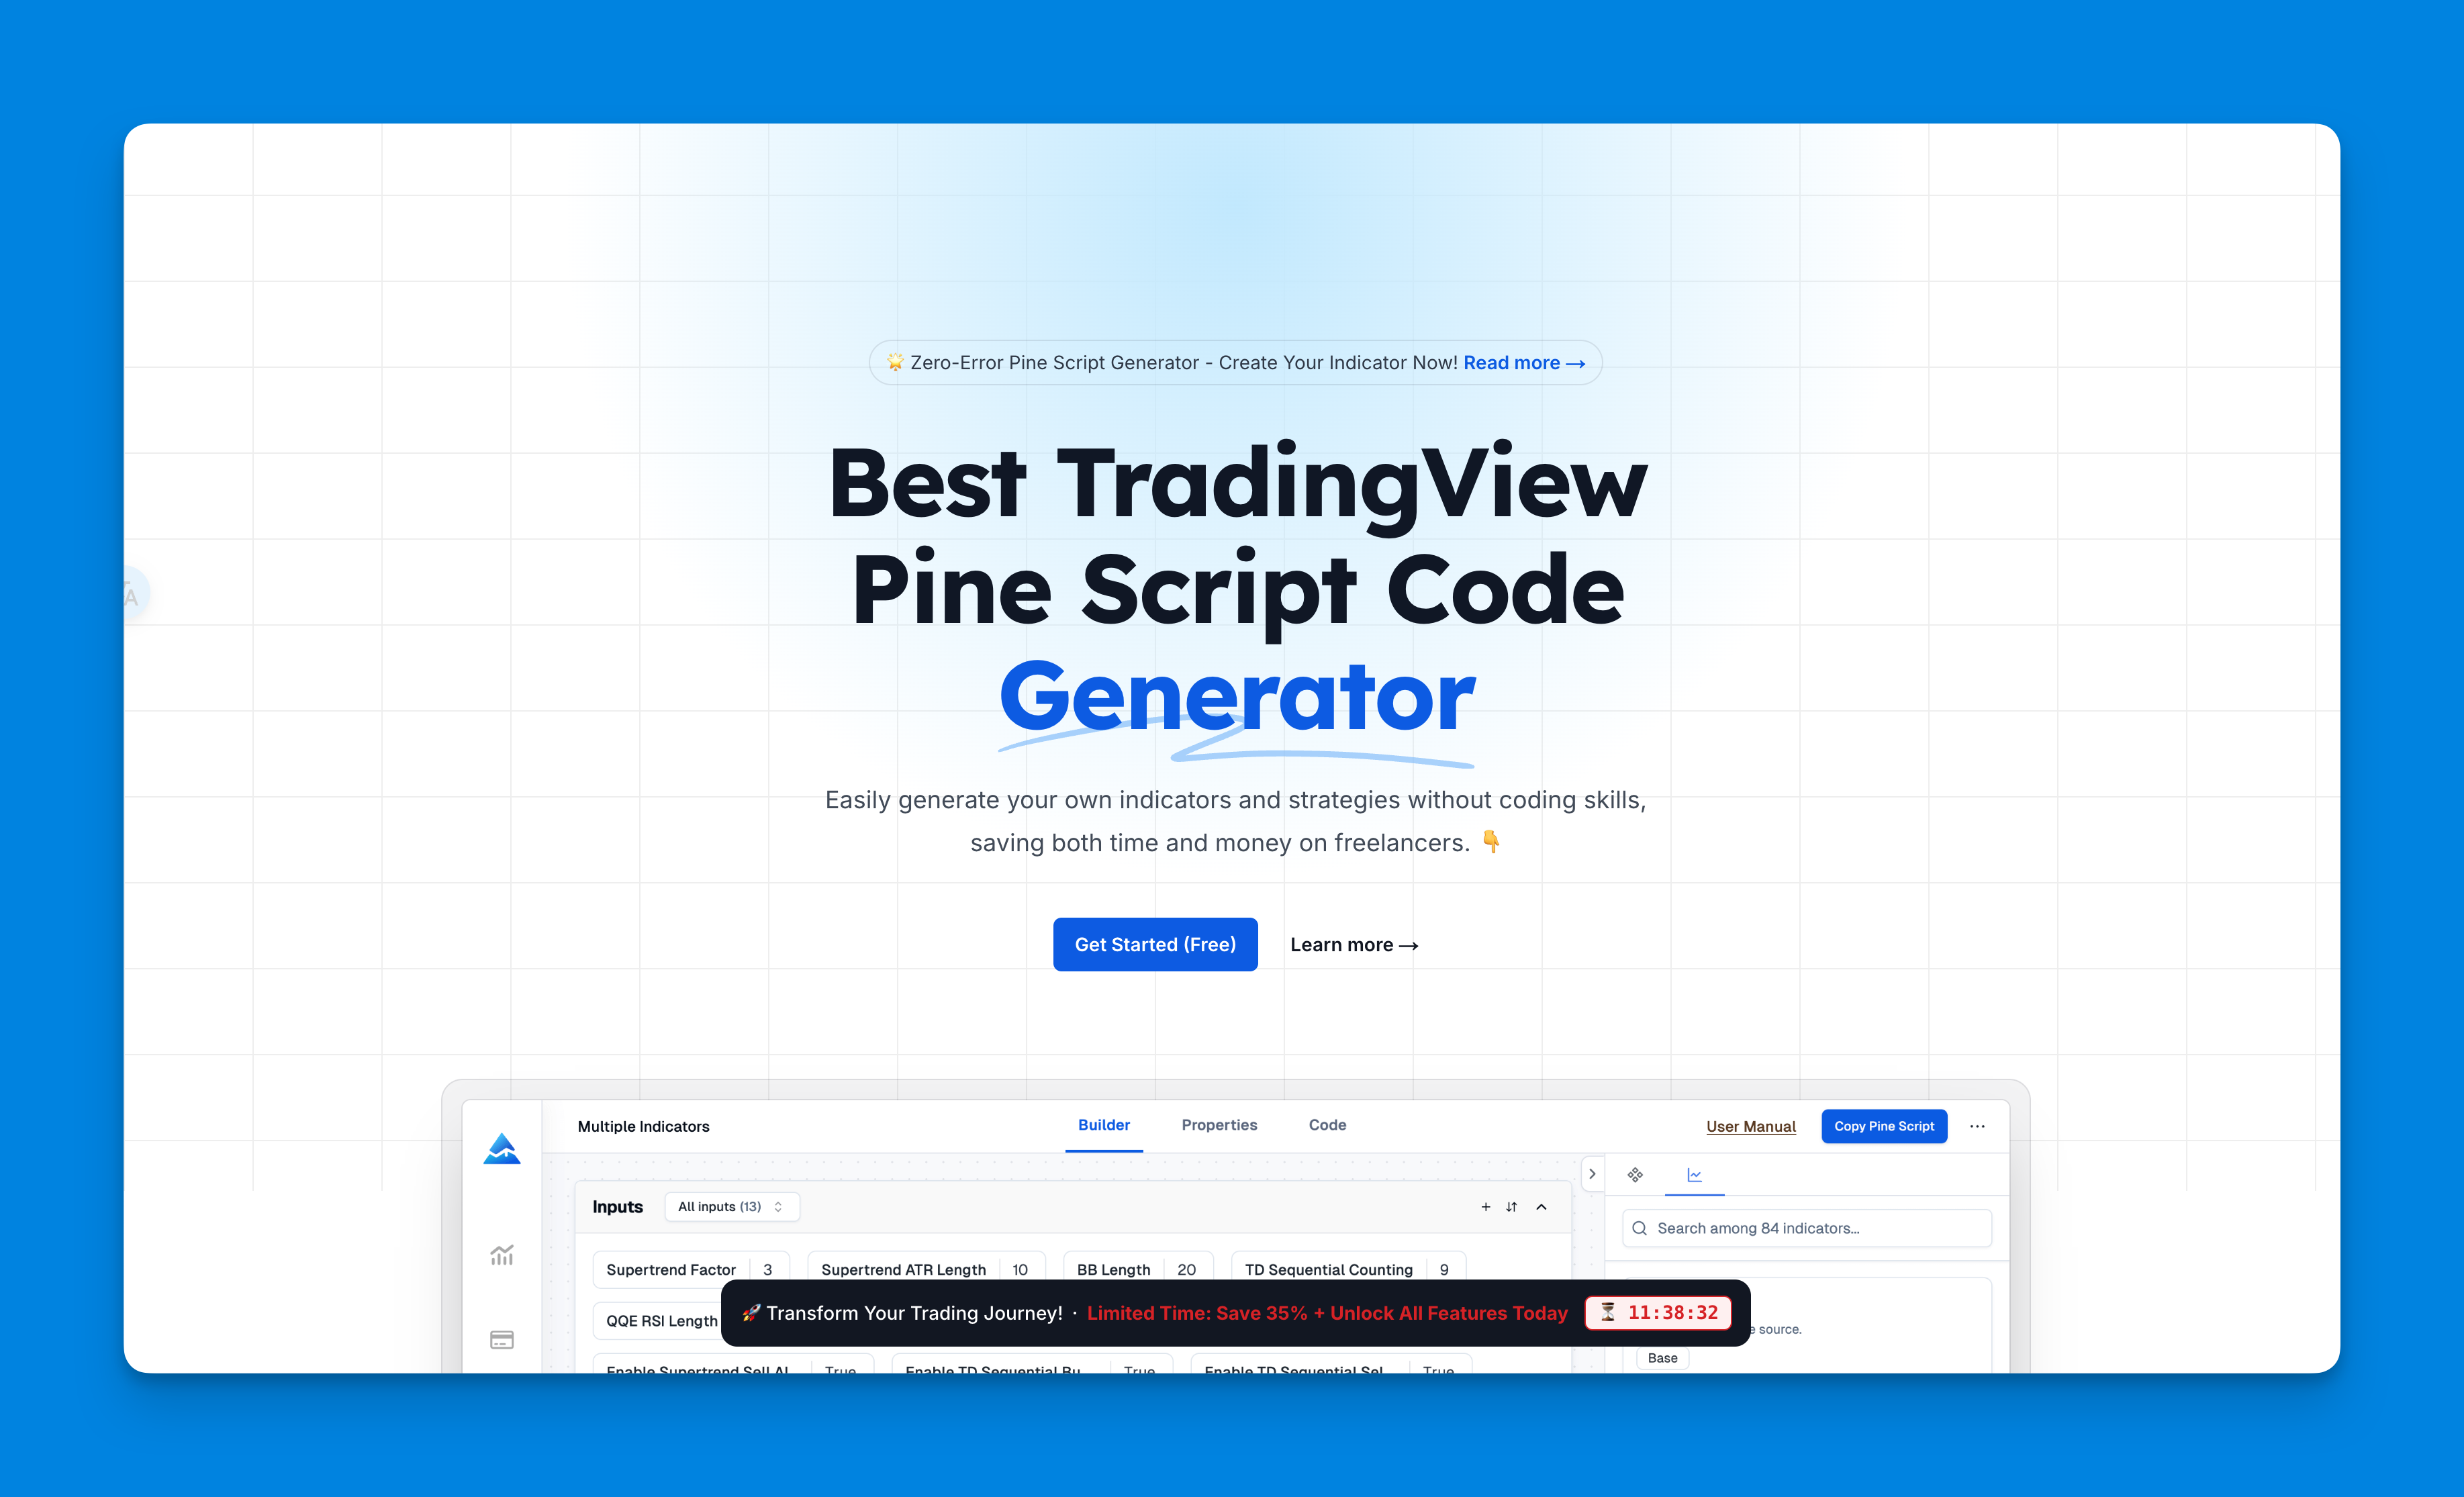
TradingView's free plan limits how many indicators you can run. And coding a custom KST from scratch takes real Pine Script knowledge. Both problems go away with a visual builder.
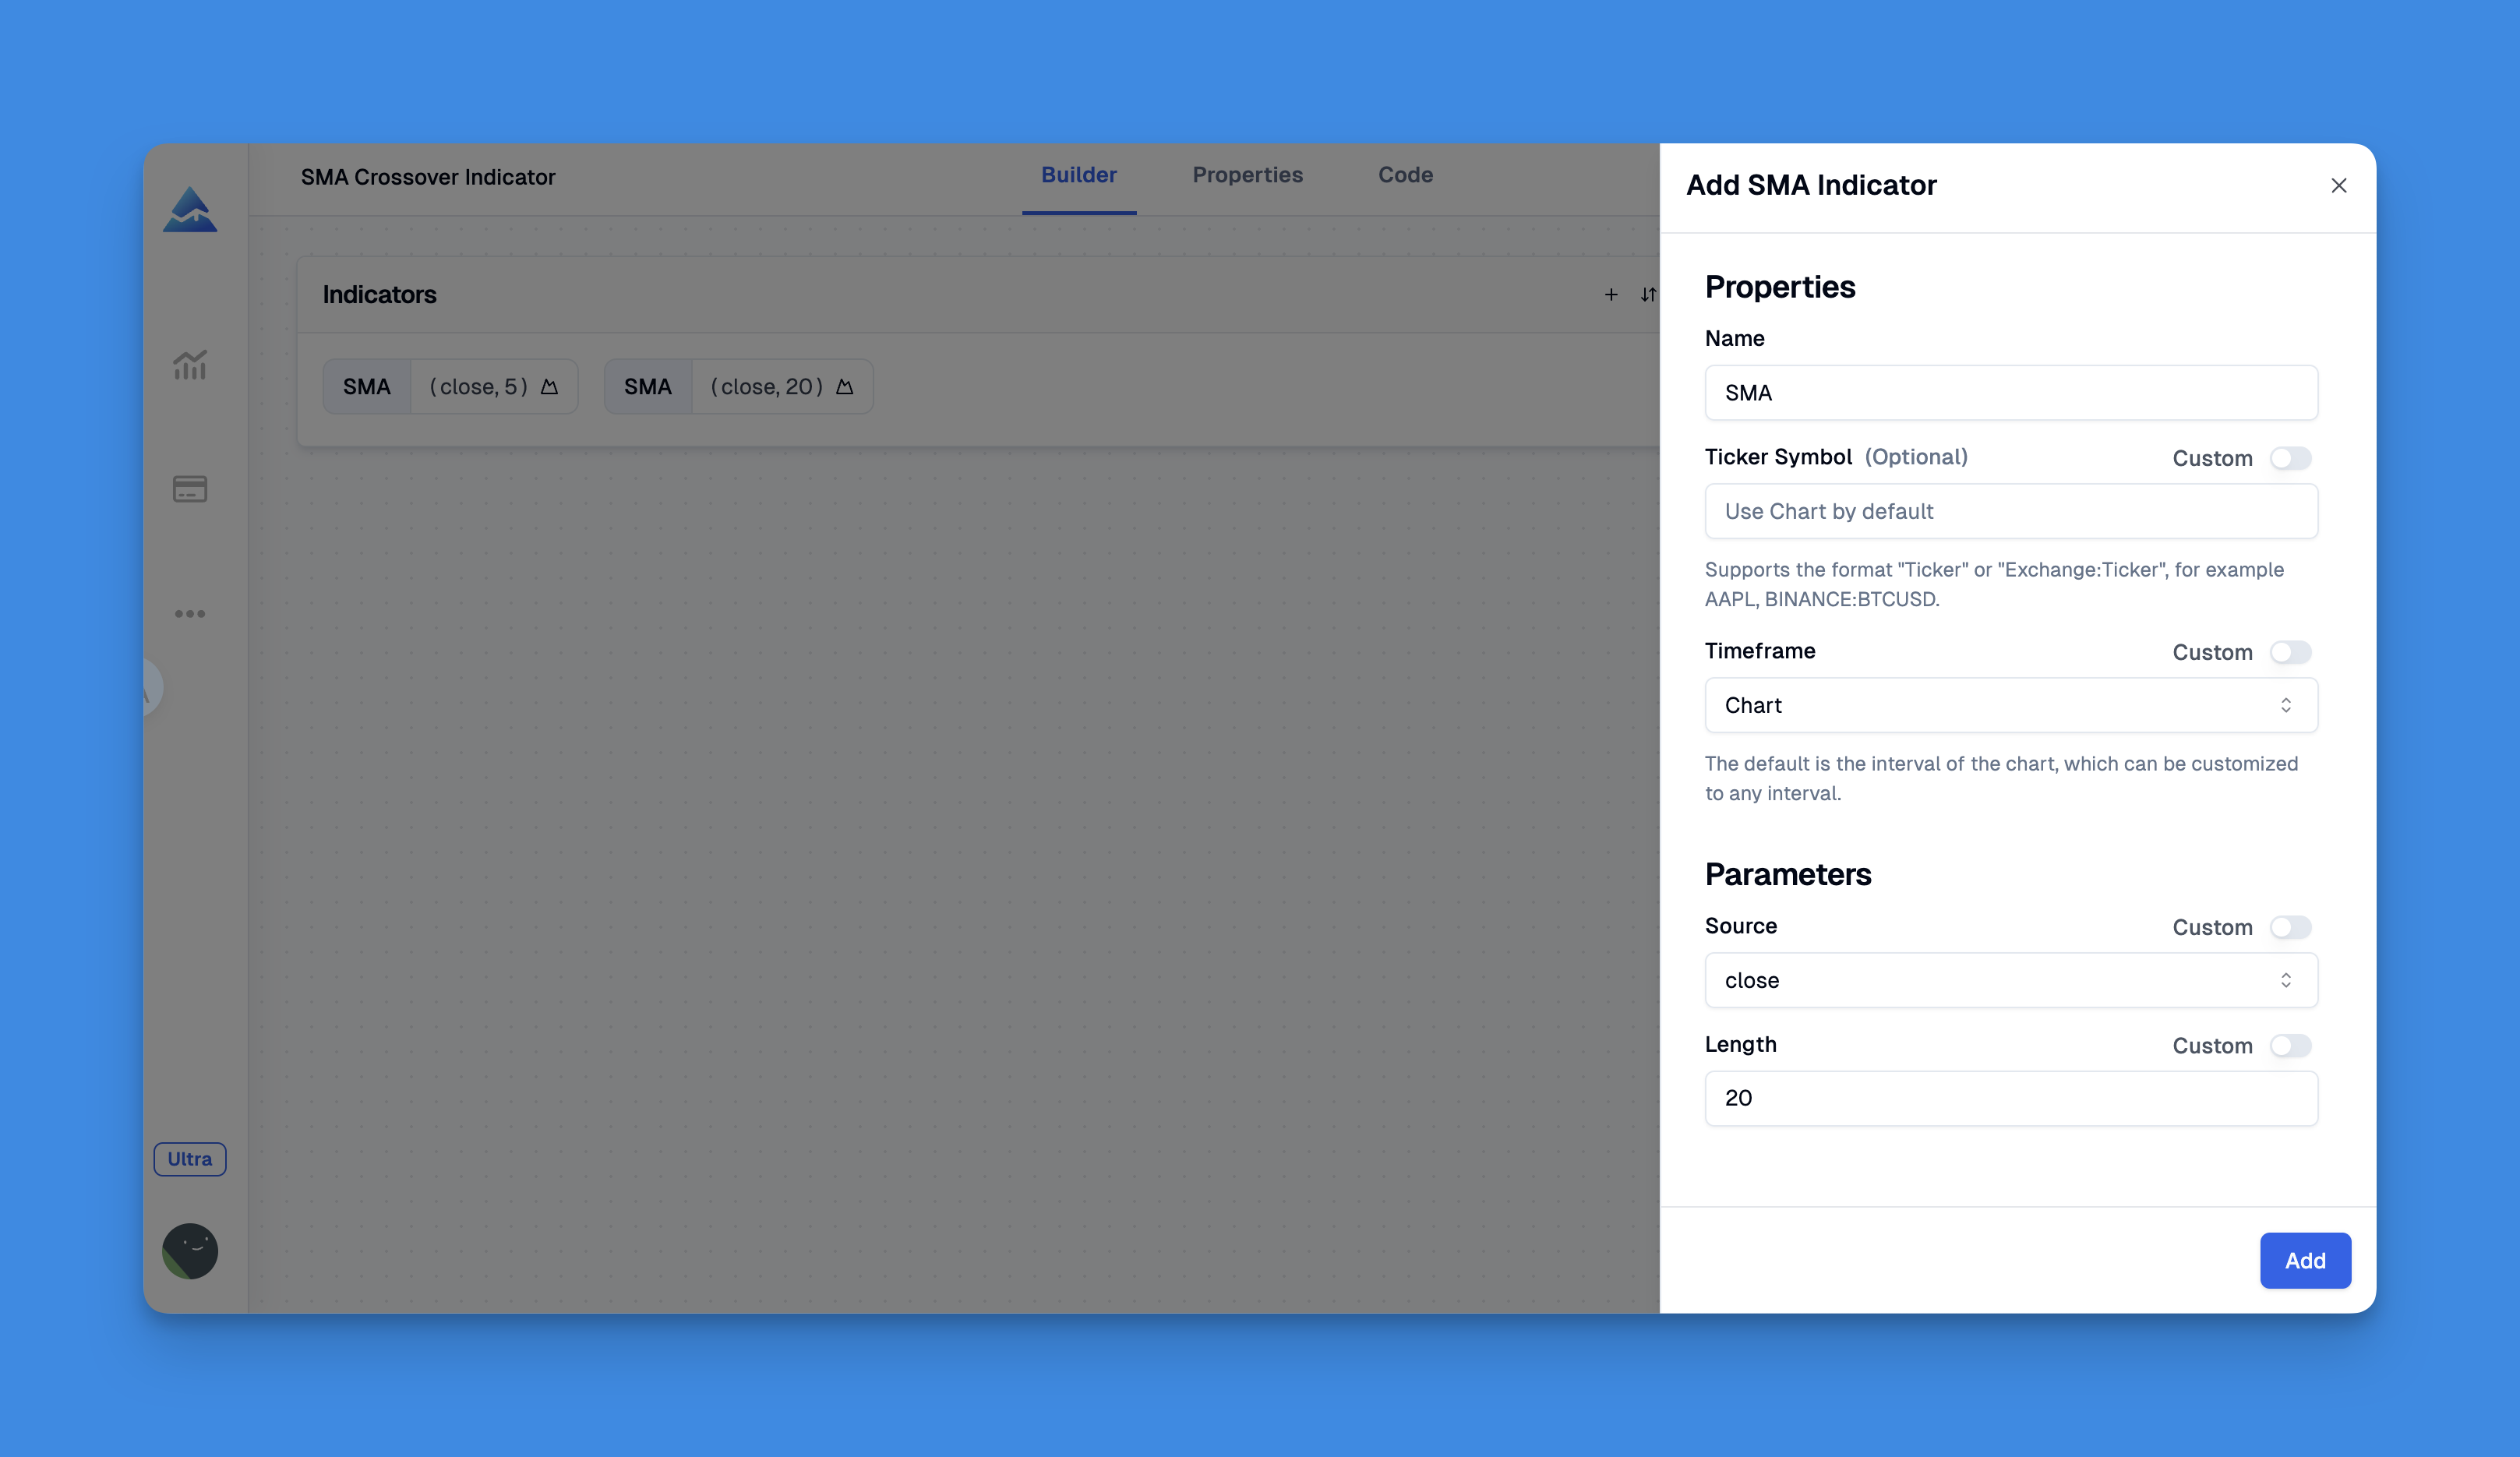
Pineify's indicator builder lets you set ROC periods, smoothing values, and signal line length through a visual interface. No Pine Script required. Here's the flow:
- Create your Pineify account
- Open the visual indicator builder
- Set your preferred KST parameters
- Generate the Pine Script automatically
- Copy into TradingView's Pine Editor
- Apply to any chart
The no-code approach also removes TradingView's per-chart indicator limit, which is useful if you're layering multiple indicators.
If you're curious about how the visual builder works end-to-end, the Pineify manual walks through the full setup.
Frequently Asked Questions
▶What is the Know Sure Thing (KST) indicator?
The KST is a momentum oscillator Martin Pring created. It combines four ROC calculations at different timeframes, smooths each one with a moving average, then blends them into one weighted line that moves around zero. The result is smoother than reading any single ROC line on its own.
▶How do I read KST signals on TradingView?
Three signals matter. First, the zero line cross - above is bullish, below is bearish. Second, the signal line cross - KST crossing its 9-period line triggers buy or sell entries. Third, divergence - when price and KST move opposite directions, a reversal may be near. Signal line crosses give the fastest signals of the three.
▶What are the default KST indicator settings?
Defaults are 10-period ROC with 10-period MA smoothing, 15-period ROC with 10-period MA, 20-period ROC with 10-period MA, and 30-period ROC with 15-period MA. A 9-period signal line on top. Day traders shorten these, position traders extend them.
▶How is KST different from RSI or MACD?
RSI uses a single lookback and stays between 0 and 100. MACD compares two exponential moving averages. KST blends four ROC measurements from different timeframes into one value, which gives a broader momentum read and tends to produce fewer false signals than single-period oscillators.
▶Can I use KST for day trading?
Yes, but shorten the defaults. Try ROC periods of 5, 10, 15, 20, reduce the signal line to 6 or 7 periods, and use less smoothing. Always confirm intraday KST signals with volume or a second indicator like MACD to cut down on false entries.
▶What are the limitations of the KST indicator?
KST lags during fast, sharp moves because of all the smoothing layers. It also throws more false signals in sideways markets with no clear trend. Best used with trend-following tools like moving averages rather than alone.
▶How can I add a custom KST indicator to TradingView without coding?
Use a visual Pine Script builder like Pineify. Set your preferred ROC periods and smoothing values in the visual interface, generate the Pine Script automatically, paste it into TradingView's Pine Editor, and add it to your chart. This also bypasses TradingView's free-plan indicator limits.