Multi-timeframe (MTF) Pine Script Guide [2025]
In the world of trading, understanding market trends across multiple timeframes is crucial for making informed decisions. Pine Script, a powerful programming language used on TradingView, allows traders to create custom indicators that analyze trends across different timeframes. This article explores how to leverage multi-timeframe Pine Script to enhance your trading strategy, focusing on its benefits, implementation, and optimization techniques.

What is Multi-Timeframe Analysis?
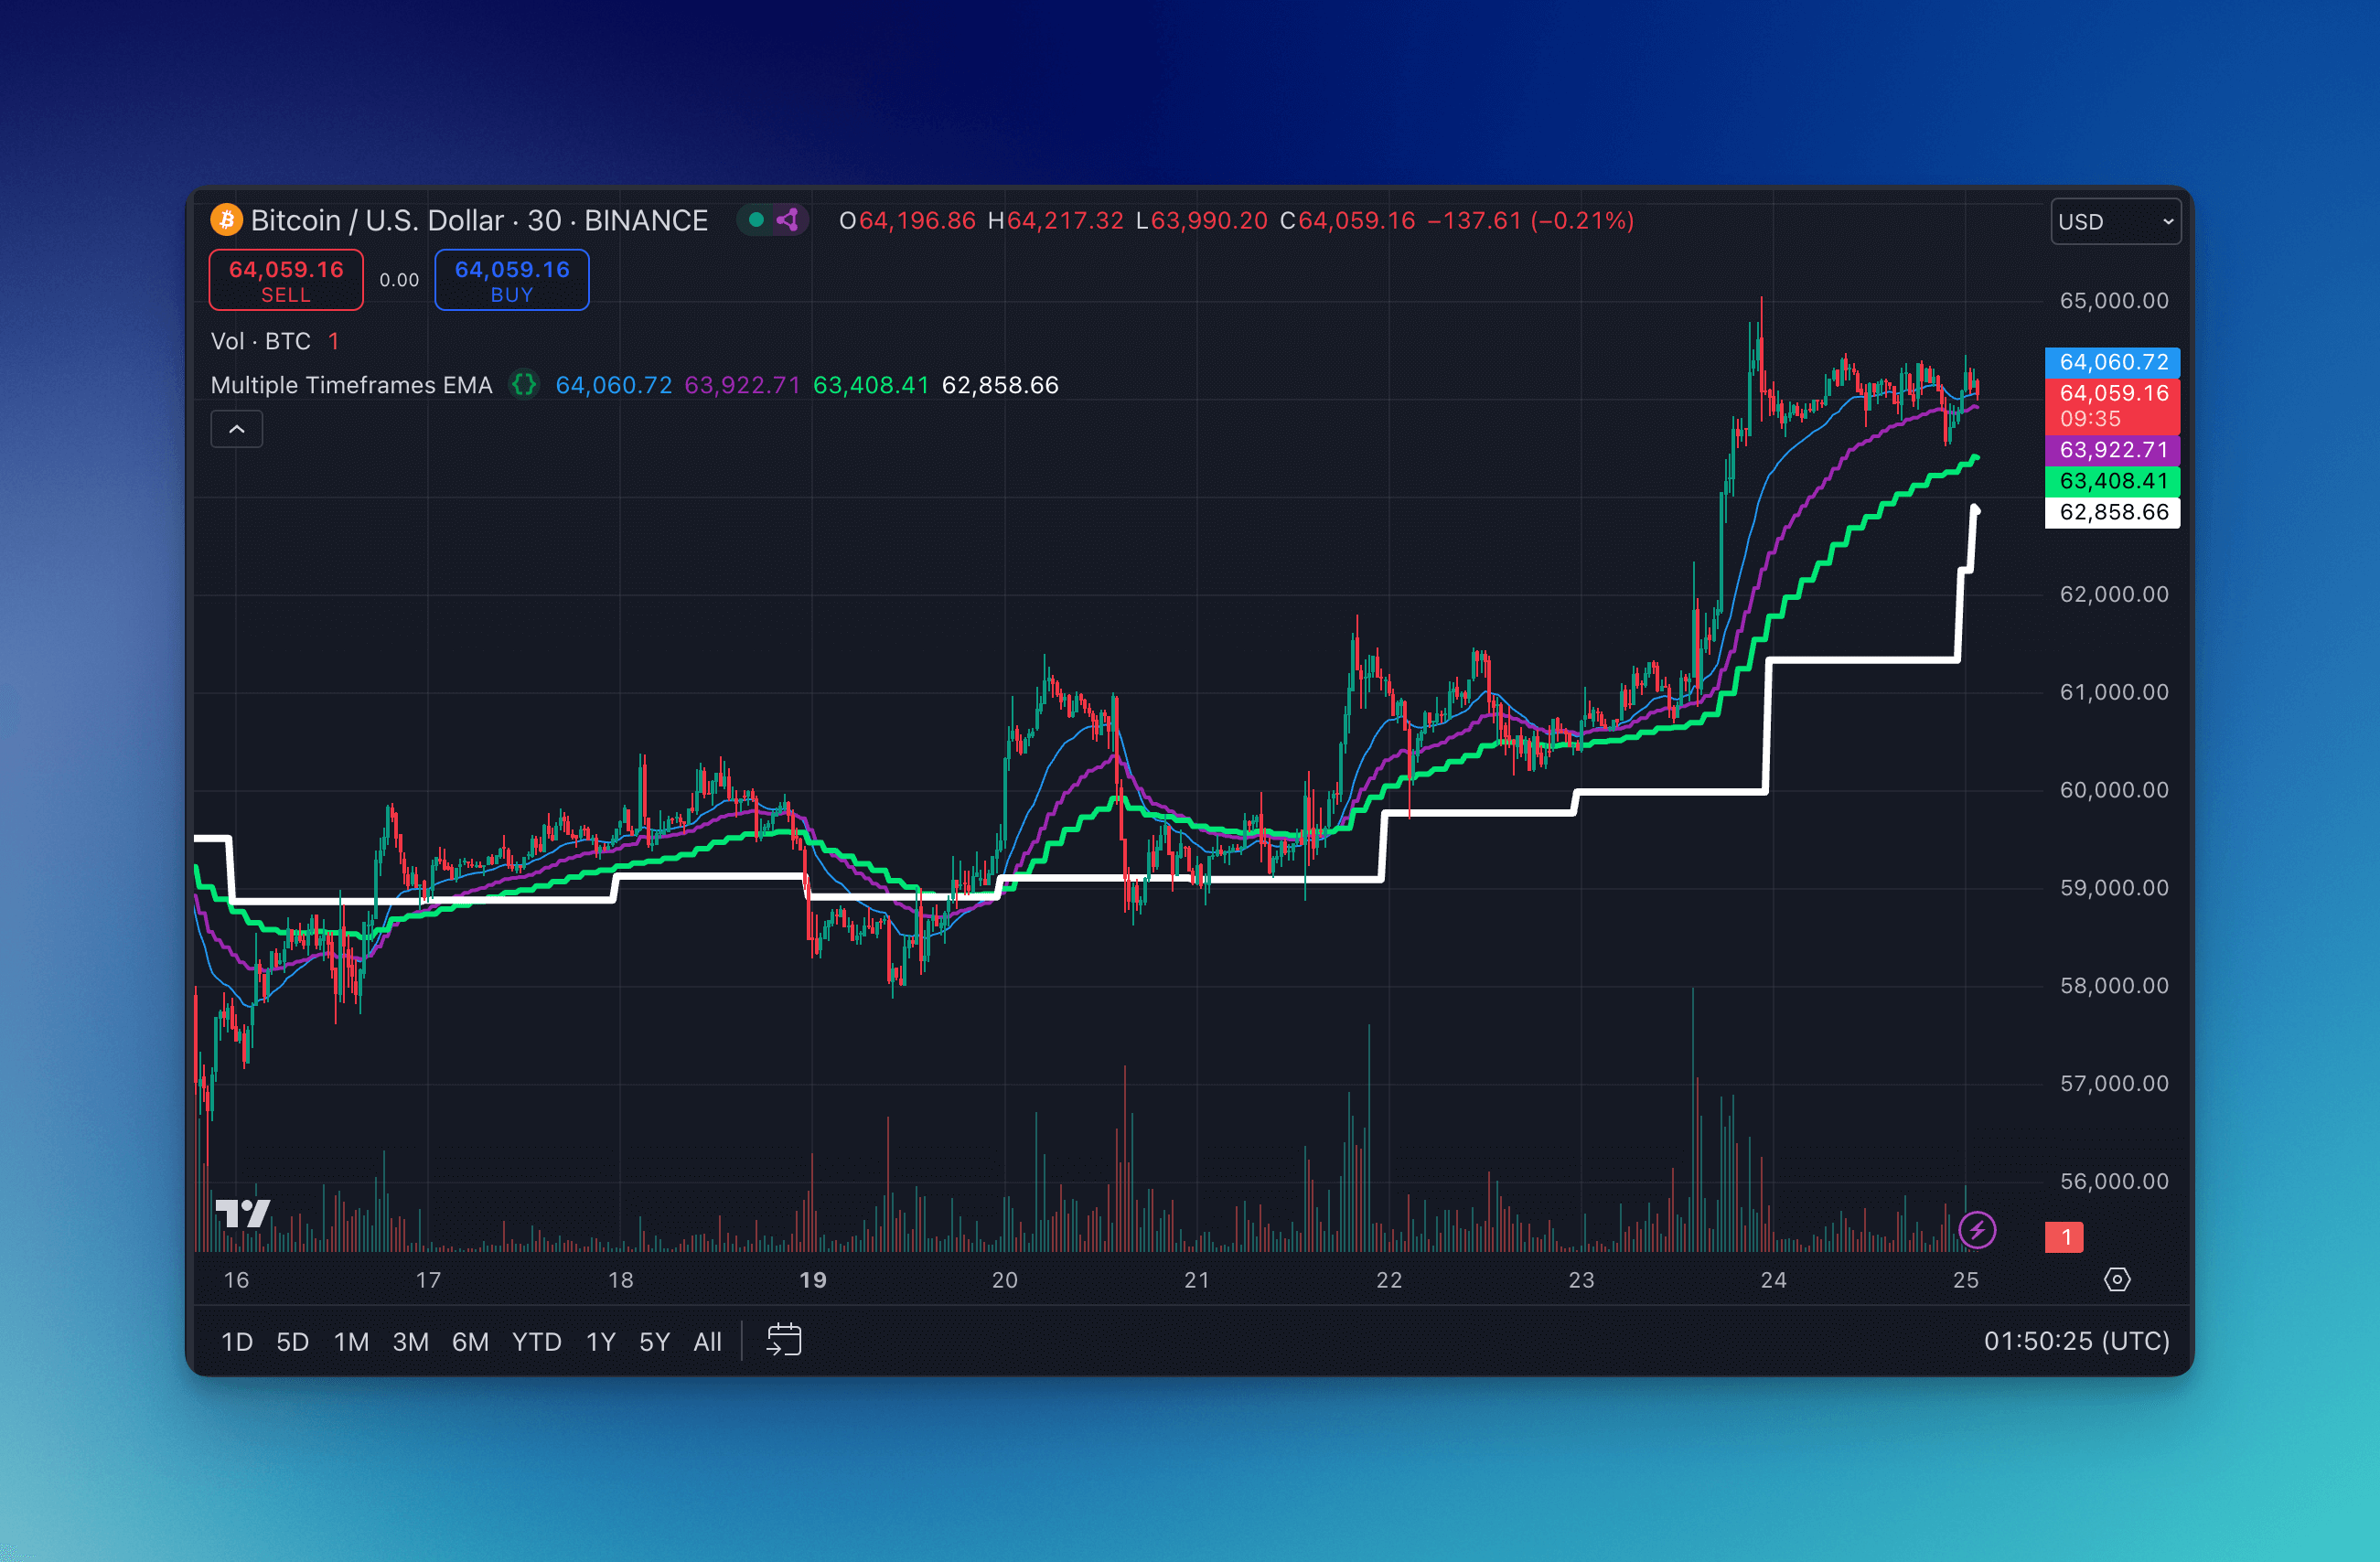
Multi-timeframe analysis involves examining market trends on various timeframes to gauge long-term momentum and directional bias. This approach helps traders identify stronger trends and make more accurate predictions. By using Pine Script, traders can create indicators that seamlessly integrate data from multiple timeframes, providing a comprehensive view of market dynamics.
Benefits of Multi-Timeframe Analysis in Pine Script

- Enhanced Trend Identification: Combining data from multiple timeframes helps in identifying stronger trends and filtering out noise.
- Improved Decision Making: By analyzing trends across different timeframes, traders can make more informed decisions about when to enter or exit trades.
- Customization: Pine Script allows users to customize indicators according to their specific trading strategies and preferences.
Implementing Multi-Timeframe Indicators in Pine Script
Implementing multi-timeframe indicators in Pine Script involves using the request.security() function to fetch data from different timeframes. Here’s a simplified example:
//@version=5
indicator("Multi-Timeframe Example")

// Define timeframes
tf1 = input.timeframe("5m")
tf2 = input.timeframe("1h")
tf3 = input.timeframe("1D")

// Fetch close prices from different timeframes
close5m = request.security(syminfo.tickerid, tf1, close)
close1h = request.security(syminfo.tickerid, tf2, close)
close1d = request.security(syminfo.tickerid, tf3, close)

// Plot the prices
plot(close5m, color=color.red)
plot(close1h, color=color.blue)
plot(close1d, color=color.green)
Simplifying Multi-Timeframe Analysis with Pineify
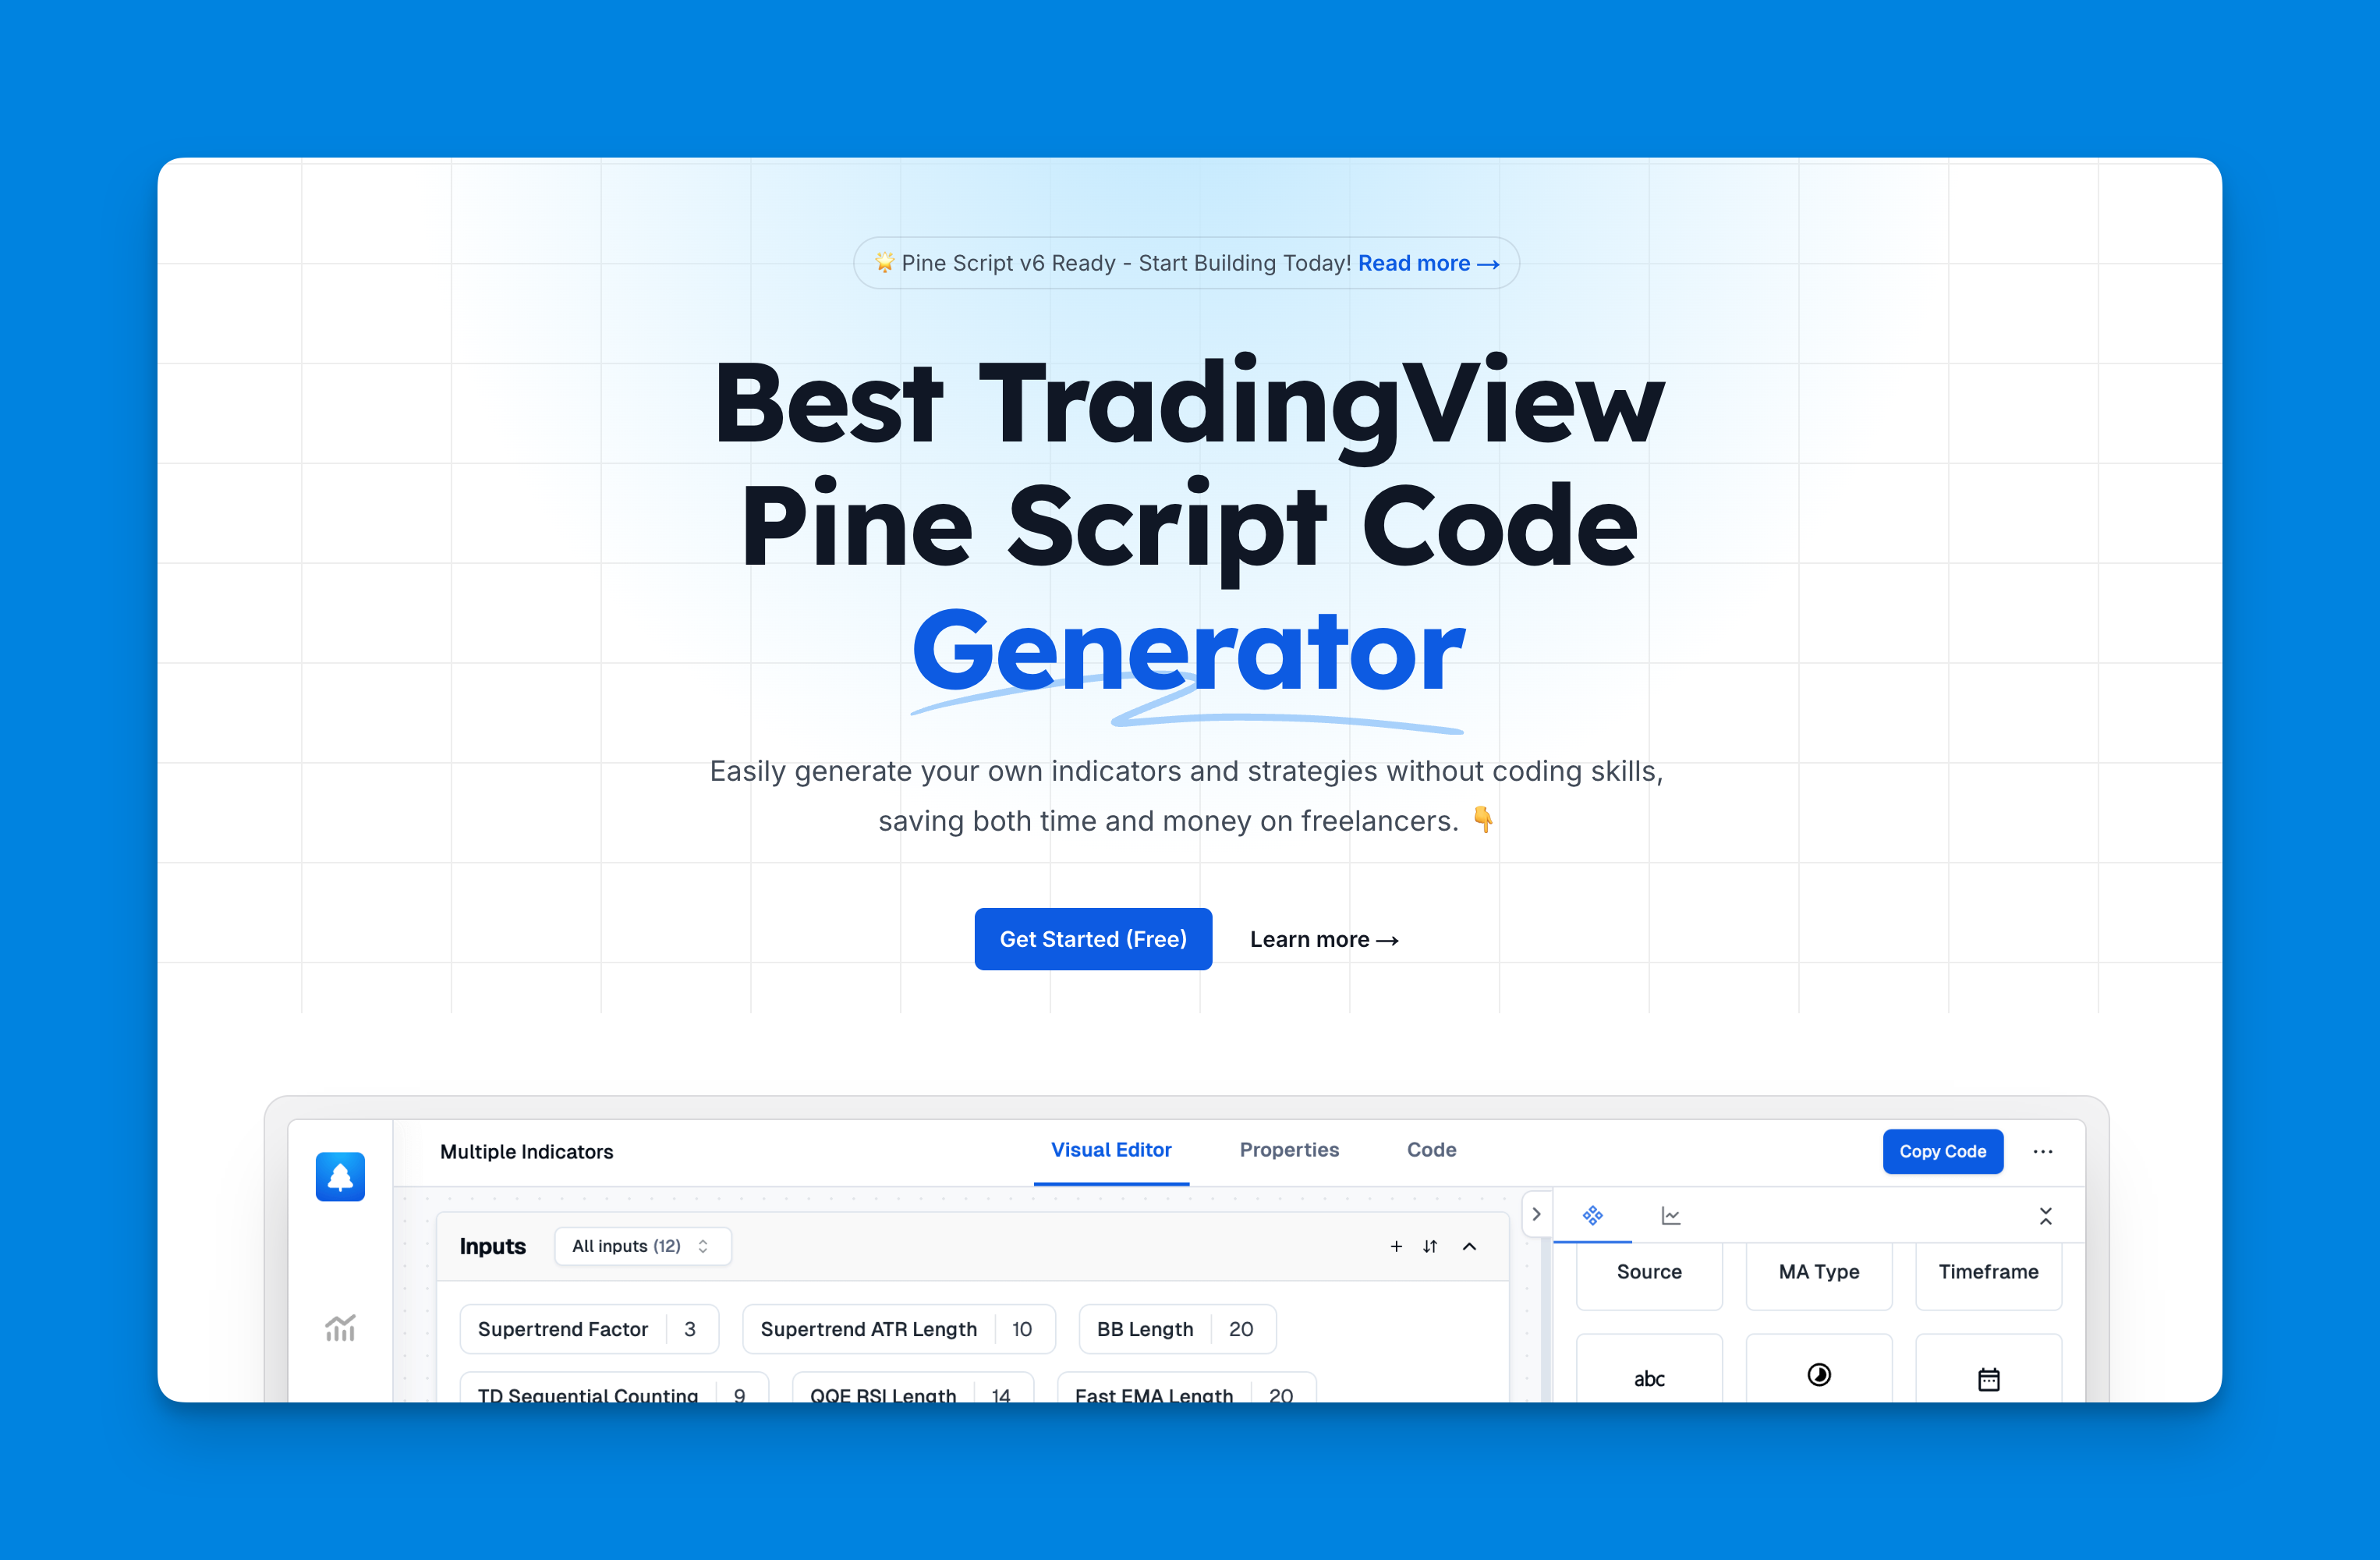
When it comes to multi-timeframe analysis in Pine Script, tools like Pineify can significantly simplify the process. Pineify is designed to help traders create and manage indicators and strategies without needing extensive programming knowledge. This platform allows users to bypass TradingView's limitations on the number of indicators that can be added to a chart, enabling the integration of multiple technical indicators across different timeframes and symbols.

Pineify offers powerful features for multi-timeframe analysis. Users can import custom indicators and create complex strategies across timeframes. The platform's condition editor enables precise trading rules, while its backtesting capabilities help validate strategies before live trading. This streamlines workflow and improves analysis accuracy.
Website: Pineify
Click here to view all the features of Pineify.Optimization Techniques for Multi-Timeframe Indicators
- Non-Repainting Indicators: Ensure that your indicators do not repaint by using historical data correctly.
- Timeframe Selection: Choose timeframes that align with your trading strategy, such as using shorter timeframes for scalping and longer timeframes for swing trading.
- Customization: Tailor your indicators to fit specific market conditions or trading styles.
Conclusion
Incorporating multi-timeframe analysis into your trading strategy using Pine Script can significantly enhance your market insights and decision-making capabilities. By leveraging this powerful tool, traders can create customized indicators that provide a comprehensive view of market trends across different timeframes.
