Understanding Current Price & Entry Price in Pine Script
When creating custom indicators or trading strategies in TradingView’s Pine Script, understanding how to access and use the current price is fundamental. Many traders, especially beginners, often have questions about how to properly reference the current price in their scripts. Let’s dive into everything you need to know about working with current price in Pine Script.
What is Current Price in Pine Script?
In Pine Script, the current price is most commonly accessed using the built-in variable close. Despite what the name might suggest, close doesn’t just represent the closing price of a completed candle – it actually refers to the real-time price as it changes.
The close variable is dynamic and updates with every price change during live trading sessions. This makes it an essential component for creating responsive indicators and strategies that react to price movements in real-time.
Common misconception: Many new Pine Script users mistakenly believe that close only represents the final closing price of a candle, but in reality, it continuously updates with the latest price information.
Using Current Price in Basic Pine Script Code
Let’s look at how to implement current price in your Pine Script code:
//@version=5
indicator("[Pineify - Best Pine Script Generator] Current Price Example")

// Plot the current price
plot(close, "Current Price", color=color.blue)
This simple script plots the current price on your chart. When you add this to your chart, you’ll see a line that follows the closing price of each candle – and on the current (rightmost) candle, it will update in real-time as the price changes.
Creating Indicators with Current Price

Here’s how you might create a simple moving average indicator using the current price:
//@version=5
indicator("[Pineify - Best Pine Script Generator] Simple Moving Average")

// Define period input
period = input(20, "SMA Period")

// Calculate SMA using current price
sma_value = ta.sma(close, period)

// Plot the SMA
plot(sma_value, "SMA", color=color.blue)
This script calculates a Simple Moving Average based on the current price over your specified period. The close variable provides the price data points used in the calculation.
Simplifying Current Price Analysis with Visual Tools

Website: Pineify
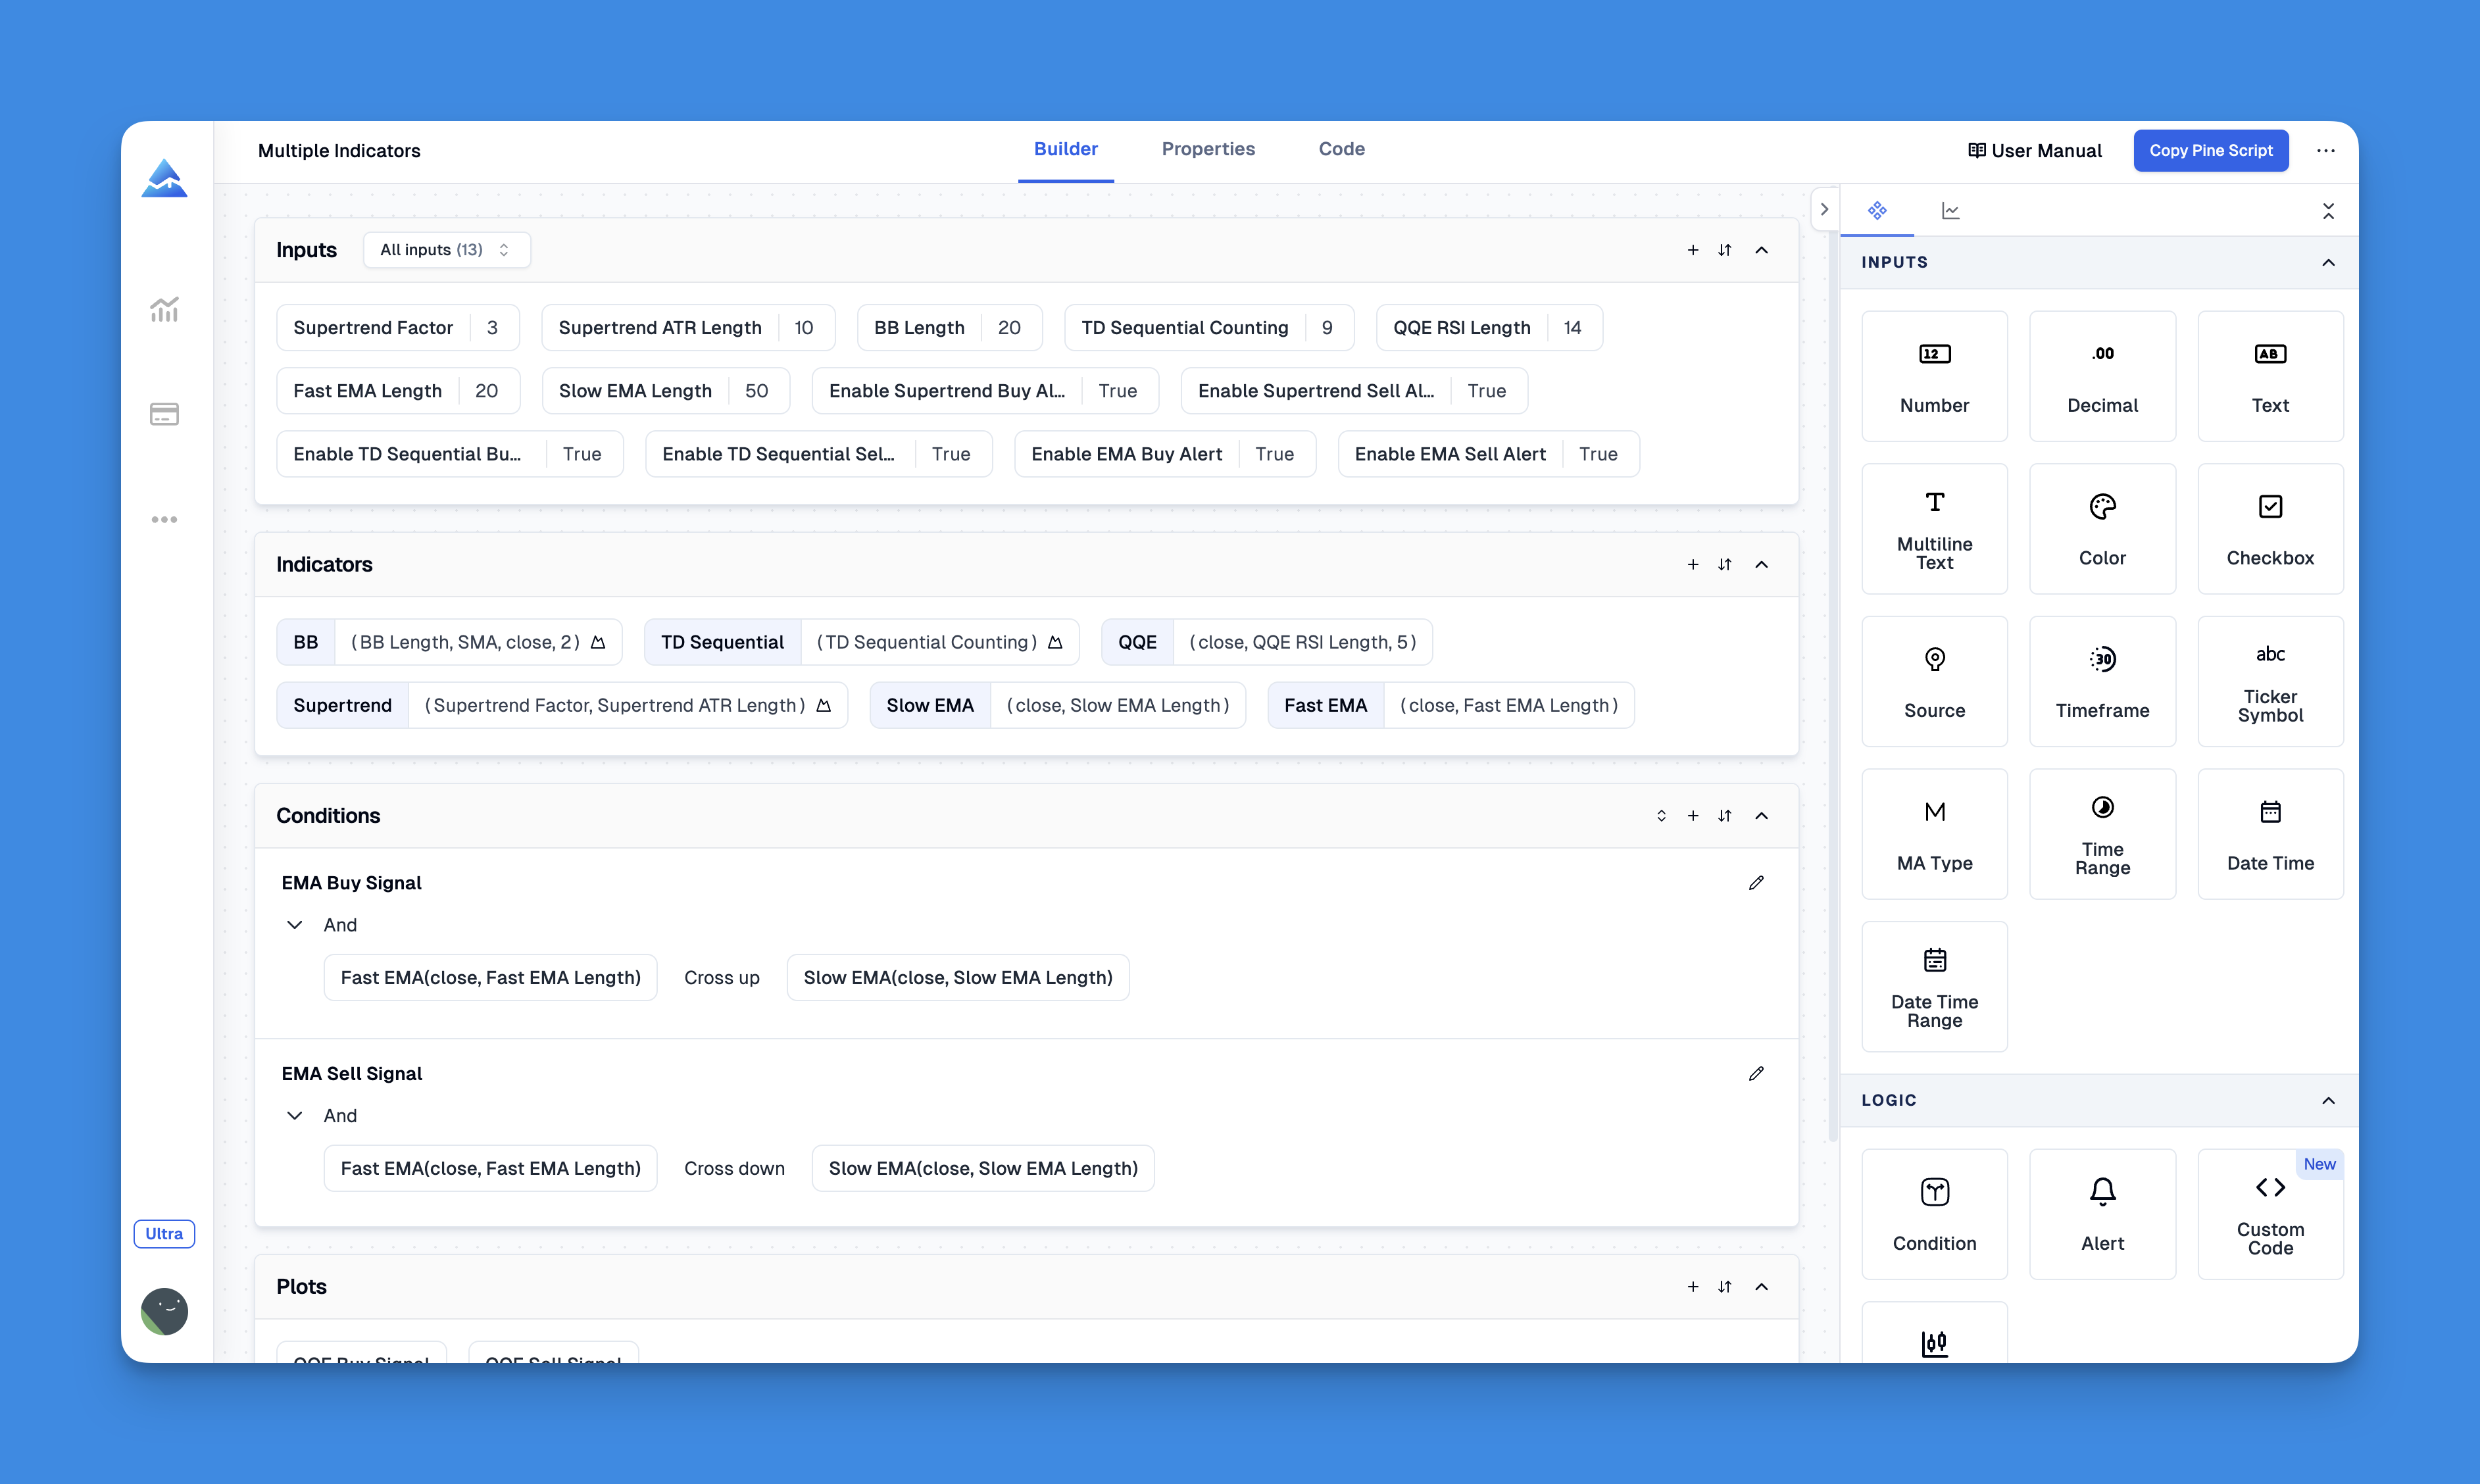
Click here to view all the features of Pineify.The foundation of any effective trading strategy in Pine Script is understanding how to properly access and utilize current price data. While traditional Pine Script coding requires substantial technical knowledge to manipulate price information, modern solutions like Pineify have revolutionized this process with intuitive visual tools.
Through Pineify's powerful condition editor, traders can flexibly combine multiple technical indicators with current price and various price data points to construct precise and reliable trading rules without writing a single line of code. This visual approach transforms the complex task of price analysis into an accessible process for traders of all skill levels.
By leveraging Pineify's plotting capabilities, you can visualize current price relationships through lines, histograms, background colors, and even custom candlestick charts that highlight specific price conditions1. This visual representation makes complex price patterns immediately apparent.
Accessing Current Price of Different Assets
Sometimes you might want to access the current price of an asset different from the one displayed on your chart. You can do this using the request.security() function:
//@version=5
indicator("[Pineify - Best Pine Script Generator] Apple Price")

// Get Apple's current price regardless of chart symbol
apple_price = request.security("AAPL", "D", close)

// Plot Apple's price
plot(apple_price, "Apple Price", color=color.blue)
This script will display Apple’s current price even if you’re viewing a different symbol on your chart. The function fetches the closing price (close) from Apple’s daily timeframe.
Using Current Price as Entry Price in Trading Strategies
For trading strategies, current price is often used in entry and exit conditions:
//@version=5
strategy("[Pineify - Best Pine Script Generator] Simple RSI Strategy")

// Calculate RSI
rsi = ta.rsi(close, 14)

// Define conditions
longCondition = ta.crossover(rsi, 30)
shortCondition = ta.crossunder(rsi, 70)

// Execute trades
if (longCondition)
    strategy.entry("long", strategy.long, 100, when = rsi > 30)

if (shortCondition)
    strategy.entry("short", strategy.short, 100, when = rsi < 70)
This strategy uses RSI calculated from the current price (close) to determine entry points. It goes long when RSI crosses above 30 and short when it crosses below.
Current Price for Conditional Signals
You can use current price for conditional signals like this example:
//@version=5
indicator("[Pineify - Best Pine Script Generator] Price Range Alert")

// Calculate yesterday's range
yesterday_high = ta.highest(high[^1], 1)
yesterday_low = ta.lowest(low[^1], 1)
yesterday_range = yesterday_high - yesterday_low

// Calculate 50% of yesterday's range
half_range = yesterday_range * 0.5

// Alert condition - if price moves up 50% of yesterday's range from today's open
alert_condition = close >= open + half_range

// Plot signal
plotshape(alert_condition, "Alert Signal", shape.triangleup, location.belowbar, color.green)
This script alerts you when the current price (close) moves up by 50% of yesterday’s range from today’s opening price.
Common Mistakes When Working with Current Price
One frequent mistake is confusing the current bar’s close with historical closes. For example:
// Incorrect way to get yesterday's close
yesterday_close = close[^1]  // This is correct

// Incorrect attempt to get future price
tomorrow_close = close[-1]  // This doesn't work as expected
Remember that Pine Script processes data sequentially through historical bars and then the current bar. You cannot access future prices (as they don’t exist yet), but you can access historical prices using the indexing notation.
Conclusion
Understanding how to properly work with current price is essential for creating effective trading indicators and strategies in Pine Script. The built-in close variable gives you access to real-time price data, which updates continuously during live market sessions.
By leveraging the examples and explanations provided in this guide, you can create more responsive and effective TradingView scripts that properly utilize current price data in your technical analysis and automated trading strategies.