Pineify 4.0 AI Coding Agent: Pine Script, MQL5 & Finance Research
· 18 min read
Looking for the best AI for Pine Script, MQL5, or financial research? Tired of ChatGPT generating TradingView or MetaTrader 5 code that fails to compile? Need a finance AI agent that delivers real-time market data instead of hallucinated numbers?
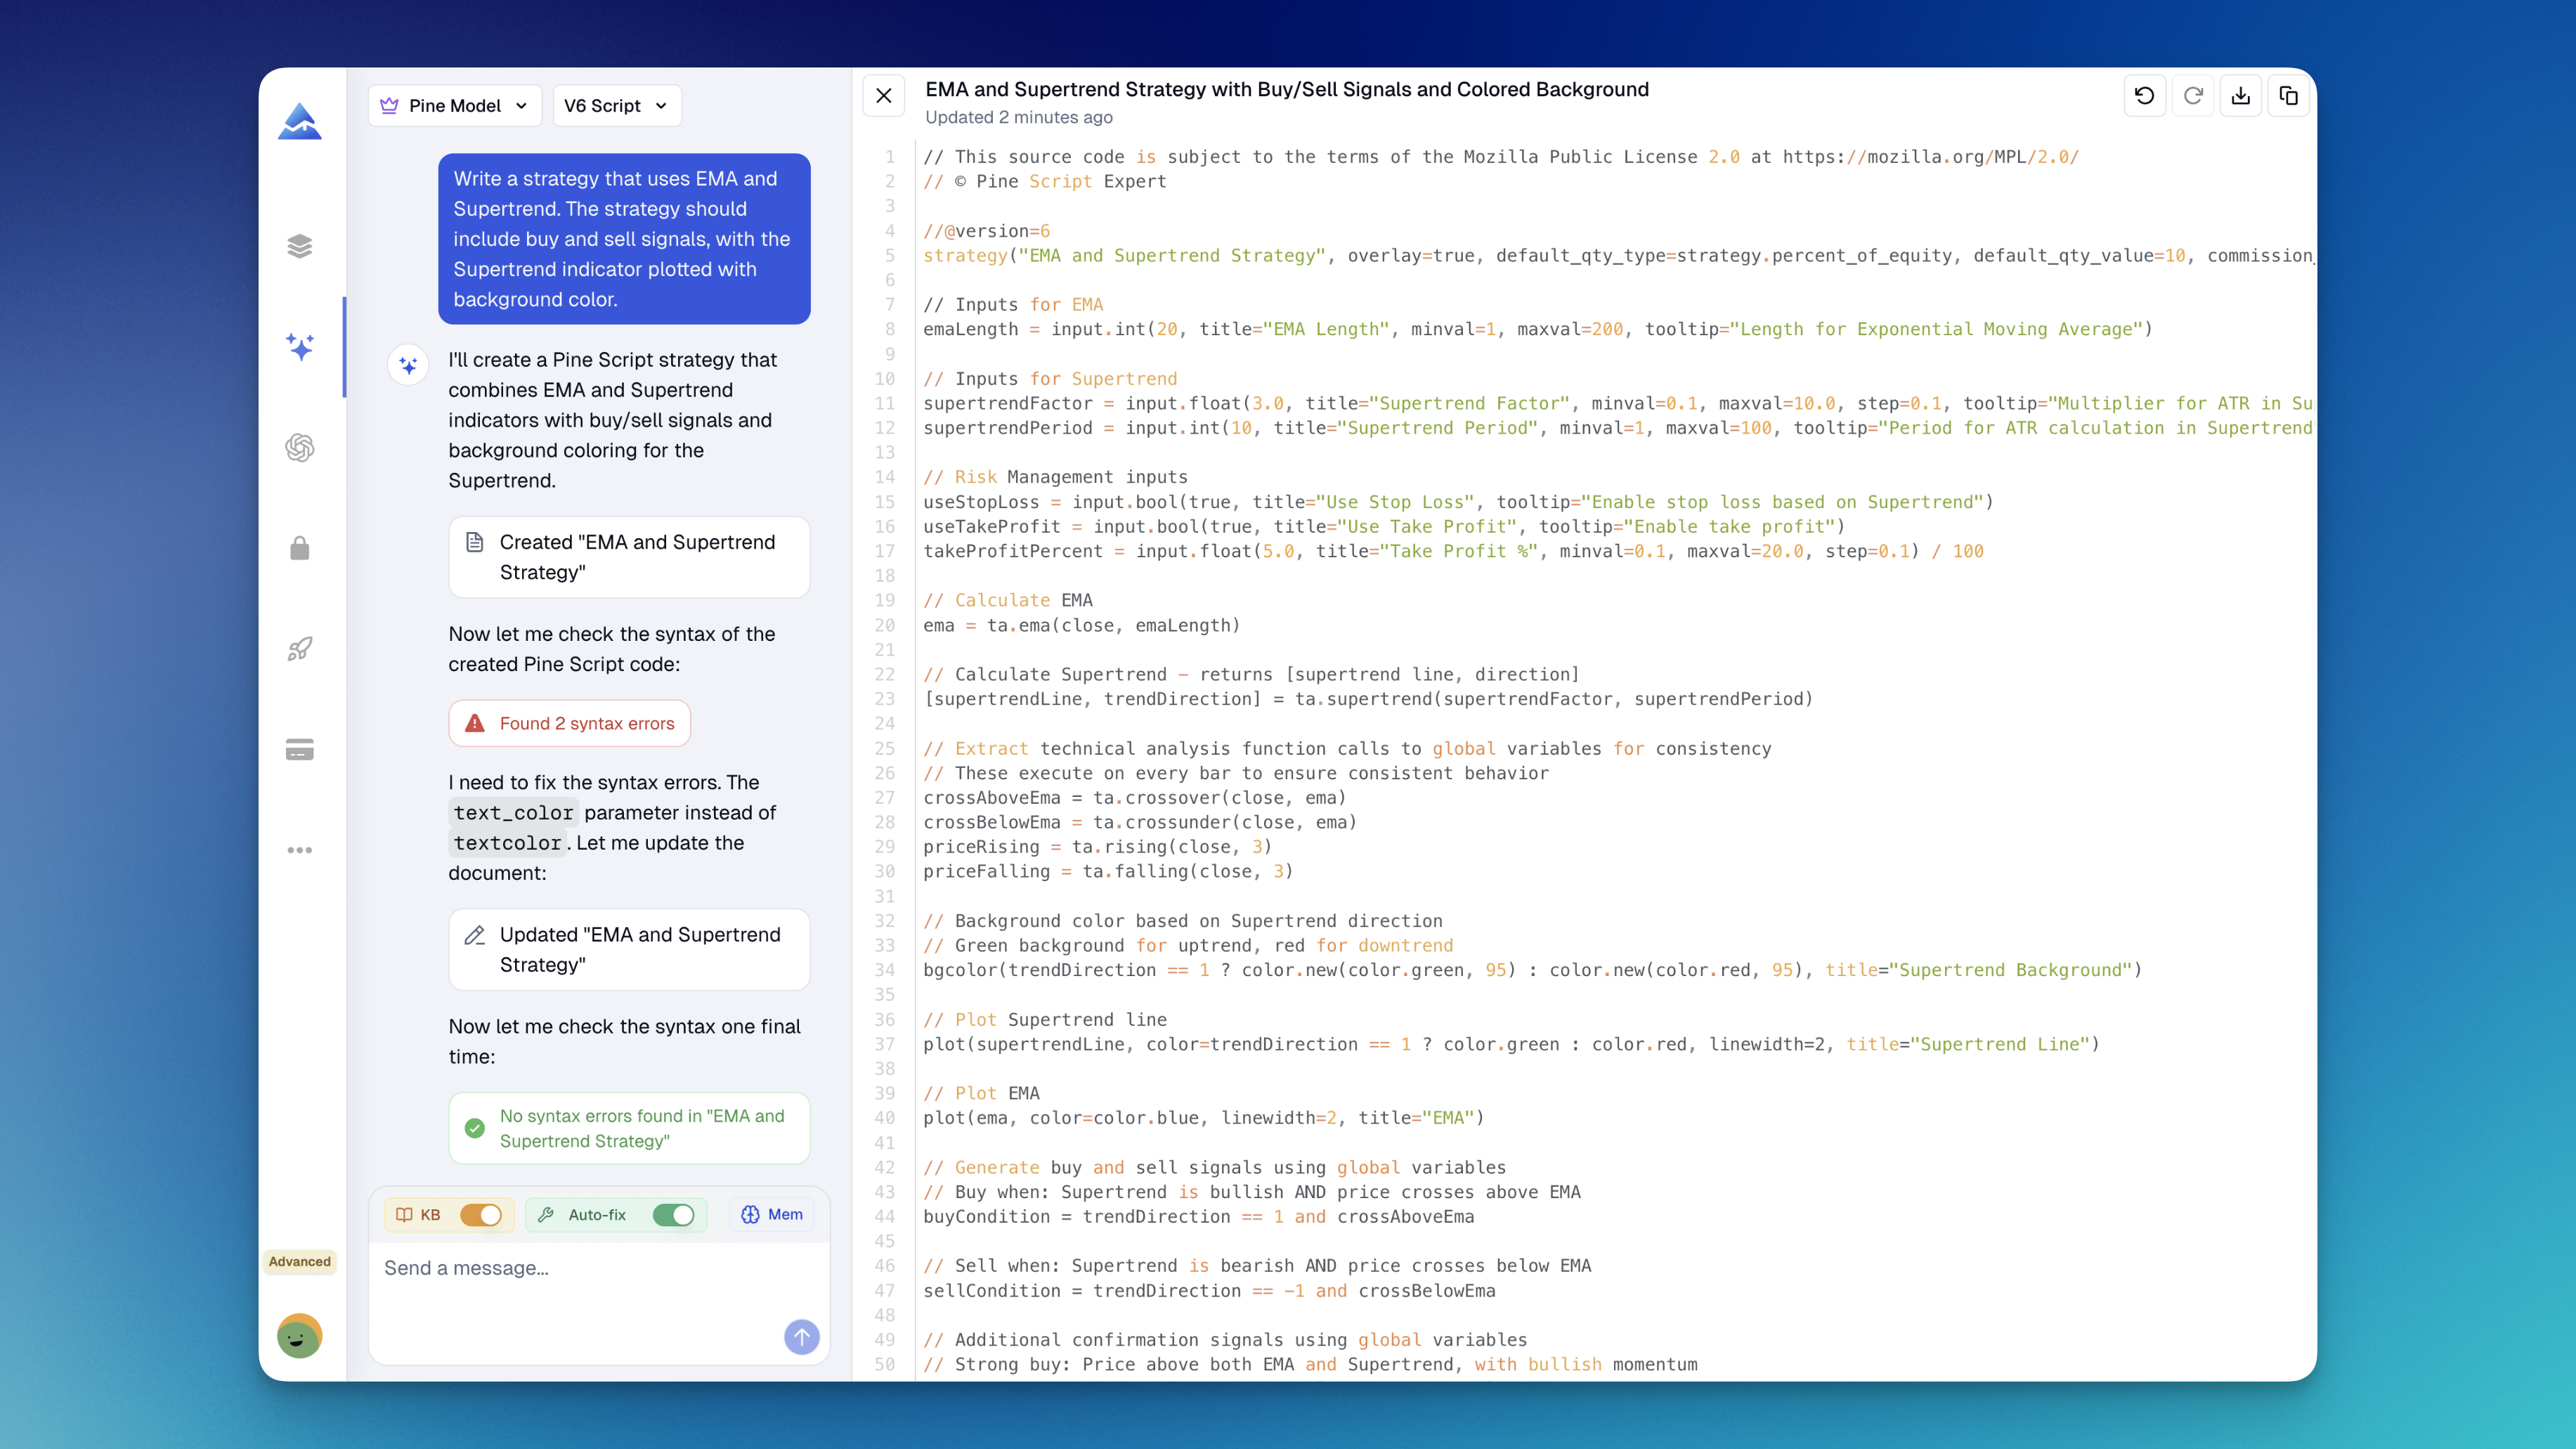
Pineify 4.0 is an AI platform with three specialized agents: a Pine Script AI Coding Agent for TradingView, an MQL5 AI Coding Agent for MetaTrader 5, and a Finance AI Agent for real-time market research. I've been using the Pine Script agent for about three months, and I'd put its output quality against any generic AI tool I've tried. The platform covers the whole workflow — from research to code generation — across two of the most popular trading platforms worldwide.