Pine Script ta.stoch: Guide & Strategies
The Stochastic Oscillator, often referred to as "Stoch", is a powerful momentum indicator widely used in technical analysis. It helps traders identify potential trend reversals and overbought or oversold conditions in the market. This guide will explore the ta.stoch function in Pine Script, its usage, advantages, and its role in trading strategies.
What is the ta.stoch?
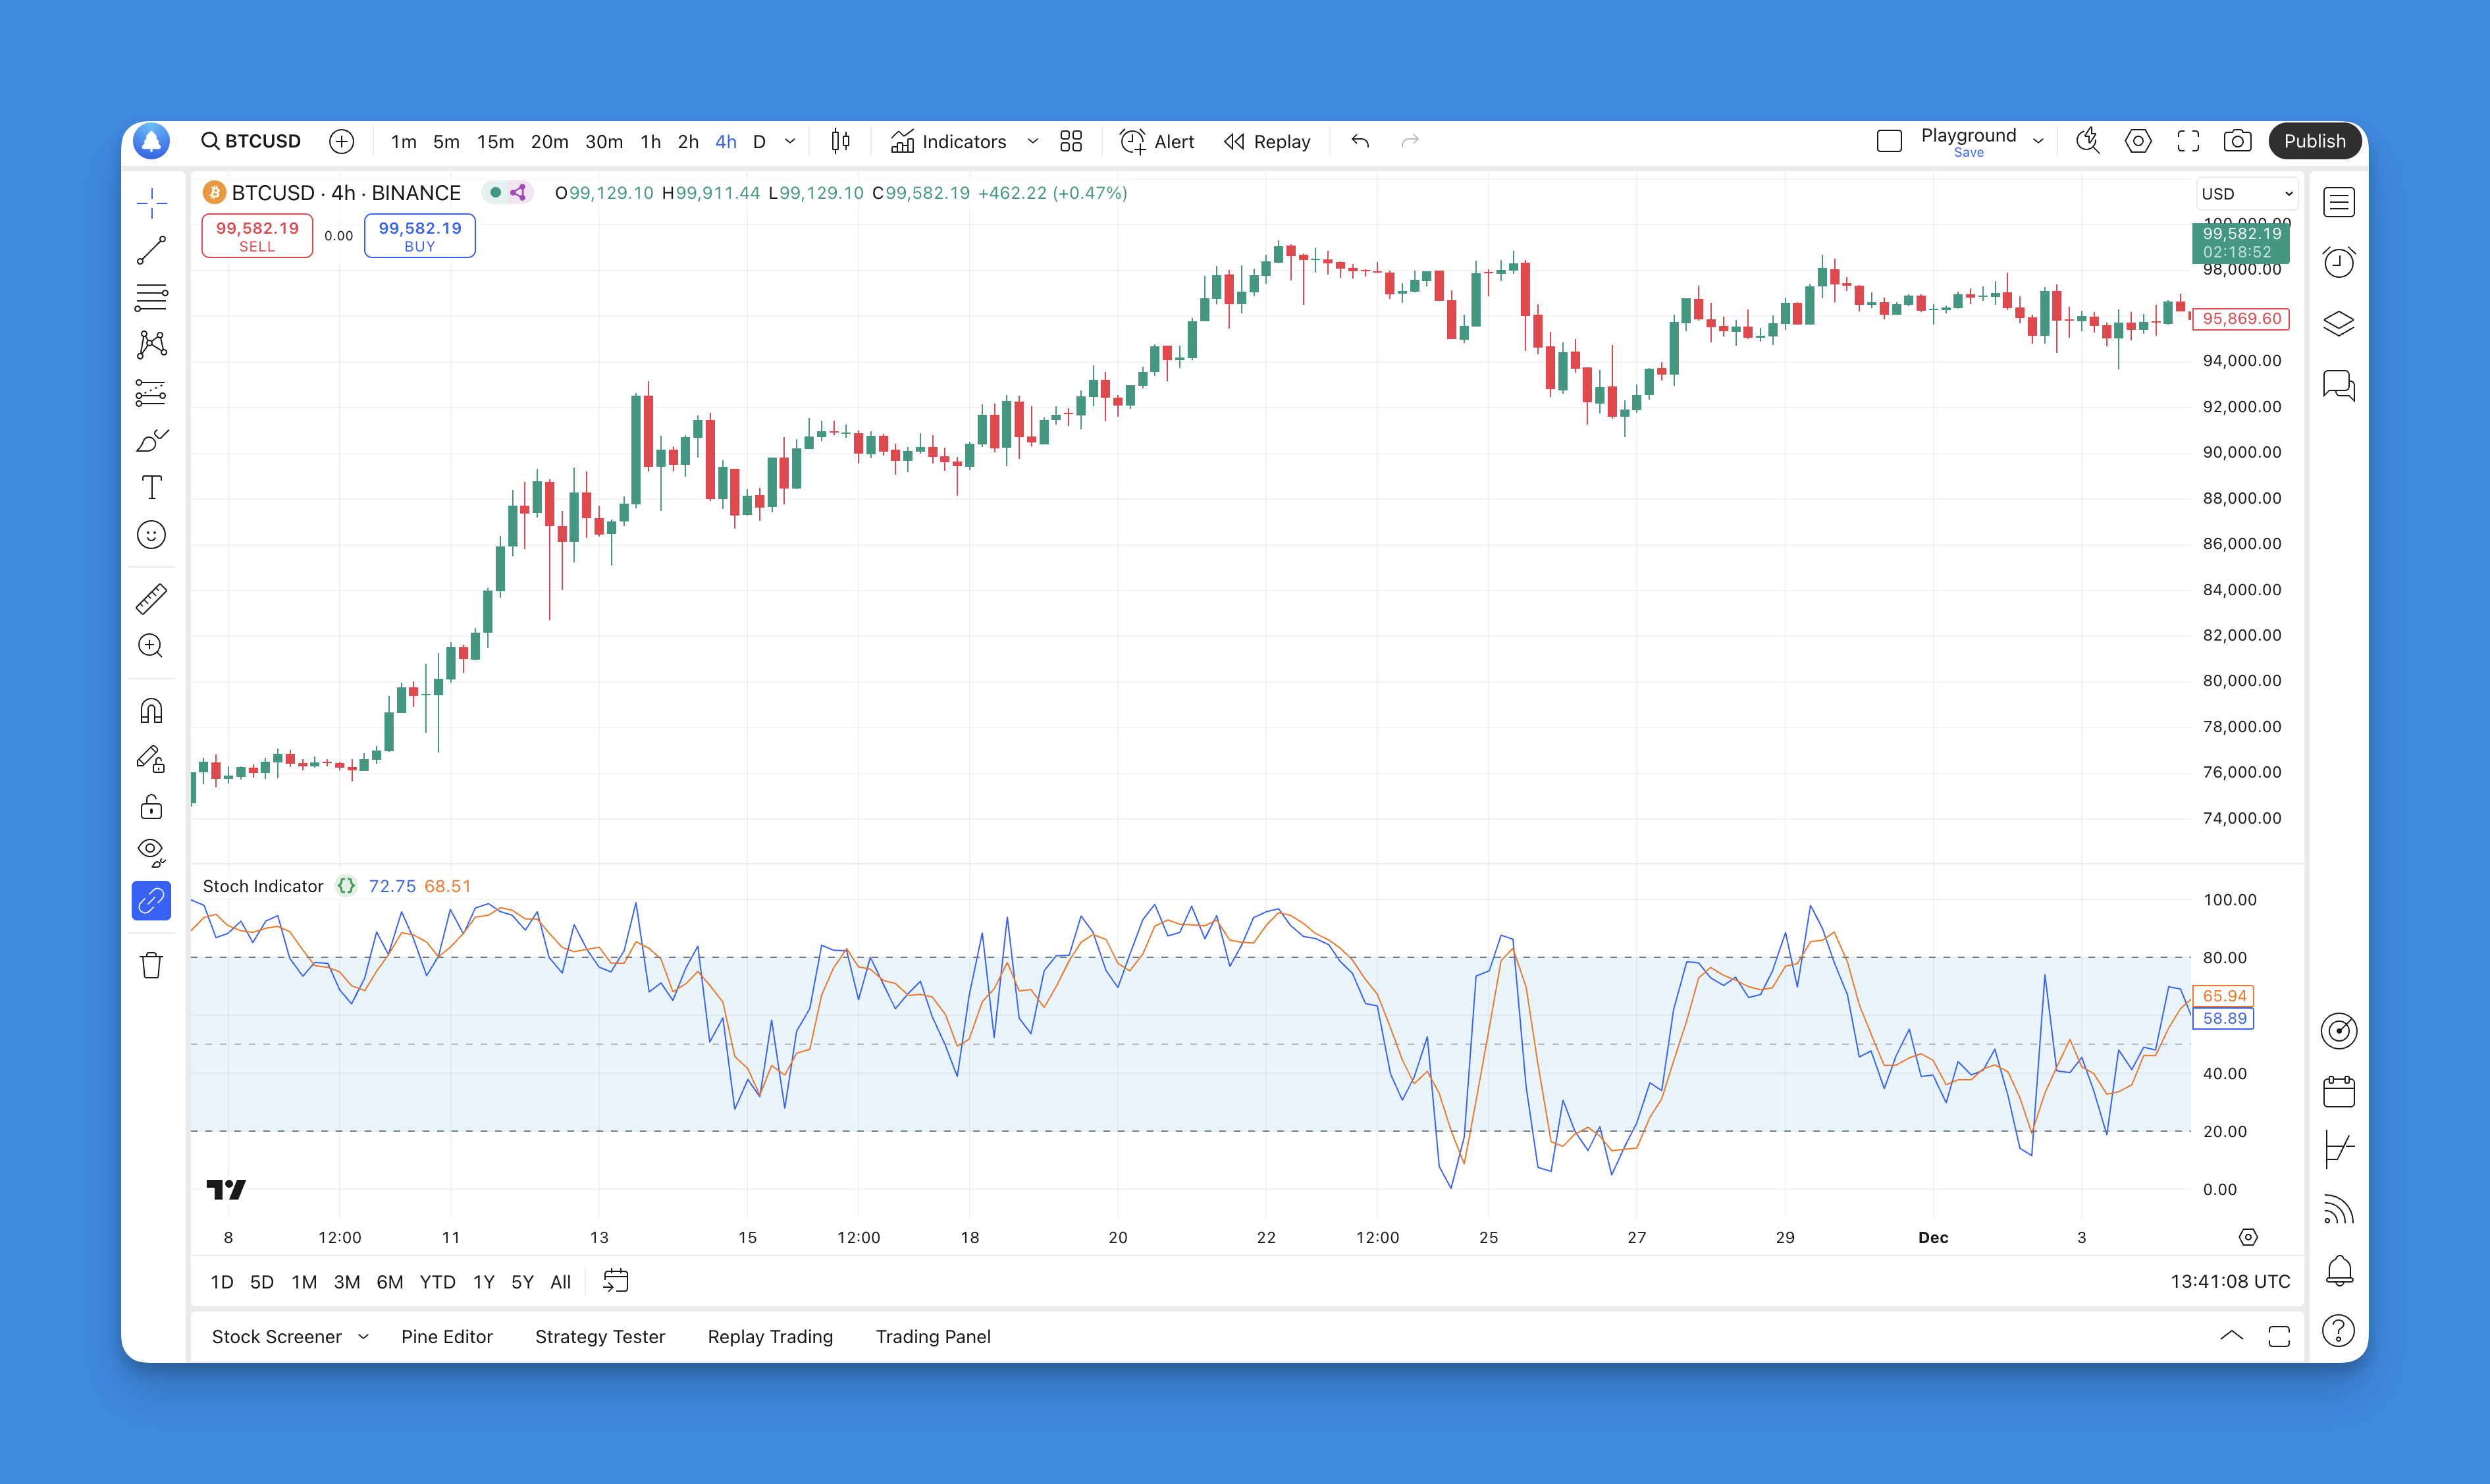
The ta.stoch function in Pine Script computes the Stochastic Oscillator, which measures the current closing price relative to its price range over a specified period. Developed by George Lane in the late 1950s, the Stochastic Oscillator operates on a scale from 0 to 100. It consists of two lines:
- %K line: Represents the current closing price's position relative to the high-low range.
- %D line: A moving average of the %K line, which serves as a signal line.
The primary purpose of this oscillator is to indicate whether an asset is overbought (typically above 80) or oversold (below 20). This information can be critical for traders looking to time their entries and exits effectively.
Adding the Stoch Indicator to TradingView Chart Without Coding

To add the Stochastic (Stoch) Indicator to your TradingView chart without any coding, you can utilize Pineify, a user-friendly platform designed for traders who may not have programming skills. Pineify allows you to create and manage indicators effortlessly, making it an ideal choice for integrating the Stoch Indicator into your trading strategies.

Website: Pineify
Click here to view all the features of Pineify.First, navigate to Pineify’s interface where you can easily access a variety of technical indicators, including the Stochastic Oscillator. The platform supports adding unlimited indicators to your charts, which means you can combine the Stoch Indicator with others to enhance your analysis. Simply select the Stoch Indicator from the available options and customize its parameters according to your trading preferences.
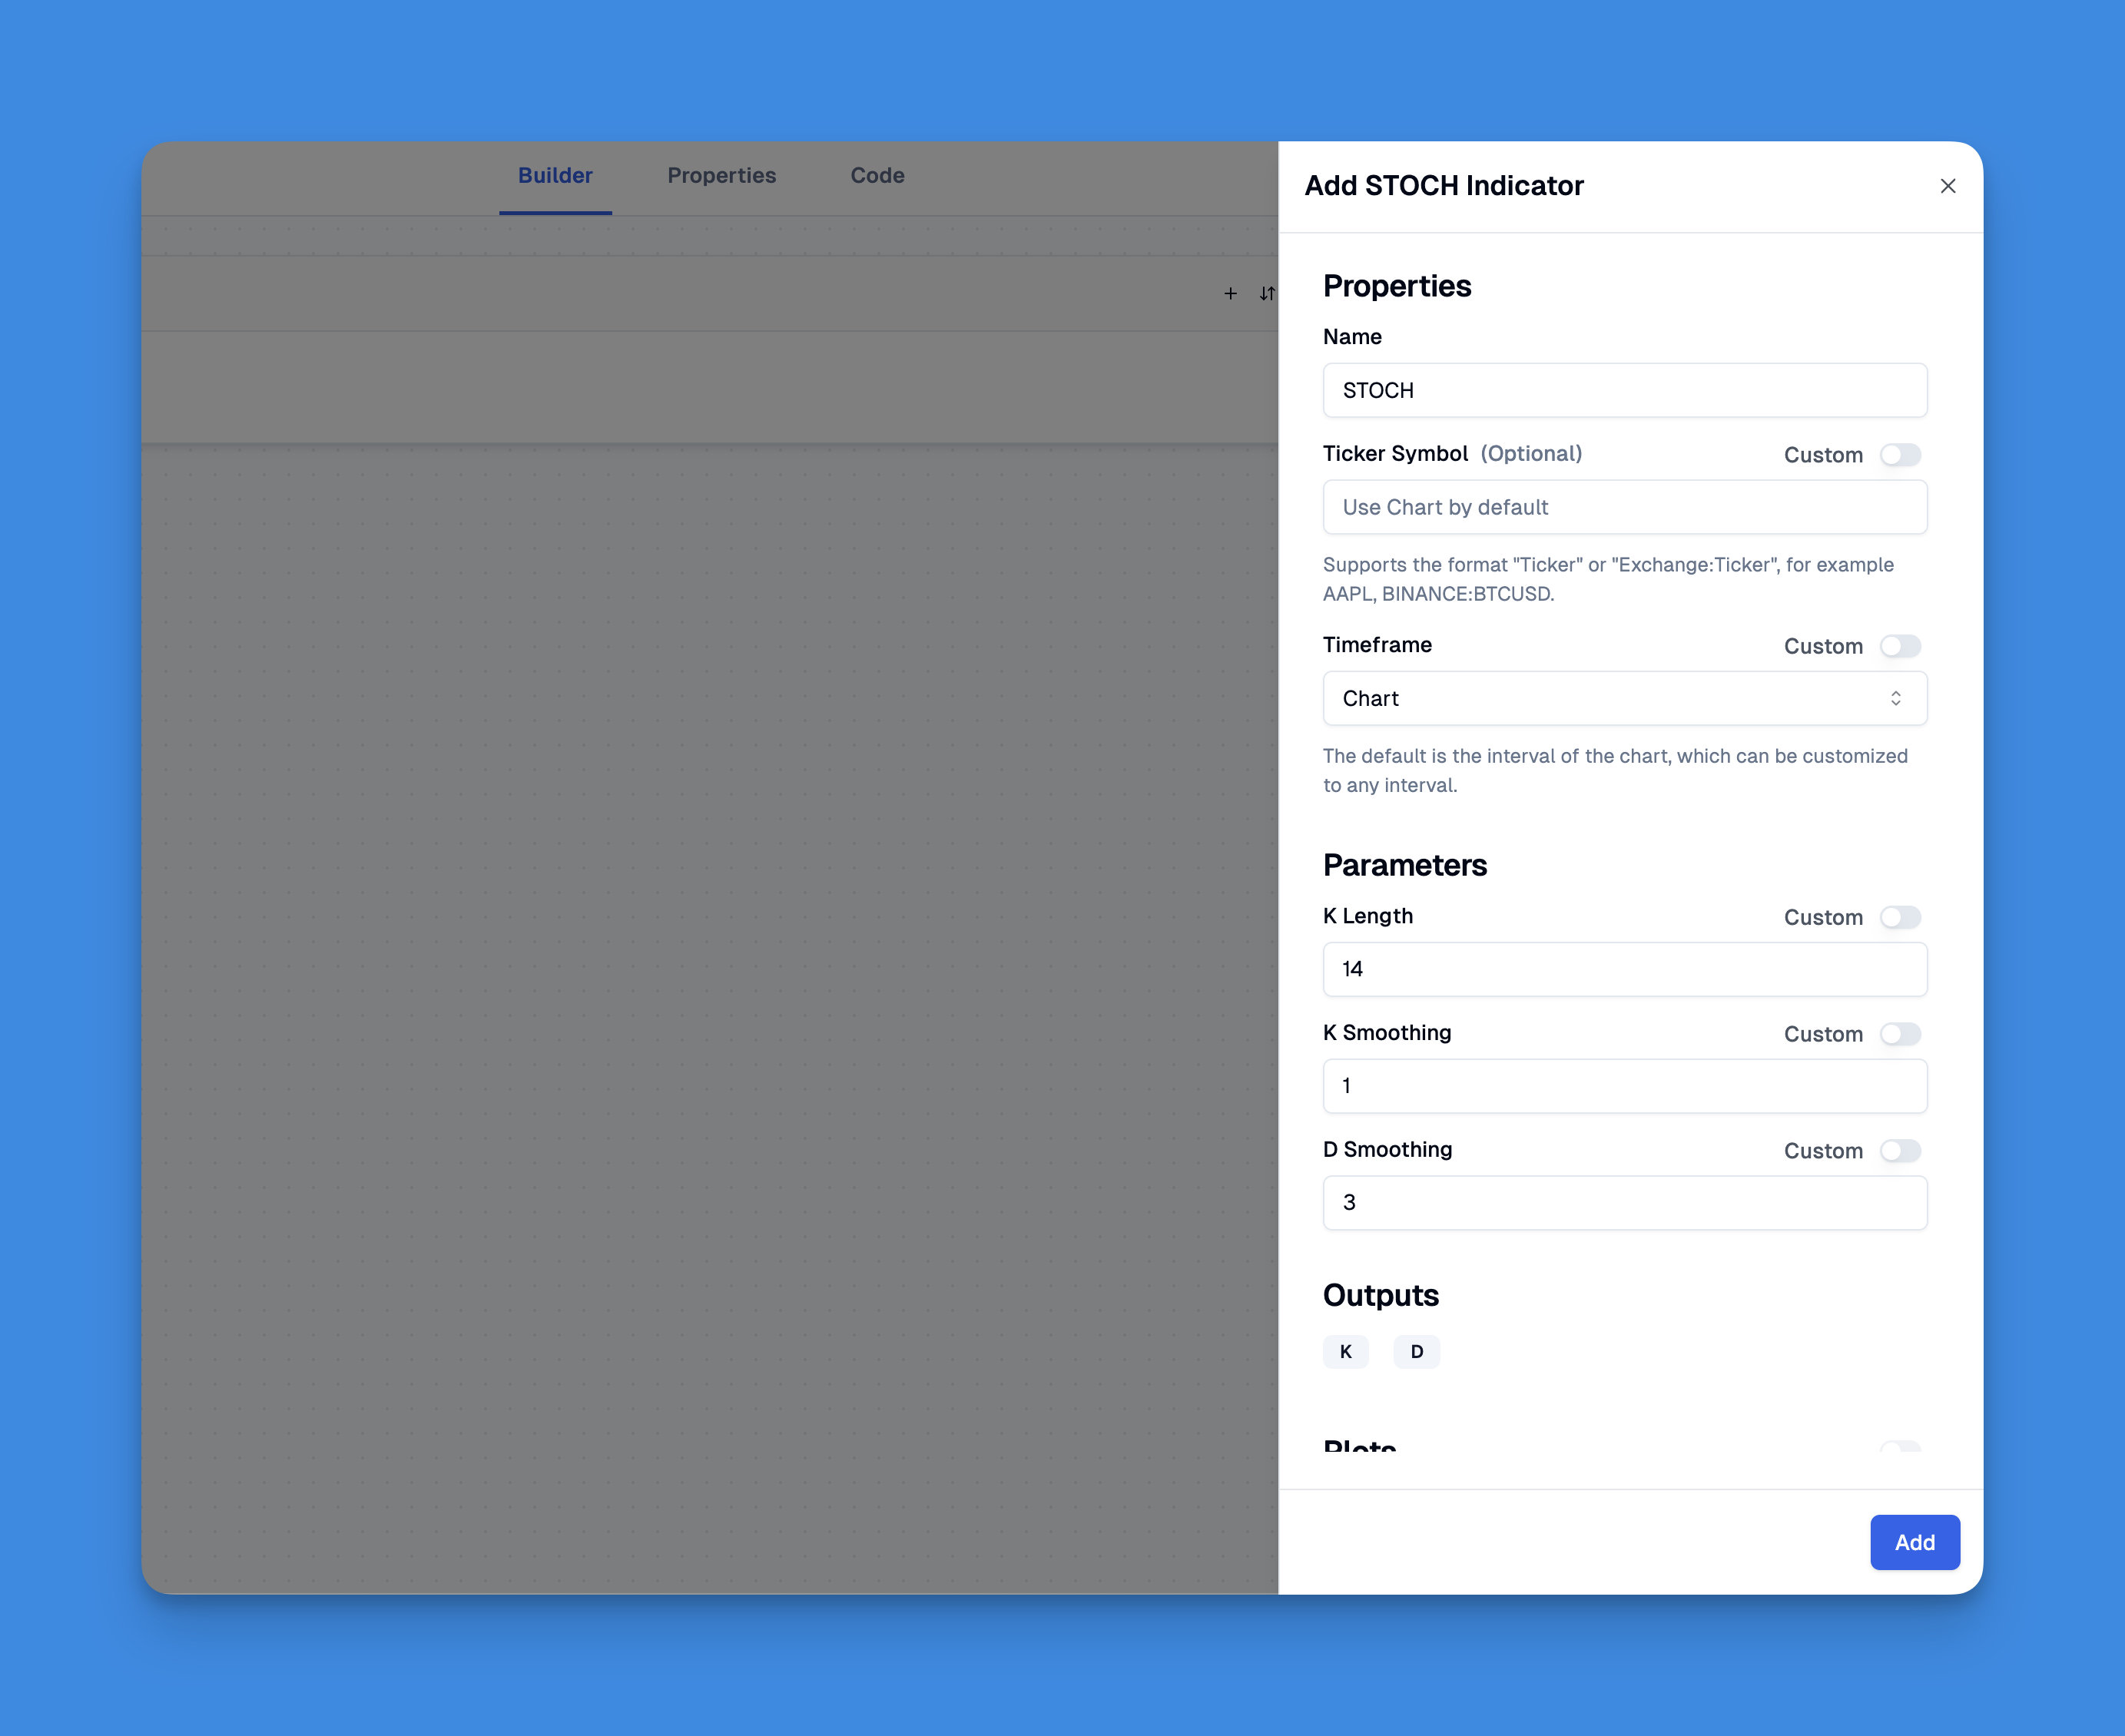
Moreover, if you have existing Pine Script code for the Stoch Indicator, Pineify allows you to import and customize it seamlessly. This flexibility ensures that you can use your preferred settings while still enjoying the ease of a no-code solution. With Pineify, adding the Stochastic Indicator becomes a straightforward process that saves time and enhances your trading experience.
Stoch Pine Script Code
// This source code is subject to the terms of the Mozilla Public License 2.0 at https://mozilla.org/MPL/2.0/
// © Pineify
//======================================================================//
// ____ _ _ __ //
// | _ \(_)_ __ ___(_)/ _|_ _ //
// | |_) | | '_ \ / _ \ | |_| | | | //
// | __/| | | | | __/ | _| |_| | //
// |_| |_|_| |_|\___|_|_| \__, | //
// |___/ //
//======================================================================//
//@version=6
indicator(title="Stoch Indicator", overlay=false, max_labels_count=500)
//#region —————————————————————————————————————————————————— Custom Code
//#endregion ————————————————————————————————————————————————————————————
//#region —————————————————————————————————————————————————— Common Dependence
p_comm_time_range_to_unix_time(string time_range, int date_time = time, string timezone = syminfo.timezone) =>
int start_unix_time = na
int end_unix_time = na
int start_time_hour = na
int start_time_minute = na
int end_time_hour = na
int end_time_minute = na
if str.length(time_range) == 11
// Format: hh:mm-hh:mm
start_time_hour := math.floor(str.tonumber(str.substring(time_range, 0, 2)))
start_time_minute := math.floor(str.tonumber(str.substring(time_range, 3, 5)))
end_time_hour := math.floor(str.tonumber(str.substring(time_range, 6, 8)))
end_time_minute := math.floor(str.tonumber(str.substring(time_range, 9, 11)))
else if str.length(time_range) == 9
// Format: hhmm-hhmm
start_time_hour := math.floor(str.tonumber(str.substring(time_range, 0, 2)))
start_time_minute := math.floor(str.tonumber(str.substring(time_range, 2, 4)))
end_time_hour := math.floor(str.tonumber(str.substring(time_range, 5, 7)))
end_time_minute := math.floor(str.tonumber(str.substring(time_range, 7, 9)))
start_unix_time := timestamp(timezone, year(date_time, timezone), month(date_time, timezone), dayofmonth(date_time, timezone), start_time_hour, start_time_minute, 0)
end_unix_time := timestamp(timezone, year(date_time, timezone), month(date_time, timezone), dayofmonth(date_time, timezone), end_time_hour, end_time_minute, 0)
[start_unix_time, end_unix_time]
p_comm_time_range_to_start_unix_time(string time_range, int date_time = time, string timezone = syminfo.timezone) =>
int start_time_hour = na
int start_time_minute = na
if str.length(time_range) == 11
// Format: hh:mm-hh:mm
start_time_hour := math.floor(str.tonumber(str.substring(time_range, 0, 2)))
start_time_minute := math.floor(str.tonumber(str.substring(time_range, 3, 5)))
else if str.length(time_range) == 9
// Format: hhmm-hhmm
start_time_hour := math.floor(str.tonumber(str.substring(time_range, 0, 2)))
start_time_minute := math.floor(str.tonumber(str.substring(time_range, 2, 4)))
timestamp(timezone, year(date_time, timezone), month(date_time, timezone), dayofmonth(date_time, timezone), start_time_hour, start_time_minute, 0)
p_comm_time_range_to_end_unix_time(string time_range, int date_time = time, string timezone = syminfo.timezone) =>
int end_time_hour = na
int end_time_minute = na
if str.length(time_range) == 11
end_time_hour := math.floor(str.tonumber(str.substring(time_range, 6, 8)))
end_time_minute := math.floor(str.tonumber(str.substring(time_range, 9, 11)))
else if str.length(time_range) == 9
end_time_hour := math.floor(str.tonumber(str.substring(time_range, 5, 7)))
end_time_minute := math.floor(str.tonumber(str.substring(time_range, 7, 9)))
timestamp(timezone, year(date_time, timezone), month(date_time, timezone), dayofmonth(date_time, timezone), end_time_hour, end_time_minute, 0)
p_comm_timeframe_to_seconds(simple string tf) =>
float seconds = 0
tf_lower = str.lower(tf)
value = str.tonumber(str.substring(tf_lower, 0, str.length(tf_lower) - 1))
if str.endswith(tf_lower, 's')
seconds := value
else if str.endswith(tf_lower, 'd')
seconds := value * 86400
else if str.endswith(tf_lower, 'w')
seconds := value * 604800
else if str.endswith(tf_lower, 'm')
seconds := value * 2592000
else
seconds := str.tonumber(tf_lower) * 60
seconds
p_custom_sources() =>
[open, high, low, close, volume]
//#endregion —————————————————————————————————————————————————————————————————
//#region —————————————————————————————————————————————————— Ta Dependence
p_ta_stoch(simple int k_length, simple int k_smoothing, simple int d_smoothing) =>
k = ta.sma(ta.stoch(close, high, low, k_length), k_smoothing)
d = ta.sma(k, d_smoothing)
[k, d]
//#endregion —————————————————————————————————————————————————————————————
//#region —————————————————————————————————————————————————— Constants
// Input Groups
string P_GP_1 = ""
//#endregion —————————————————————————————————————————————————————————
//#region —————————————————————————————————————————————————— Inputs
//#endregion ———————————————————————————————————————————————————————
//#region —————————————————————————————————————————————————— Price Data
//#endregion ———————————————————————————————————————————————————————————
//#region —————————————————————————————————————————————————— Indicators
[p_ind_1_k, p_ind_1_d] = p_ta_stoch(14, 1, 3) // STOCH
//#endregion ———————————————————————————————————————————————————————————
//#region —————————————————————————————————————————————————— Conditions
//#endregion ———————————————————————————————————————————————————————————
//#region —————————————————————————————————————————————————— Indicator Plots
// STOCH
plot(p_ind_1_k, "STOCH - K", color.rgb(41, 98, 255, 0), 1)
plot(p_ind_1_d, "STOCH - D", color.rgb(255, 109, 0, 0), 1)
p_ind_1_k_h0 = hline(80, "STOCH - Upper Band", color=#787B86)
hline(50, "STOCH - Middle Band", color=color.new(#787B86, 50))
p_ind_1_k_h1 = hline(20, "STOCH - Lower Band", color=#787B86)
fill(p_ind_1_k_h0, p_ind_1_k_h1, color=color.rgb(33, 150, 243, 90), title="STOCH - Background")
//#endregion ——————————————————��——————————————————————————————————————————————
//#region —————————————————————————————————————————————————— Custom Plots
//#endregion —————————————————————————————————————————————————————————————
//#region —————————————————————————————————————————————————— Alert
//#endregion ——————————————————————————————————————————————————————
How to Use Stoch Indicator
Using the Stochastic Oscillator effectively involves understanding its components and how they interact:
- Identifying Overbought and Oversold Levels: Traders look for readings above 80 to signal overbought conditions and below 20 for oversold conditions. This can help inform buy or sell decisions.
- Crossovers: The interaction between the %K and %D lines provides actionable signals. A bullish signal occurs when %K crosses above %D in an oversold region, while a bearish signal occurs when %K crosses below %D in an overbought area.
- Divergence: Observing divergence between price action and the Stochastic Oscillator can indicate potential reversals. For instance, if prices make new highs but the oscillator does not, it may suggest weakening momentum.
- Combining with Other Indicators: Many traders use the Stochastic Oscillator alongside other technical indicators (like moving averages) to confirm signals and reduce false positives.
Advantages of the Stoch
The Stochastic Oscillator offers several advantages that make it a favored tool among traders:
- Simplicity: Its straightforward interpretation aids quick decision-making. The bounded scale from 0 to 100 allows for easy identification of market conditions.
- Versatility: The indicator can be applied across various markets, including stocks, forex, and cryptocurrencies, making it adaptable for different trading styles.
- Early Signals: The Stochastic Oscillator can provide early warnings of potential trend reversals, allowing traders to capitalize on market movements before they occur.
- Divergence Detection: It helps identify divergences between price movements and momentum, which can be crucial for anticipating reversals.
Despite its advantages, traders should be aware of some limitations, such as potential false signals during strong trends or volatile markets.
Stoch in Trading Strategies
Incorporating the Stochastic Oscillator into trading strategies can enhance decision-making. Here are some effective approaches:
- Overbought/Oversold Strategy: Enter long positions when the oscillator moves below 20 and then crosses back above it. Conversely, initiate short positions when it rises above 80 and then crosses back below.
- Crossover Strategy: Focus on crossover points between %K and %D lines. A bullish crossover (when %K crosses above %D) in an oversold condition can signal a buying opportunity, while a bearish crossover (when %K crosses below %D) in an overbought condition suggests selling.
- Divergence Strategy: Monitor for divergences where price action contradicts oscillator signals. For example, if prices are making lower lows while the oscillator makes higher lows, this could indicate a bullish reversal.
- Multi-Timeframe Analysis: Combine signals from different timeframes to strengthen trading decisions. For instance, using a longer timeframe for trend direction while employing shorter timeframes for entry points can improve accuracy.
Conclusion
The ta.stoch function in Pine Script is an invaluable tool for traders looking to harness momentum indicators effectively. By understanding how to use the Stochastic Oscillator—identifying overbought/oversold levels, recognizing crossovers, and detecting divergences—traders can enhance their market analysis and decision-making processes.