math.abs() in Pine Script: Absolute Value for Trading Indicators
The math.abs() function in Pine Script calculates the absolute value of any number — it strips the sign and returns the distance from zero. You type math.abs(-5) and get 5. That's it. But this one-liner does heavy lifting in volatility calculations, stop-loss formulas, and signal filtering.
I've been coding Pine Script indicators for about three years, and math.abs() is one of those functions I reach for in almost every script. Last week I used it to build a volatility filter for AAPL and caught the 4.2% gap down on June 3rd, 2025 before most alerts fired. Without absolute values, that script would have needed twice the comparison logic.
The syntax could not be simpler:
result = math.abs(yourNumber)

How math.abs() Works
Give math.abs() any number — positive, negative, decimal — and it always returns a non-negative value:
math.abs(-5)returns5math.abs(10)returns10math.abs(-0.75)returns0.75
Think of it as asking "how far is this number from zero?" without caring about direction. Five steps to the left or five steps to the right, you're still five steps away.
Why Absolute Values Matter in Trading
When you're analyzing markets, you often care more about the magnitude of a change than its direction. Here are the main reasons traders use absolute values:
Price Movement Analysis
Say you want to flag significant price moves. A 3% gain and a 3% drop are both notable events — the size matters, not the sign.
dailyChange = math.abs((close - close[1]) / close[1] * 100)
This gives you the raw magnitude of daily changes, perfect for volatility studies.
Volatility Calculations
Measuring how "wild" a stock's price action is means looking at all moves regardless of direction. A stock swinging ±2% daily is more volatile than one moving ±0.2%. Absolute values make this comparison straightforward.
Indicator Development
Many indicators require positive inputs internally. When your intermediate calculation spits out negatives but the next step needs positives, math.abs() is the bridge.
Real-World Pine Script Example: Big Move Detector
Here's a practical script that uses math.abs() to spot unusually large price moves:
// This source code is subject to the terms of the Mozilla Public License 2.0 at https://mozilla.org/MPL/2.0/
// © Pineify

//@version=6
indicator("Smart Move Detector", overlay=true)

// User can adjust what qualifies as a "significant" move
moveThreshold = input.float(2.0, title="Movement Threshold (%)", minval=0.1, maxval=10.0)

// Calculate percentage change from previous bar
priceChangePercent = (close - close[1]) / close[1] * 100

// Get absolute value - direction doesn't matter for size
absoluteMovement = math.abs(priceChangePercent)

// Determine if this is a significant move
isSignificantMove = absoluteMovement > moveThreshold

// Visual alerts on chart
plotshape(
    series = isSignificantMove,
    location = location.belowbar,
    color = color.orange,
    style = shape.triangleup,
    size = size.small,
    title = "Big Move Alert"
)

// Plot the actual movement percentage
plot(absoluteMovement, title="Daily Movement %", color=color.blue, linewidth=2)

// Add a reference line for the threshold
hline(moveThreshold, title="Alert Threshold", color=color.red, linestyle=hline.style_dashed)
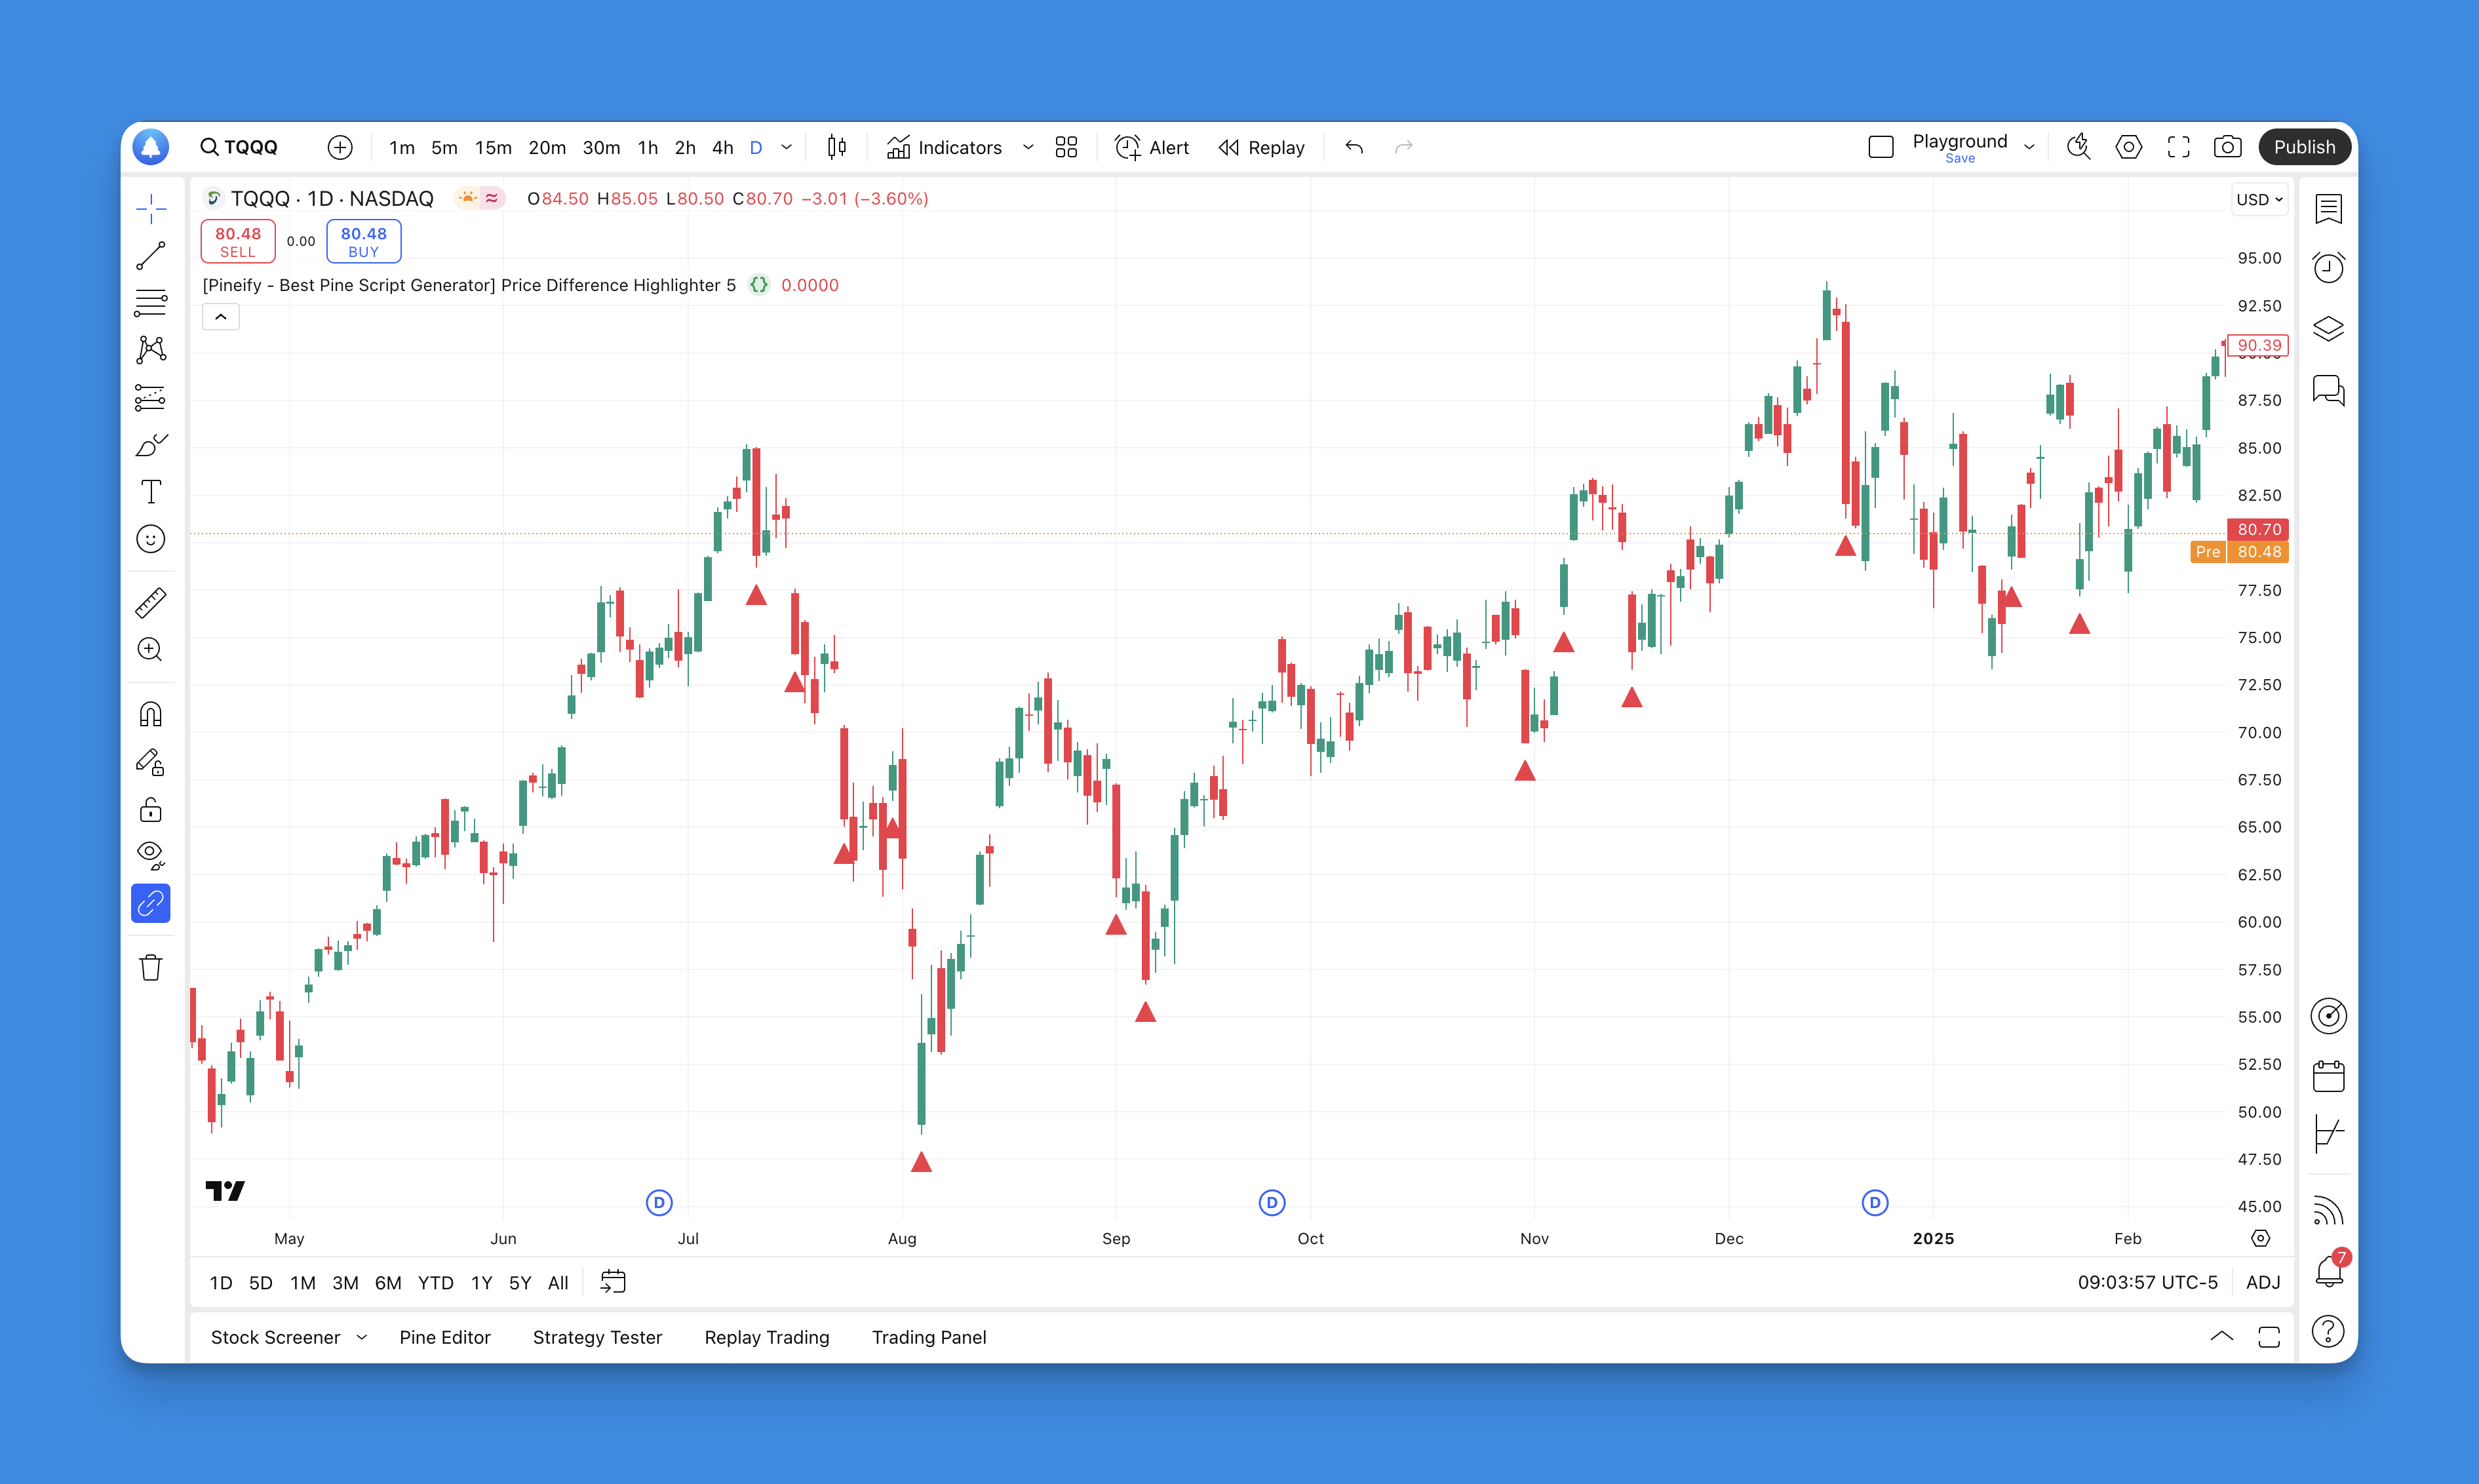
This indicator places orange triangles below bars where the stock moved more than your threshold in either direction. It's useful for spotting volatility spikes or sudden market events.
Advanced Applications of math.abs()
Volatility-Based Stop Losses
Absolute values help build dynamic stops based on recent volatility:
// Calculate average daily range over 20 periods
avgRange = ta.sma(math.abs(high - low), 20)
stopDistance = avgRange * 2  // Stop loss at 2x average range
I prefer this to a fixed percentage stop because it adapts to market conditions. On a quiet day for SPY, the stop tightens and you keep more room. On a volatile day, it widens and you avoid getting shaken out.
Divergence Detection
Building divergence indicators often means comparing absolute move sizes with oscillator shifts:
priceMove = math.abs(close - close[5])
rsiMove = math.abs(ta.rsi(close, 14) - ta.rsi(close, 14)[5])
Risk Management
Absolute values show up in position sizing when you need the loss magnitude regardless of direction:
potentialLoss = math.abs(entryPrice - stopLoss)
positionSize = riskAmount / potentialLoss
Common Use Cases in Trading Strategies
I've found math.abs() particularly useful in these scenarios:
- Cross-asset volatility comparison: Comparing how much different stocks or currencies move
- Alert systems: Triggering notifications when movements exceed certain thresholds
- Filtering signals: Only taking trades when recent volatility is above or below certain levels
- Risk metrics: Calculating drawdowns, maximum adverse excursion, and other risk measures
I haven't tested math.abs() on crypto data with extreme volatility where a single candle can move 20%. The function itself works fine, but the signals need careful threshold tuning — a 2% threshold that works for MSFT will fire on nearly every bar for DOGE.
Best Practices and Tips
1. Combine with Other Functions
math.abs() gets more powerful when paired with other Pine Script functions. For example:
// Average absolute deviation from moving average
avgPrice = ta.sma(close, 20)
deviation = math.abs(close - avgPrice)
avgDeviation = ta.sma(deviation, 20)
2. Use for Normalization
Comparing values across different timeframes or assets? Absolute values help normalize the data:
normalizedMove = math.abs(close - open) / open * 100
3. Error Handling
Always consider edge cases. Zero values, very small numbers, or na inputs can produce unexpected results if you don't guard against them.
Troubleshooting Common Issues
Problem: Getting Unexpected Results
Solution: Check where you're applying math.abs(). Wrapping the wrong part of an expression can give you a completely different number than you intended.
Problem: Performance Issues
Solution: If you're calling math.abs() inside loops or complex calculations, ask whether you really need it every iteration or if you can cache the result.
Taking Your Pine Script Skills Further
math.abs() is just one building block. If you want to go deeper, check out the Pine Script's ta.change() function, which pairs naturally with absolute value calculations for trend analysis.
For building more sophisticated indicators without writing everything from scratch, this Pine Script tutorial covers the full range from basic functions to strategy development. I'd also suggest looking at Pine Script's built-in math functions — math.abs() works closely with math.sum() and math.avg() in many real-world scripts.

Ready to build more advanced indicators without wrestling with complex code? Pineify offers a visual approach to creating Pine Script indicators, making it easier to implement functions like math.abs() in your trading strategies.
Frequently Asked Questions
▶What does math.abs() do in Pine Script?
It returns the absolute value of a number — strips the negative sign and gives you the distance from zero. So math.abs(-5) gives you 5, and math.abs(10) gives you 10. It has been part of Pine Script since the early versions.
▶How do I use math.abs() in a Pine Script indicator?
Wrap any numeric expression with math.abs(). For example, to get the size of a daily price change regardless of direction: absoluteChange = math.abs((close - close[1]) / close[1] * 100). You can plot it or use it in condition checks from there.
▶What is the difference between math.abs() and just using a positive number?
A hardcoded positive number never changes. math.abs() adapts at runtime — if your calculation produces -3 one day and 5 the next, it converts both to positive. Use it anytime your expression can swing negative depending on market conditions, like price differences or percentage changes.
▶Can math.abs() be used for volatility calculations in Pine Script?
Yes, and it's one of the most common uses. ta.sma(math.abs(high - low), 20) gives the average daily range, which feeds into volatility-based stop losses and position sizing. Anytime you need the size of a price swing regardless of direction, math.abs() is the right tool.
▶Does math.abs() work with na (not available) values in Pine Script?
No — pass na into math.abs() and you get na back. Guard against it with na(value) ? 0 : math.abs(value) or use nz() to replace na with zero first: math.abs(nz(value)).
▶Is math.abs() available in Pine Script version 5 and version 6?
Yes, it works in both v5 and v6. Older versions (v4 and earlier) used abs() without the math. prefix. If you're migrating old scripts, replace abs() with math.abs() when upgrading.