
564 posts tagged with "TradingView"

Blog posts related to the TradingView

View All Tags

Pineify Finance AI Agent: Agentic AI for Finance and Accounting

· 15 min read
Pineify Team
Pine Script and AI trading workflow research team

Imagine an analyst who never sleeps, never misses a number, and finishes 100 reconciliation line items while you're still on your first cup of coffee. Agentic AI for finance and accounting is exactly that — autonomous AI systems that plan, execute, and adjust multi-step financial tasks without waiting for step-by-step instructions. Leading this shift is the Pineify Finance AI Agent, purpose-built to handle complex financial work on its own, with speed and real accuracy.


Agentic AI for Finance and Accounting: How Pineify Finance AI Agent Transforms the Industry

SuperTrend Indicator: Signals, ATR Settings, and Strategies That Work

· 15 min read
Pineify Team
Pine Script and AI trading workflow research team

The SuperTrend indicator is a volatility-based trend-following tool developed by Olivier Seban. It plots a dynamic line right on your price chart — green below price means bullish, red above means bearish. I've tested this indicator on AAPL, BTC/USD, and EUR/JPY across multiple timeframes, and I can tell you: the signals are easy to read, but dialing in the settings for your specific instrument takes some work.


SuperTrend Indicator: Complete Guide to Signals, Settings & Proven Strategies

Stochastic Oscillator vs RSI: Which Momentum Indicator Fits Your Style

· 15 min read
Pineify Team
Pine Script and AI trading workflow research team

The Relative Strength Index (RSI) is a momentum indicator that measures how fast and how much prices have changed by comparing average gains to average losses over a default 14-period lookback. The Stochastic Oscillator measures where the current closing price sits within a recent high-low range. I've traded both side by side for over three years, and the verdict is this: RSI handles trending markets cleanly because its smoothing cuts through noise, while the Stochastic shines in range-bound conditions where its speed catches reversals at support and resistance.

Stochastic Oscillator vs RSI: Which Momentum Indicator Matches Your Trading Style?

Best AI for Coding MQL5: MetaTrader 5 Developer Tools Compared

· 14 min read
Pineify Team
Pine Script and AI trading workflow research team

I've spent roughly 40 hours debugging MQL5 code that a generic AI wrote in 30 seconds. That math never works in your favor. The best AI for coding MQL5 is one that understands MetaTrader 5's type system, event handlers, and standard library deeply — not a general-purpose model faking its way through a niche language. By 2026, for serious MT5 development, that distinction is the difference between hours of manual fixes and code that compiles on the first try.


Best AI for Coding MQL5: Expert Guide for MetaTrader 5 Developers

Lorentzian Classification KNN ML Indicator for TradingView

· 19 min read
Pineify Team
Pine Script and AI trading workflow research team

If you've spent any time in trading, you know the frustration of watching a signal indicator that looked great in theory fail the moment you go live. Traditional indicators like RSI or MACD use fixed formulas that don't adapt to changing market conditions. They treat every market period the same — whether it's a quiet Tuesday morning or the week of a major Fed announcement.

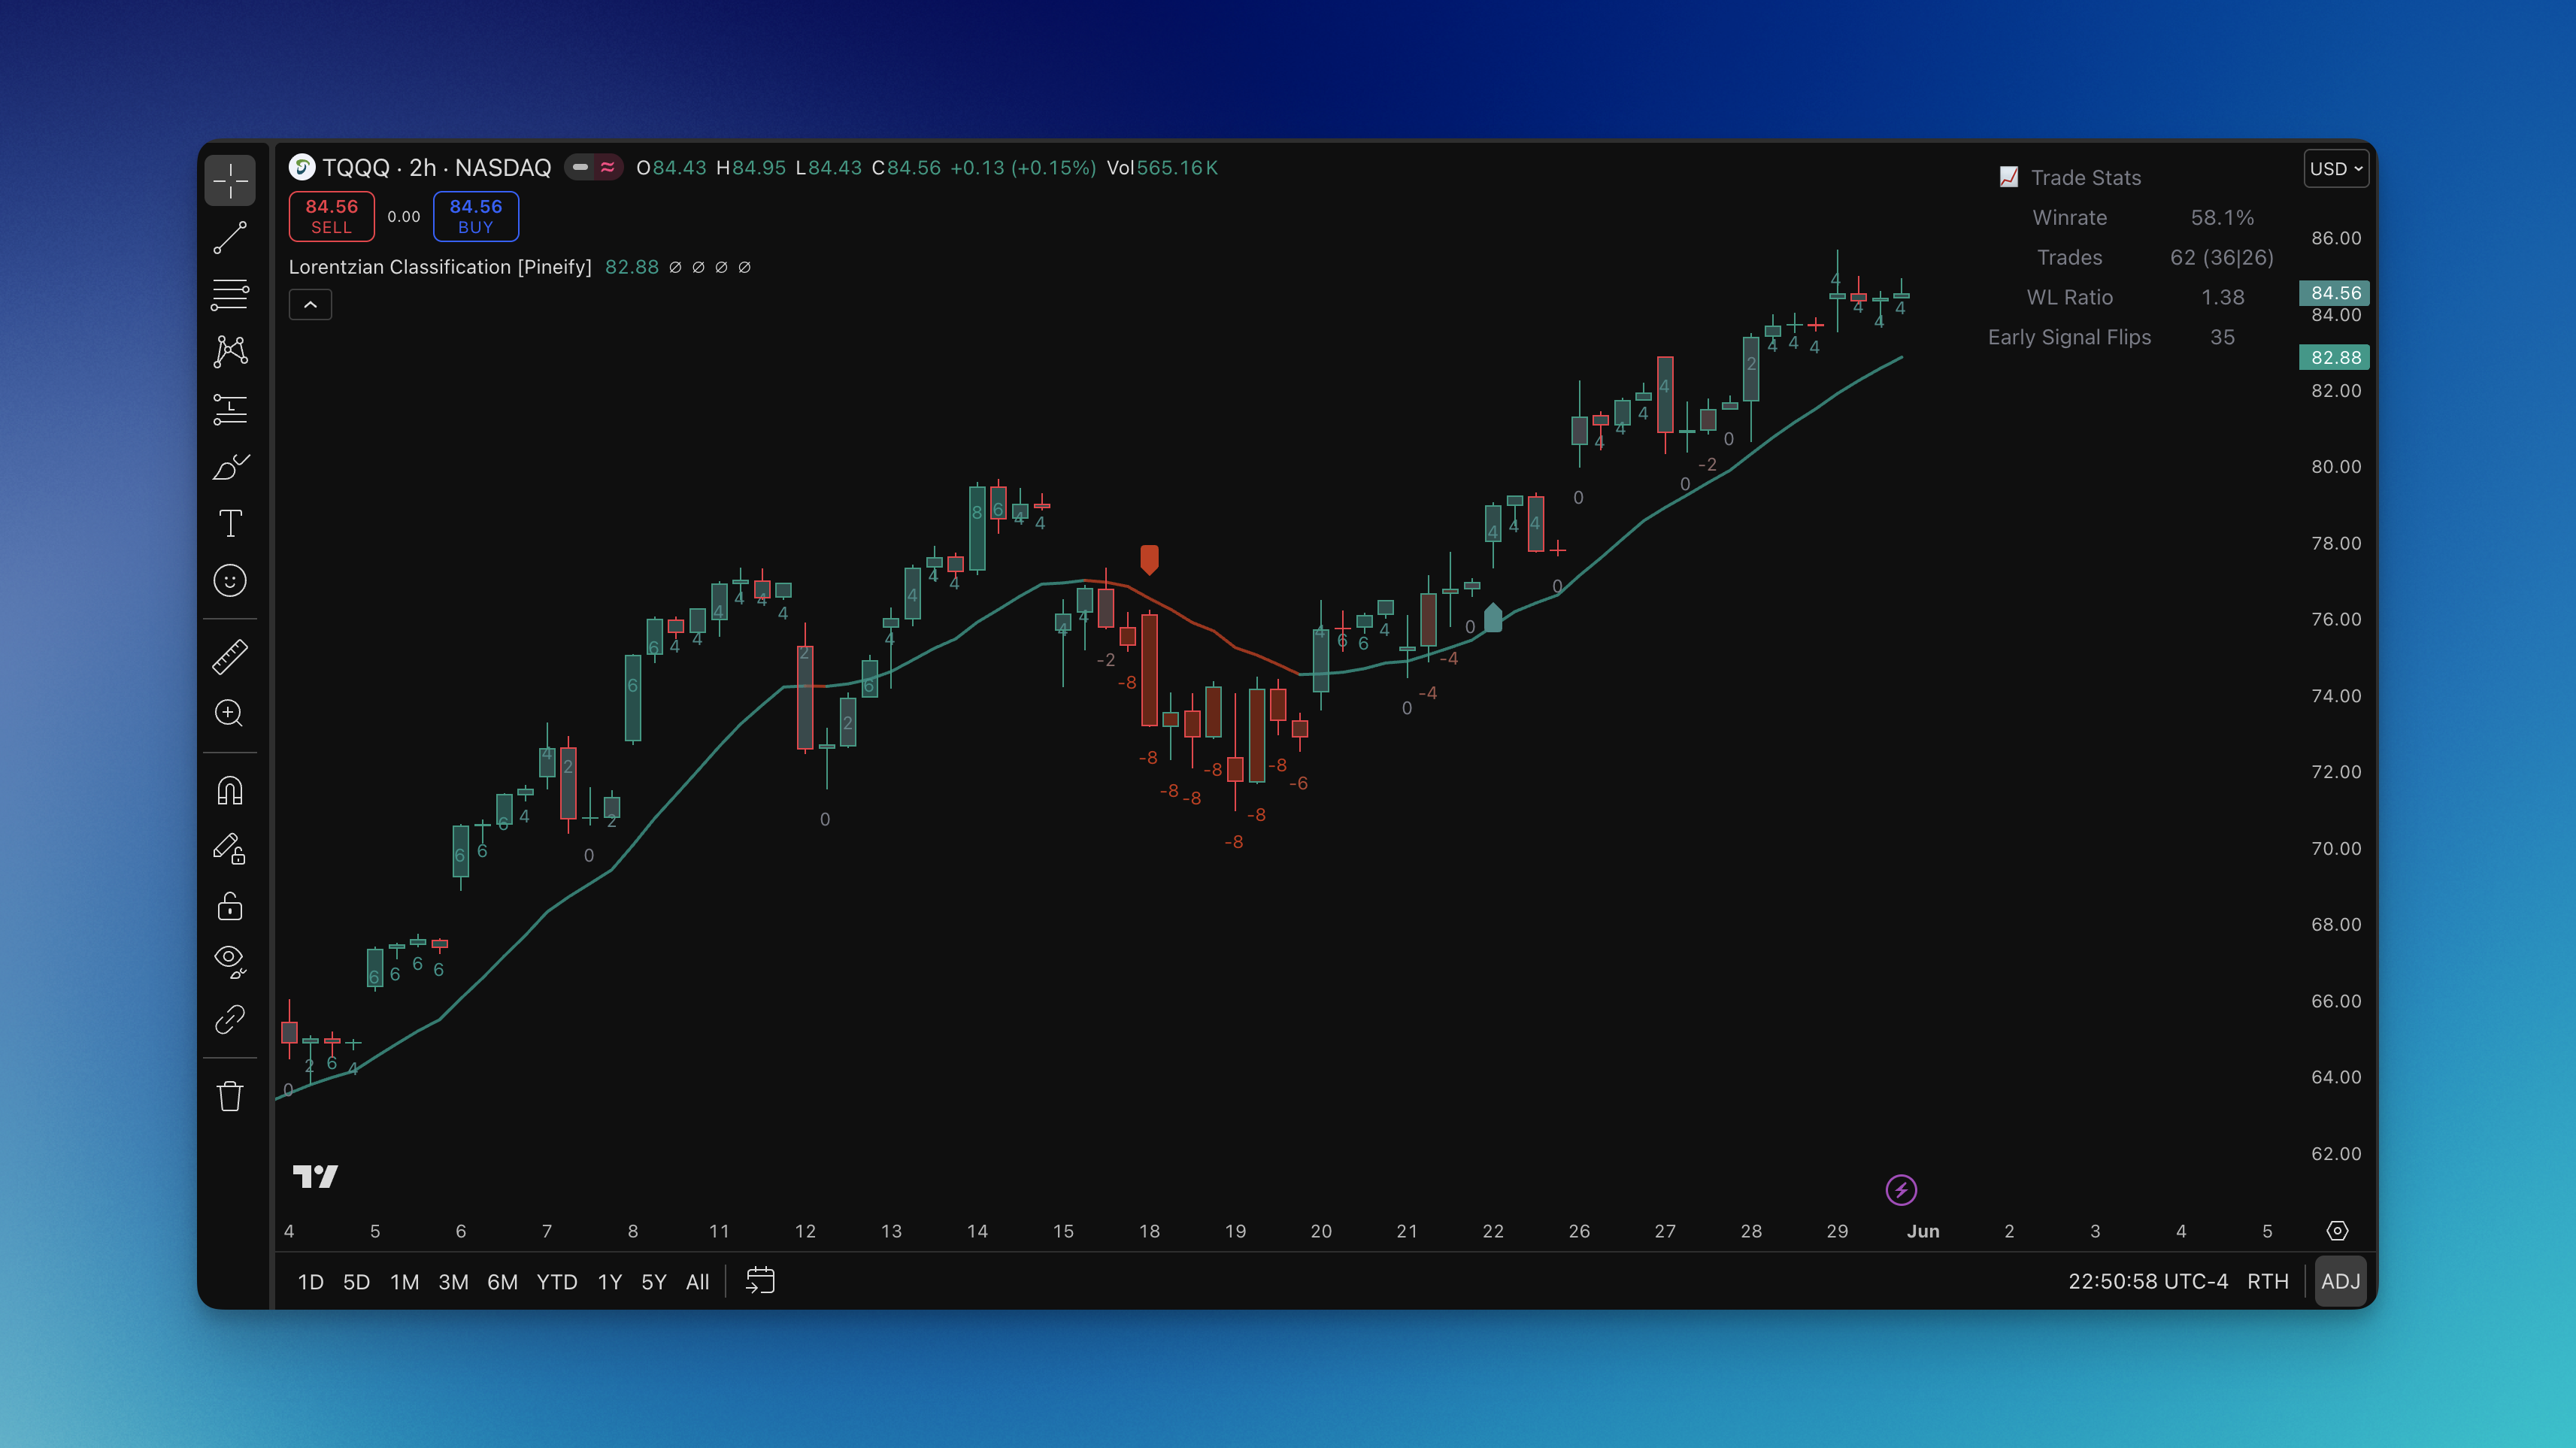
The Lorentzian Classification indicator is a different approach. Instead of a fixed formula, it uses K-Nearest Neighbors (KNN) with a physics-inspired distance metric to classify whether price is likely to move up or down over the next four bars. After testing it across BTC/USDT, major forex pairs, and index futures on multiple timeframes, I've found it to be one of the most adaptable signal generators available in Pine Script.

Lorentzian Classification indicator on TradingView chart showing buy and sell signals with kernel regression line

Squeeze Momentum Indicator: How to Trade Explosive Breakouts

· 12 min read
Pineify Team
Pine Script and AI trading workflow research team

Most momentum indicators tell you what's already happening. The squeeze momentum indicator works differently — it tries to signal what's about to happen next. The squeeze momentum indicator is a volatility and momentum tool that combines Bollinger Bands with Keltner Channels and adds a histogram to show building pressure. John Carter made it famous in Mastering the Trade, and the LazyBear version on TradingView made it accessible to everyone.

I've traded the SMI on SPY daily charts since early 2023, and squeezes lasting 8+ bars give me the most reliable entries. On AAPL, I've had false signals during sideways consolidation — which is why I won't take a squeeze without volume confirmation.


Squeeze Momentum Indicator: Complete Guide to Trading Explosive Breakouts