
66 posts tagged with "Indicator"

Blog posts related to the Indicator

View All Tags

Premium TradingView Scripts & Indicators with Full Source Code

· 11 min read
Pineify Team
Pine Script and AI trading workflow research team

When I first moved from default TradingView studies to paid tooling back in October 2025, the part that bothered me was opacity. I could see lines and labels on TSLA and SPY, but I couldn't see the logic behind them. Pineify Premium Scripts are lifetime-access TradingView indicators and strategies delivered with full open Pine Script source code -- you paste it, read it, and you can modify it. That transparency matters more to me than any single entry signal.

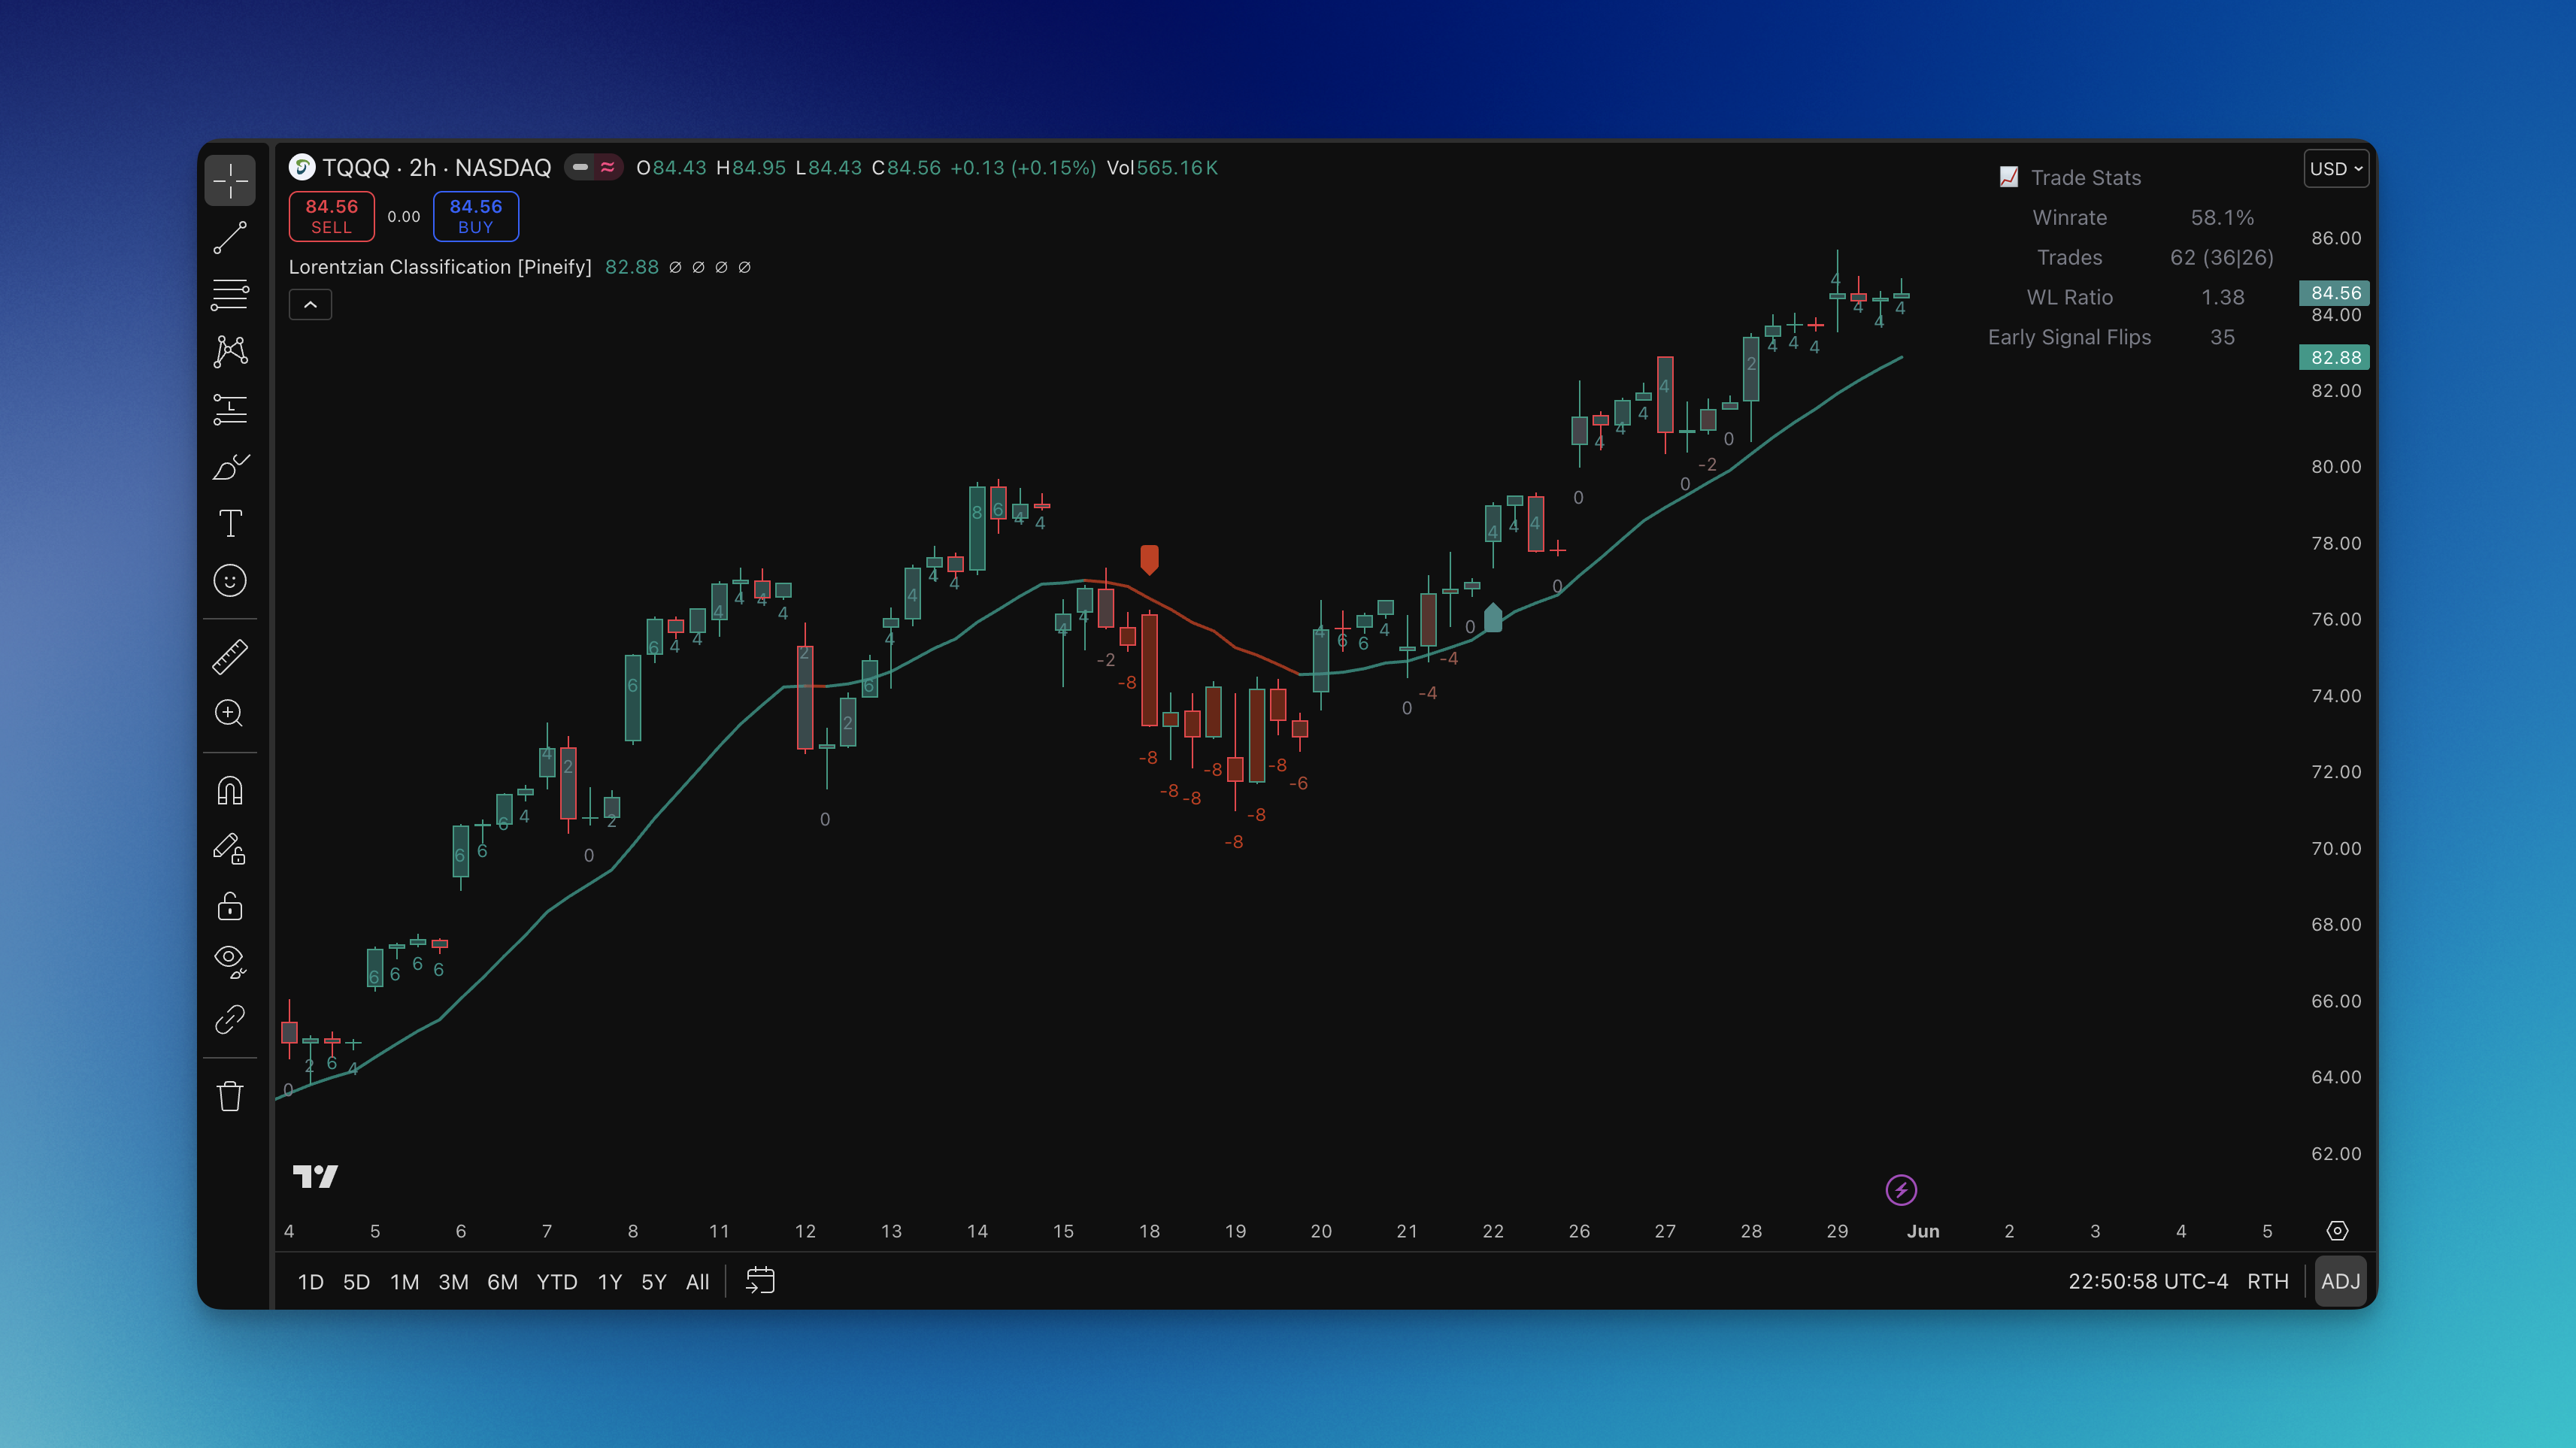
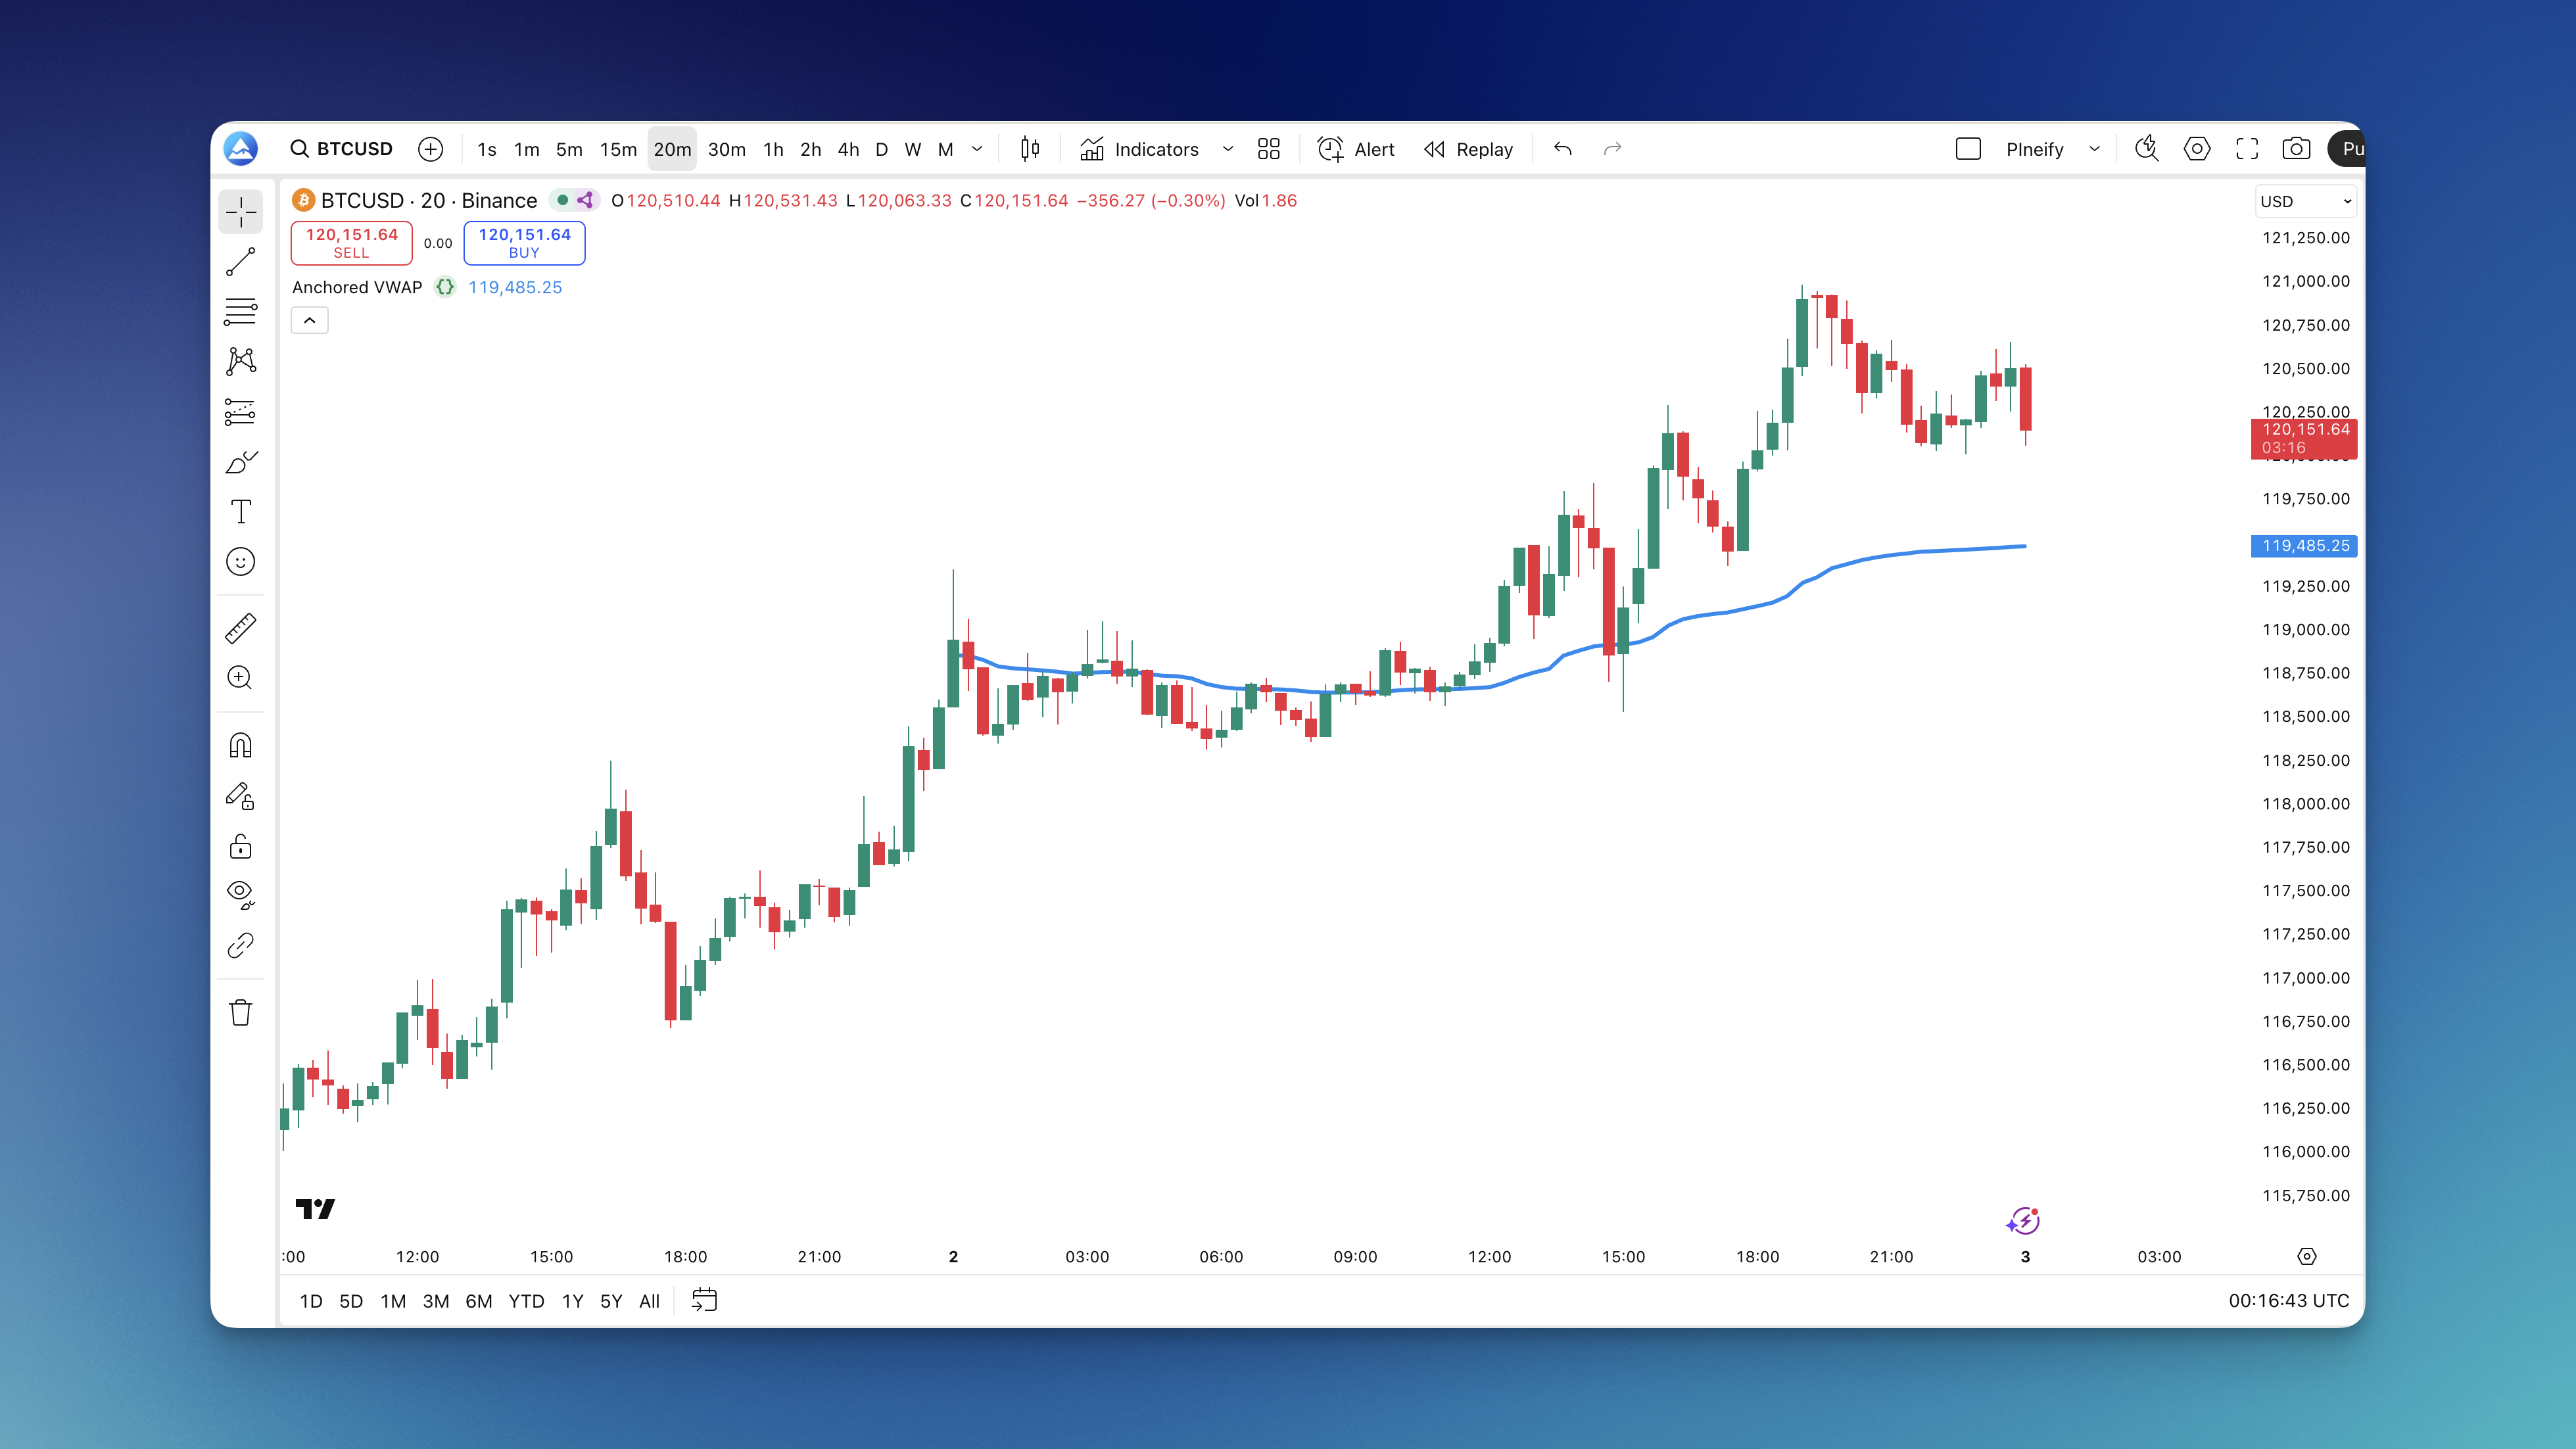
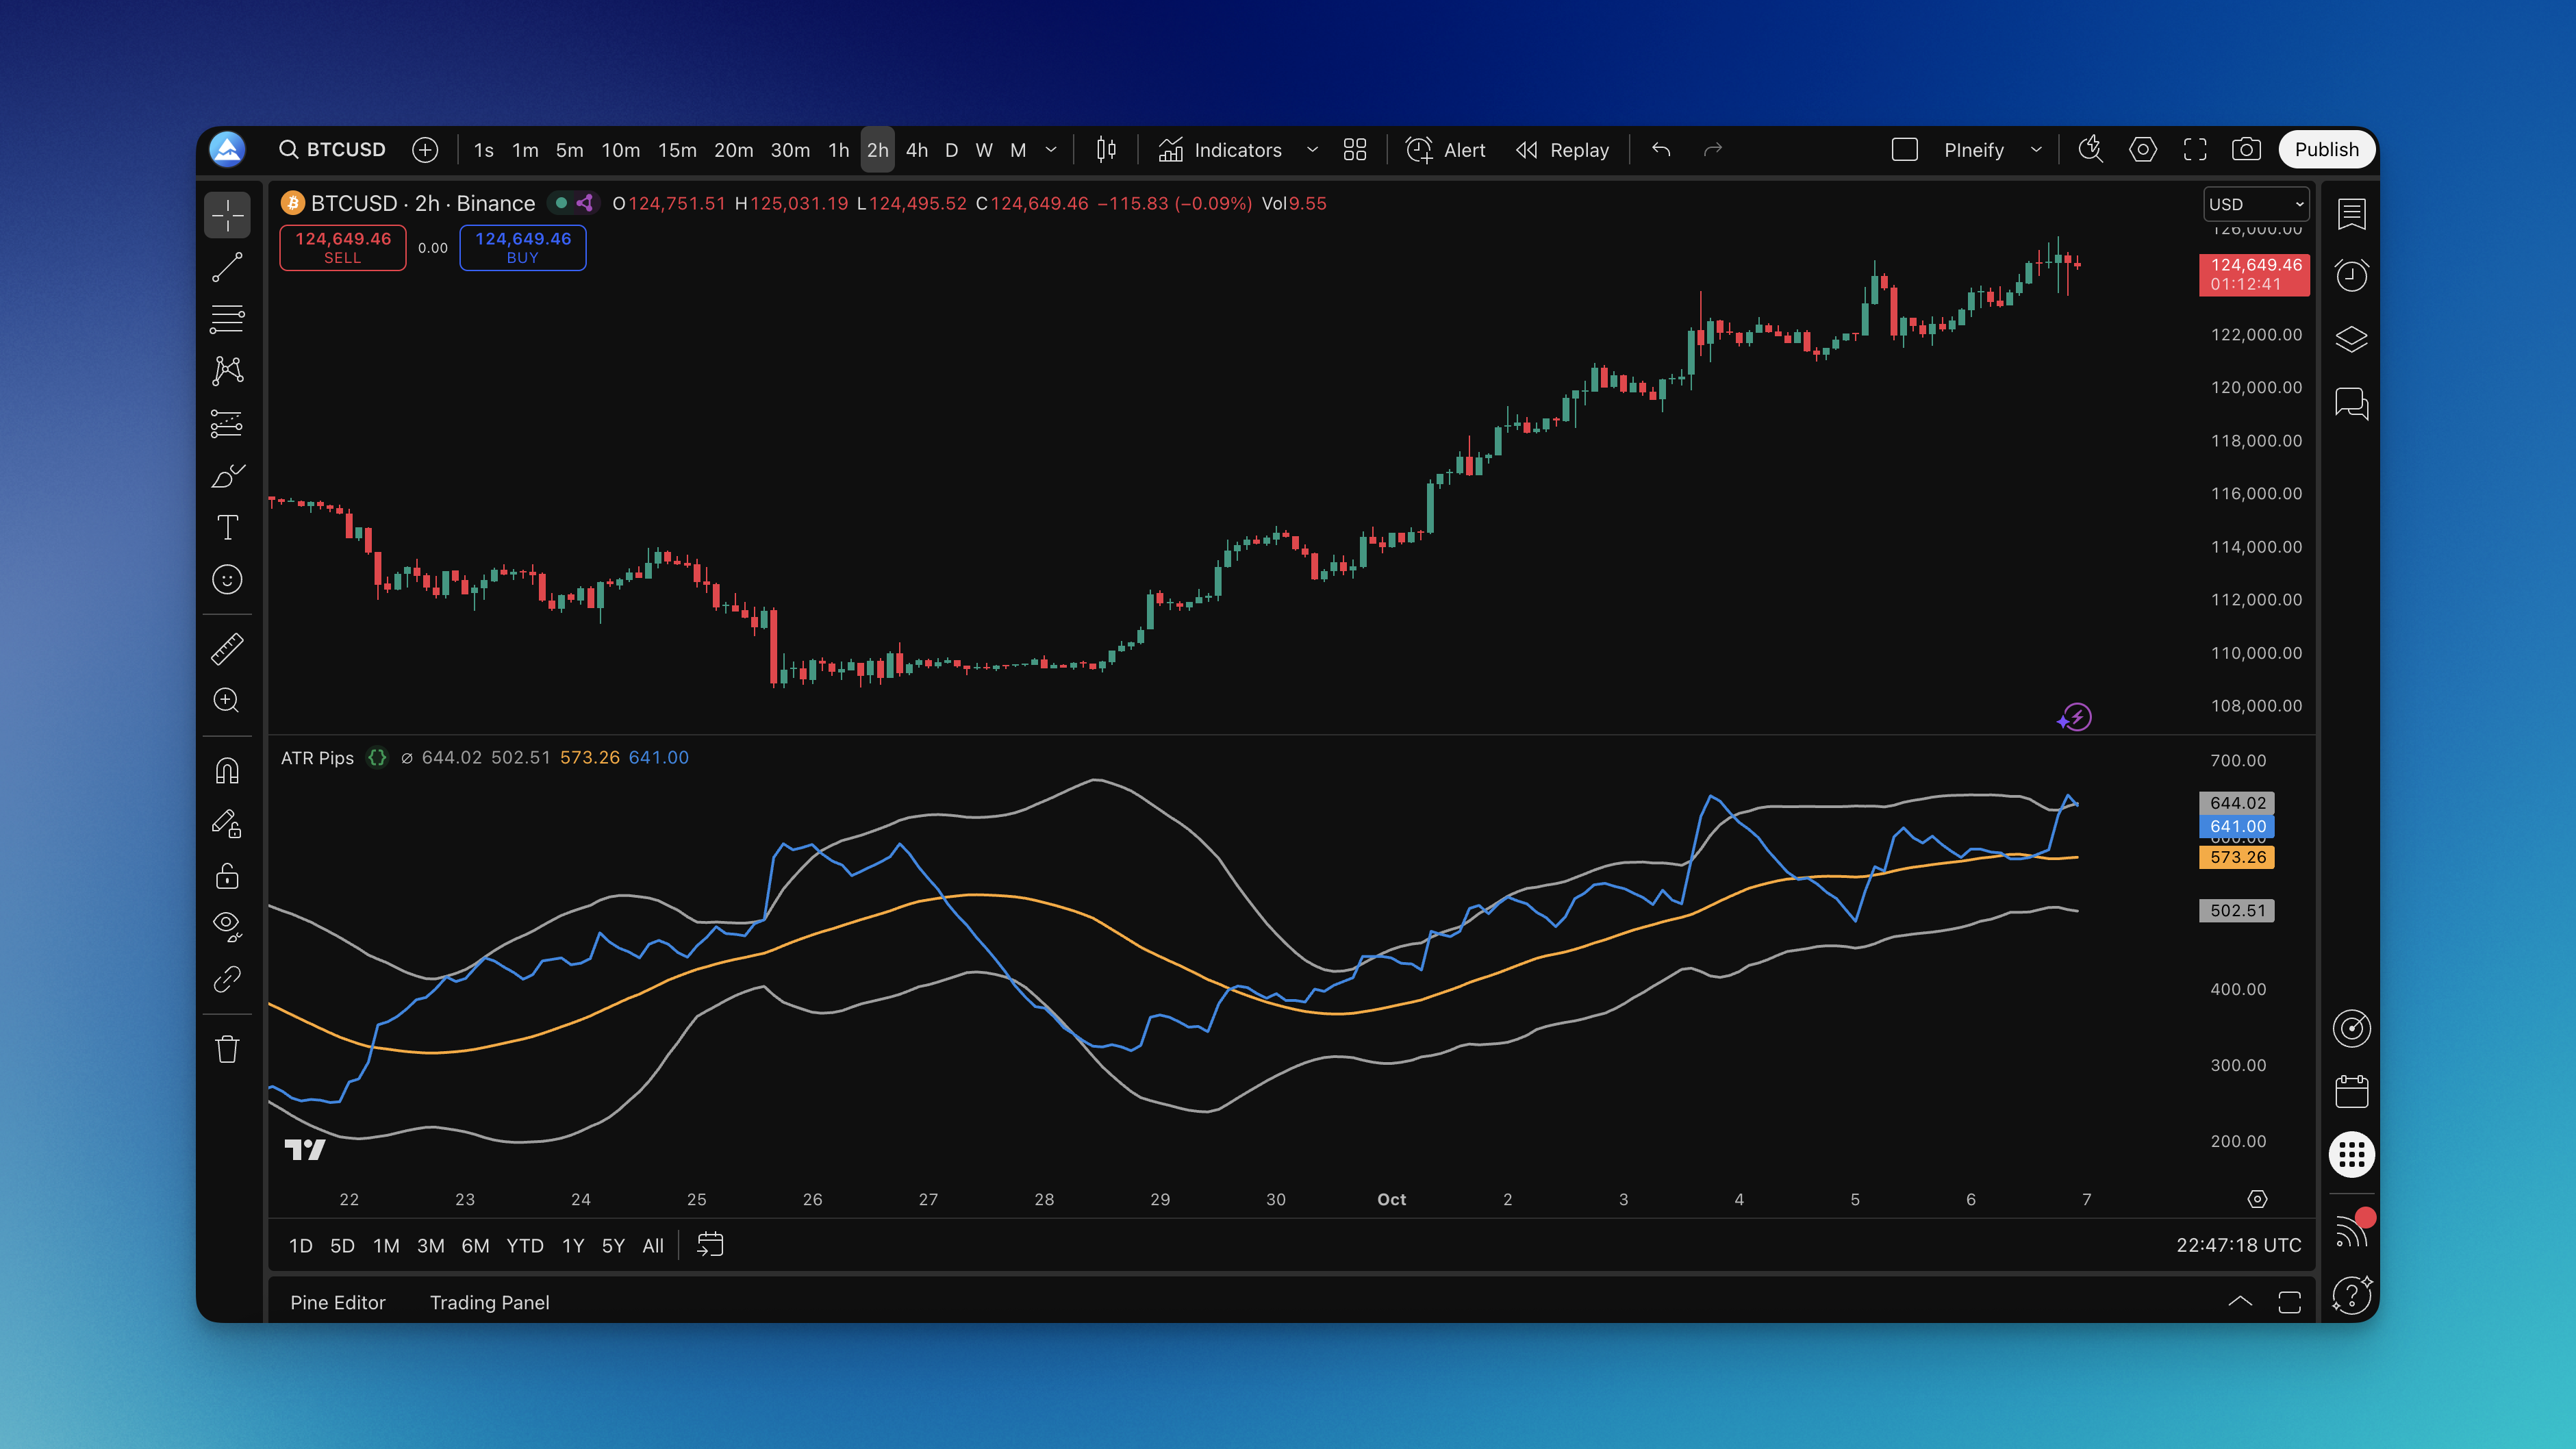
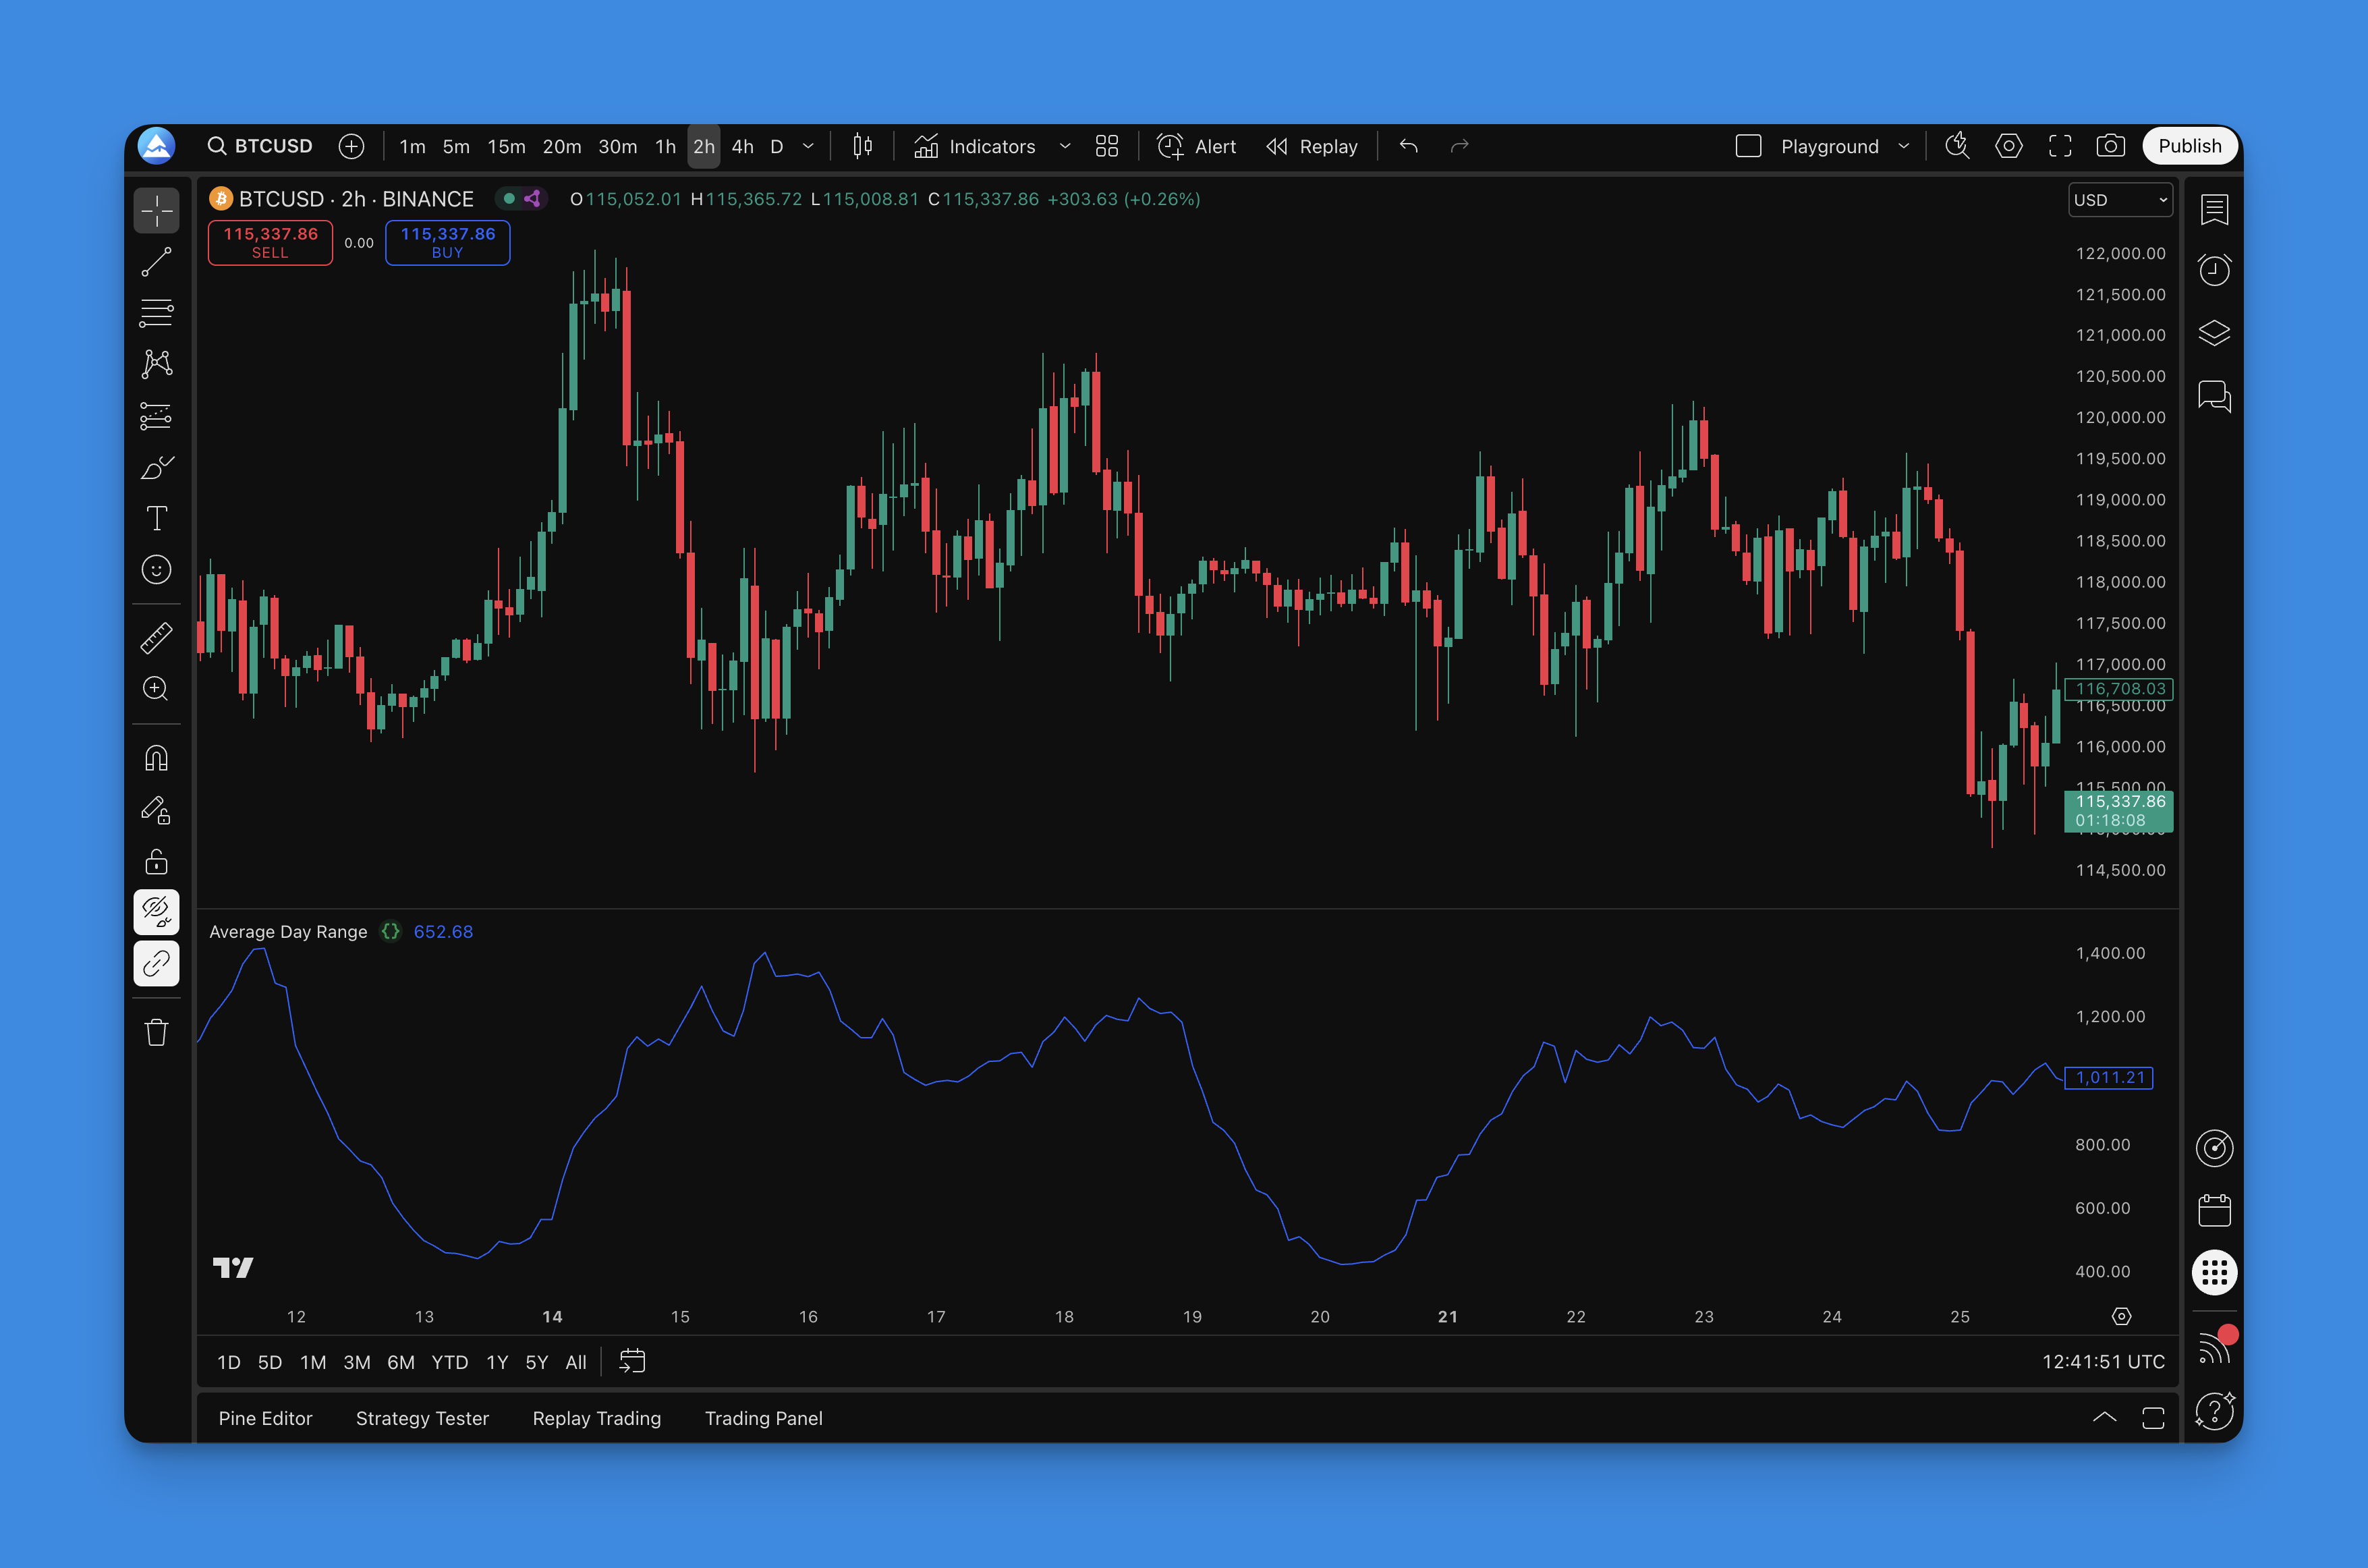
The collection pairs six distinct tools covering trend, momentum, structure, and daily volume behavior. Together they read less like a random marketplace grab bag and more like a small desk of complementary overlays and studies. Lifetime access is the practical anchor: once you open through the Pineify Advanced plan, you keep the scripts and related updates rather than renting access month to month.

I've tested maybe thirty indicator bundles in the last two years, and most of them make you trust a black box. This one doesn't. The source is the contract: if I can read the code, I can reason about edge cases, session quirks, and when a signal should be ignored.

52 Week High Low Indicator: Trade Annual Price Levels on TradingView

· 13 min read
Pineify Team
Pine Script and AI trading workflow research team

The 52 Week High Low indicator is a price tracking tool that marks the highest and lowest prices an asset has reached over the past year. It plots two horizontal lines on your chart, giving you instant reference points that institutional traders, retail investors, and algorithms all watch.

Ever wonder why certain price levels seem to act like invisible walls in the market? When a stock hits its yearly high, everyone who bought during the previous 52 weeks is sitting on profit. Some will take gains, creating natural selling pressure. When price approaches the annual low, value hunters often step in, believing they're getting a bargain. These aren't random levels — they're zones where real money changes hands.

Adaptive Moving Average (AMA): The Smart MA for Any Market

· 10 min read
Pineify Team
Pine Script and AI trading workflow research team

Here's something that frustrated me for years: regular moving averages treat every price movement the same way. Whether the market is screaming in one direction or just bouncing around going nowhere, a simple moving average doesn't care—it just averages the numbers.

The Adaptive Moving Average (AMA) is a trend-following indicator developed by Perry Kaufman that adjusts its smoothing based on how efficiently price moves. When the market is trending strongly, the AMA speeds up to stay close to the action. When it gets choppy, the indicator slows down to filter out noise. It's like having a moving average that reads the room.

This isn't just a neat trick—it solves the two biggest problems traders face with traditional moving averages: lagging behind during strong trends and getting whipsawed during consolidation. The AMA adjusts its sensitivity automatically based on how efficiently price is moving.

Lorentzian Classification KNN ML Indicator for TradingView

· 19 min read
Pineify Team
Pine Script and AI trading workflow research team

If you've spent any time in trading, you know the frustration of watching a signal indicator that looked great in theory fail the moment you go live. Traditional indicators like RSI or MACD use fixed formulas that don't adapt to changing market conditions. They treat every market period the same — whether it's a quiet Tuesday morning or the week of a major Fed announcement.

The Lorentzian Classification indicator is a different approach. Instead of a fixed formula, it uses K-Nearest Neighbors (KNN) with a physics-inspired distance metric to classify whether price is likely to move up or down over the next four bars. After testing it across BTC/USDT, major forex pairs, and index futures on multiple timeframes, I've found it to be one of the most adaptable signal generators available in Pine Script.

Lorentzian Classification indicator on TradingView chart showing buy and sell signals with kernel regression line

Anchored VWAP Indicator: Volume-Weighted Price Tool for TradingView

· 11 min read
Pineify Team
Pine Script and AI trading workflow research team

You know that feeling when a stock makes a huge move after earnings, and you wonder what the real price people have been paying since that announcement is? That's what Anchored VWAP shows you.

Regular VWAP resets every day at market open. Anchored VWAP? You pick the starting point — an earnings release, a breakout level, a session open, whatever matters. From that moment forward, it calculates the volume-weighted average price. Think of it as fair value since the event you care about.

When price sits above your Anchored VWAP line, buyers have had control since that anchor. When it's below, sellers have been winning. I've anchored to AAPL after its 2023 Q4 earnings and watched the line act as support for three consecutive sessions — that tells me institutional money respects that level. It's a single line that says, "Here's what the crowd has actually paid on average since the thing that mattered happened."

Anchored VWAP Indicator

ALMA Indicator: Arnaud Legoux Moving Average Settings and Strategies

· 14 min read
Pineify Team
Pine Script and AI trading workflow research team

After more than ten years on trading screens, I'll tell you something that still surprises me: most people reach for the same SMAs and EMAs, but the indicator I keep coming back to flies under the radar. The Arnaud Legoux Moving Average (ALMA) is a weighted moving average that uses a Gaussian bell curve distribution to cut lag while keeping signals readable. Arnaud Legoux and Dimitrios Kouzis-Loukas designed it to fix the trade-off between speed and smoothness that every moving average inherits.

Regular averages either drag behind price (SMA) or rattle with false signals (EMA). ALMA sidesteps both by applying a bell curve so recent prices carry more weight, but the transition stays smooth, not abrupt. You tune it with three knobs: window length, offset, and sigma. I've been running ALMA on my 4-hour EUR/USD charts for about 18 months now, and it calls trend shifts before my old 20 EMA does.

ATR Pips Indicator: Convert ATR to Pip Values for Forex Stop Losses

· 13 min read
Pineify Team
Pine Script and AI trading workflow research team

Ever stared at your ATR indicator wondering what the heck 0.00125 means for your EUR/USD trade? You're not alone. Your broker talks in pips, your risk calculator needs pips, but your volatility indicator speaks in decimals that make no sense at 2 AM when you're trying to set a stop loss.

Here's the thing—ATR is brilliant for measuring market volatility, but it's useless for forex traders who think in pips. That's exactly why the ATR Pips indicator exists. It takes that confusing decimal and turns it into something you can actually use: real pip values that make sense for your trading decisions.

ATR Pips Indicator

Average Day Range Indicator: Better Risk Management on TradingView

· 12 min read
Pineify Team
Pine Script and AI trading workflow research team

The Average Day Range (ADR) indicator measures how much an asset typically moves in a single session. Take TSLA — I've been tracking it since March 2025, and on a normal day it swings about $12 to $15 between high and low. When I saw ADR spike to $28 on April 3, 2026, I knew something was off before the earnings miss hit the news. That's what ADR gives you: a volatility benchmark that actually means something.

Most traders I know jump straight to RSI or MACD. I've done that too. But ADR is the one I check first now, because it tells me what the market is doing instead of what it already did. It's not complicated — you don't need a math degree or a PhD in quantitative finance.

Average Day Range Indicator

Awesome Oscillator Indicator: Momentum Changes on TradingView

· 11 min read
Pineify Team
Pine Script and AI trading workflow research team

The Awesome Oscillator is a momentum indicator created by Bill Williams that compares short-term price velocity to its medium-term counterpart. I'll be honest - when I first stumbled across this thing, I thought the name was pure marketing fluff. After running it on AAPL and TSLA daily charts for the past two years, it's become one of my most reliable tools.

Here's the math: AO = SMA(5) of midpoint - SMA(34) of midpoint. Midpoint is just (high + low) / 2. Think of it like checking your car's acceleration - you'll know if you're speeding up or slowing down before the speedometer moves. Green bars mean momentum is building. Red bars? Things are cooling off.