EMA Settings for Five-Minute TradingView Charts: Compare and Test

· 8 min read

Pineify Team
Pine Script and AI trading workflow research team

There is no verified best EMA length for every five-minute TradingView chart. A 9/20 pair, 5/8/13 ribbon, and longer 50/200 averages are different ways to summarize the same price history. Choose a small set of candidate rules, hold the data and execution assumptions constant, and compare results after costs before preferring one.
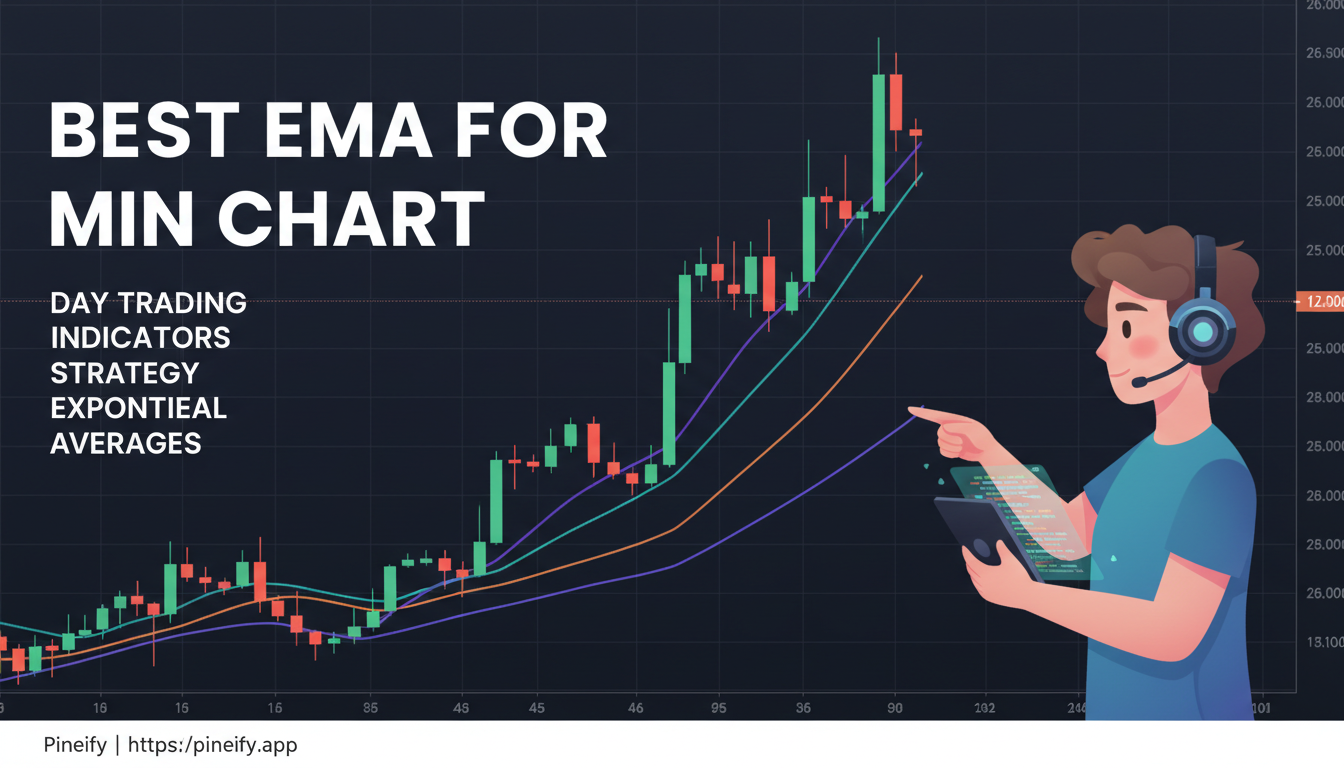
Best EMA for 5 Min Chart TradingView: Complete Guide to Exponential Moving Averages for Day Trading

Exit Indicators on TradingView: Rules, Orders, and Testing

· 9 min read
Pineify Team
Pine Script and AI trading workflow research team

An exit indicator supplies a condition or reference level; it does not automatically close a broker position or guarantee a profit. On TradingView, useful choices include ATR-based levels, Chandelier Exit, Supertrend, moving-average rules, and momentum conditions. The right comparison holds entries constant and measures how each fully specified exit changes net results, drawdown, and exposure.

Best Exit Indicator TradingView: Complete Guide to Maximizing Your Trading Profits

Fair Value Gap Indicators on TradingView: Definitions and Comparison

· 8 min read
Pineify Team
Pine Script and AI trading workflow research team

A fair value gap indicator marks a defined three-candle price pattern. The useful comparison is whether the script's detection, mitigation, timeframe, and history rules match your research question. A highlighted zone does not establish institutional activity, a required future fill, or a profitable entry. No independently verified success rate is presented here.

Best Fair Value Gap Indicator TradingView: A Complete Guide to Trading Market Imbalances

Free TradingView Indicators: Built-in Studies and Public Scripts

· 8 min read
Pineify Team
Pine Script and AI trading workflow research team

Free TradingView indicators can describe trend, momentum, volatility, and trading activity without a separate script subscription. That does not make every TradingView feature free, or establish that an indicator produces profitable trades. Start with a calculation you can explain, then check its timing and the account features it requires.

The selection below combines built-in studies with identifiable public scripts. It is a functional comparison, not a ranking based on an unpublished trading experiment.

MACD on TradingView: Settings, Signals, and Custom Script Checks

· 9 min read
Pineify Team
Pine Script and AI trading workflow research team

MACD measures the difference between two moving averages and compares that difference with a smoothed signal line. On TradingView, the useful choice is not a universally “best” script: it is a calculation and signal definition that you can reproduce on the intended chart.

This guide explains the standard settings, distinguishes crossover and divergence conditions, and shows what to check before adding filters, higher-timeframe data or alerts. It does not report an independently measured advantage for any configuration.

Best MACD Indicator TradingView: Complete Guide to Settings, Strategies, and Top Scripts

MACD Settings for One-Minute TradingView Charts: A Testing Guide

· 9 min read
Pineify Team
Pine Script and AI trading workflow research team

There is no universally best MACD setting for a one-minute TradingView chart. Shorter lengths change how much weight recent bars receive; they do not establish better entries or a higher win rate. For scalping, execution costs and the time a signal becomes available can matter as much as the chosen lengths.

Compare 6/13/5, 3/10/3, 5/13/6 and 8/17/9 against a 12/26/9 reference under the same trading rules. The configurations below are candidates for a controlled comparison, not reported profitable systems.

Best MACD Settings for 1 Minute Chart TradingView

Best Monitor for TradingView: Resolution, Layout, and Compatibility

· 9 min read
Pineify Team
Pine Script and AI trading workflow research team

The best monitor for TradingView is one that displays your actual chart layout at a readable size and works with your computer's outputs. Resolution, scaling, desk depth and connection support are more useful selection criteria than a claim that one screen improves trading performance.

The models below illustrate three different layouts: a standard QHD screen, a large 4K panel and a curved ultrawide. Their specifications come from manufacturer documentation. This is not a hands-on comparison, and no measured trading-speed or eye-comfort advantage is claimed.

Best Monitor for TradingView: Complete Guide for Traders

Open Interest Indicators on TradingView: Sources, Units, and Limits

· 8 min read
Pineify Team
Pine Script and AI trading workflow research team

Open interest counts outstanding derivative contracts, not traders or net bullish positions. TradingView's built-in study and community scripts can display or transform available OI data, but their coverage, units and update frequency differ. Choose the tool by the data question rather than assuming that rising OI confirms a profitable trade.

This comparison covers the built-in Open Interest study, a multi-exchange USD aggregator, Open Interest Footprint IQ and Leviathan's visible-range profile. No live-trading performance comparison or predictive lead time is claimed.

Best Open Interest Indicator TradingView: Complete Guide for Traders