

Company research
Stock News Search
Find recent coverage for a company, review the original sources, and continue the analysis in the same Finance Agent conversation.
Example: “What is the latest news for Tesla?”
Explore this capabilityBrowse focused capability pages to see what Pineify Finance Agent can help you investigate and which journal operations change saved records. Open a capability for its inputs, limits, and example requests.
Research capabilities
Find recent coverage for a company, review the original sources, and continue the analysis in the same Finance Agent conversation.
Example: “What is the latest news for Tesla?”
Explore this capability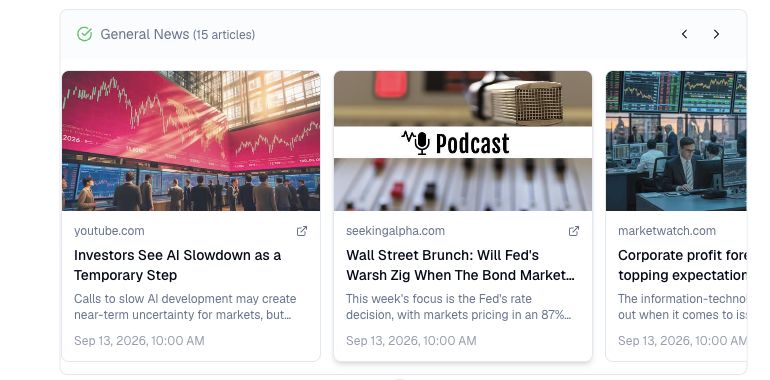
Scan broad financial coverage, compare themes in the returned stories, and keep the original sources ready for deeper research.
Example: “Retrieve today’s available general financial news. State the date range and article count, summarize themes in that sample, and include original sources.”
Explore this capability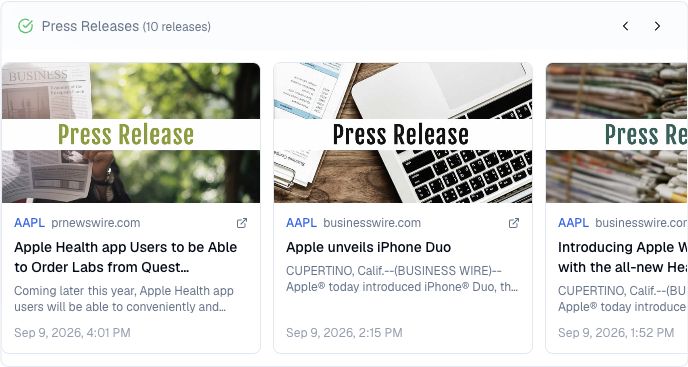
Review press releases associated with a company, identify the changes being announced, and open the source for closer inspection.
Example: “Find the latest press releases associated with Apple and summarize the company-relevant announcements. Include source links and identify who issued each release.”
Explore this capability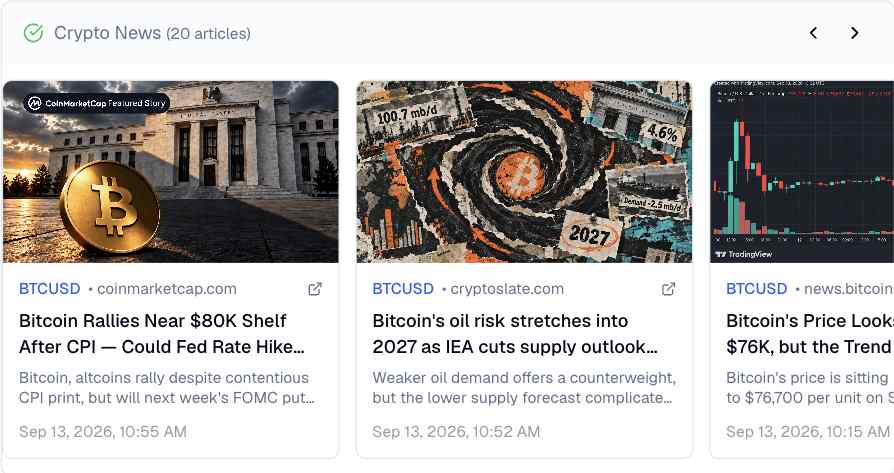
Follow news about Bitcoin, Ethereum, and other crypto assets, organize the main themes, and inspect the original coverage.
Example: “Find the latest Bitcoin and Ethereum news. Organize the most important themes and include the original source links.”
Explore this capability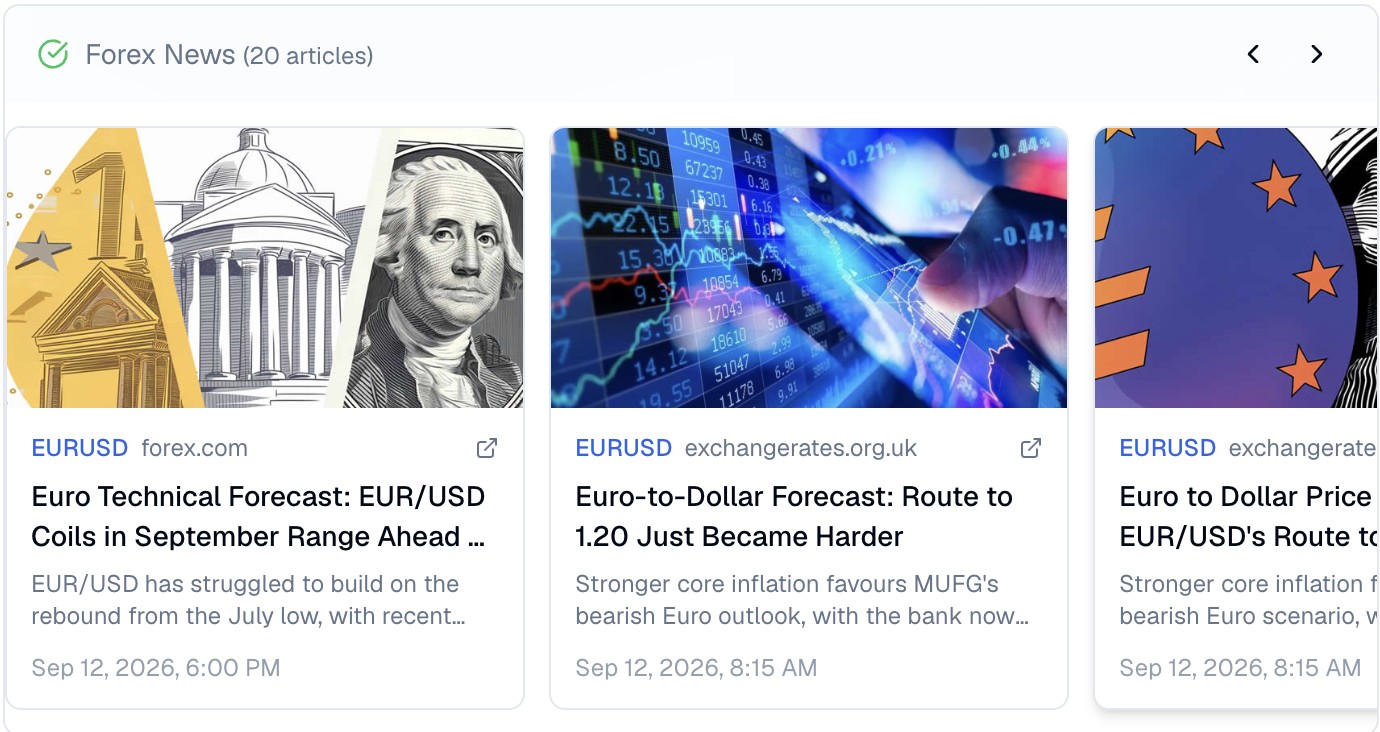
Follow news about currency pairs, organize the macro themes behind the coverage, and inspect the original publisher sources.
Example: “Find the latest forex news for EURUSD and GBPUSD. Organize the most important macro themes, explain which currency pair each story relates to, and include the original source links.”
Explore this capability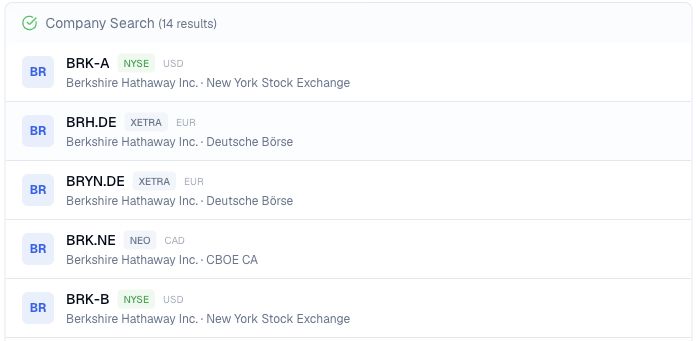
Find candidate ticker symbols from a company or asset name, distinguish listings by exchange and currency, and continue research with the right identifier.
Example: “I know the company name but not its ticker. Search for Berkshire Hathaway and show the matching ticker symbols, exchanges, and trading currencies.”
Explore this capability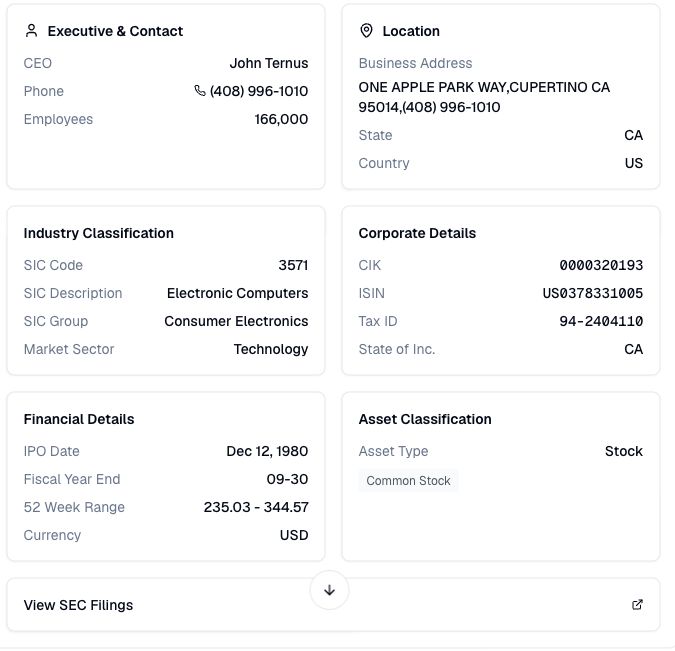
Review a company’s regulatory identity, business description, industry classification, corporate details, and direct path to its SEC filings.
Example: “Build a due diligence profile for AAPL using SEC company data. Include the registrant identity, business description, CIK, SIC classification, incorporation state, fiscal year end, employee count, and a link to its SEC filings.”
Explore this capability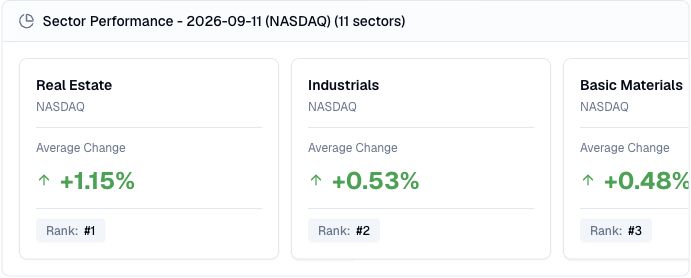
Compare stock market sectors for a chosen date, see which groups led or lagged, and use the ranking to guide deeper industry or company research.
Example: “Show NASDAQ sector performance for September 11, 2026. Rank the returned sectors by average change, identify missing values, and explain which groups led or lagged within that result.”
Explore this capability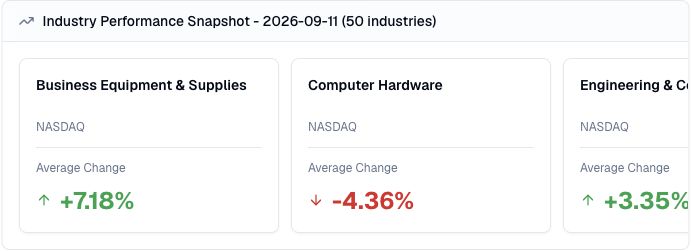
Compare stock market industries for a chosen date, find the largest positive and negative average moves, and choose where to investigate next.
Example: “Show the NASDAQ industry performance snapshot for September 11, 2026. Rank the available industries by the magnitude of their average price change, and identify the biggest positive and negative movers.”
Explore this capability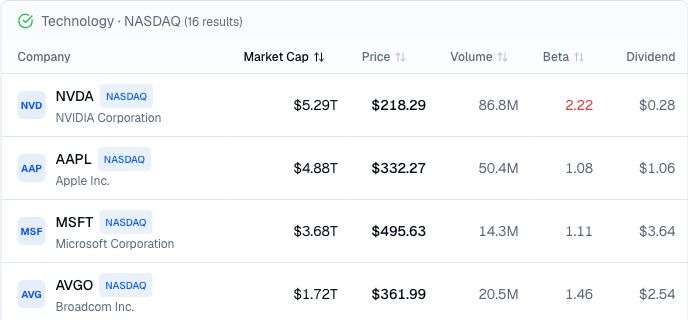
Describe the stocks, ETFs, or funds you want to find, narrow the market with practical criteria, and compare the matching assets before deeper research.
Example: “Screen for actively traded U.S. Technology stocks on NASDAQ with market cap above $100 billion, price below $500, and daily volume above 5 million. Show the matches and sort them by market cap.”
Explore this capability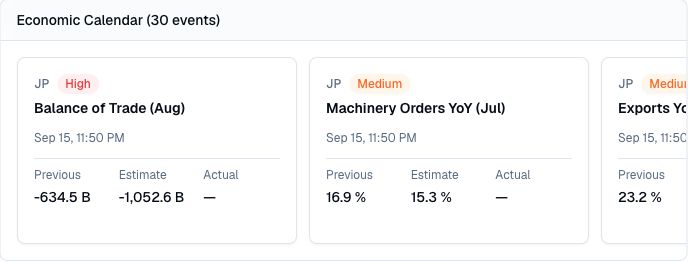
Review scheduled economic releases, see which events may deserve attention, and compare previous readings with expectations and reported results.
Example: “Show tomorrow’s economic calendar, state the date range used, and help me identify relevant releases among the returned events.”
Explore this capability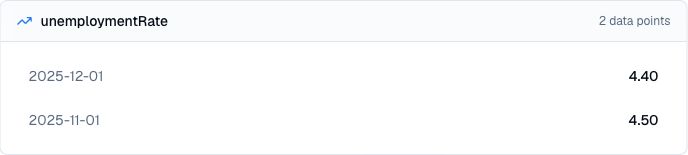
Track economic indicators through time, recognize changes in direction, and bring macroeconomic context into market and company research.
Example: “Show the U.S. unemployment rate from January 2023 through December 2025 and explain how the trend changed over that period.”
Explore this capability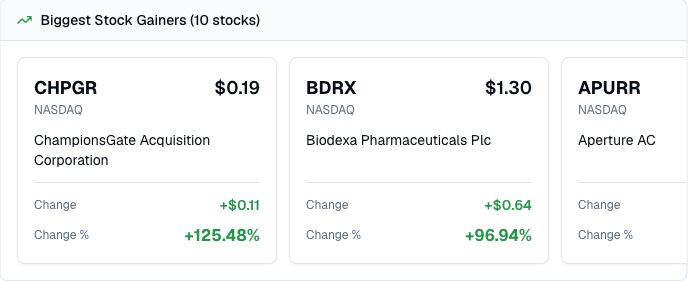
Find the stocks posting the largest price gains, compare the size of their moves, and choose which names deserve deeper research.
Example: “Show today's 10 biggest stock gainers. I want to identify which names deserve follow-up research.”
Explore this capability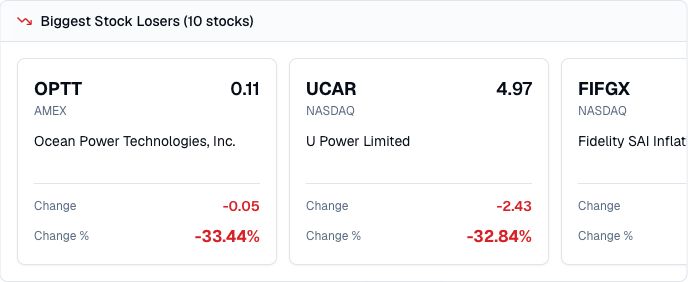
Find the securities posting the largest price declines, compare the size of their moves, and choose which names deserve deeper research.
Example: “Show today's 10 biggest stock losers. I want to identify which declines deserve follow-up research.”
Explore this capability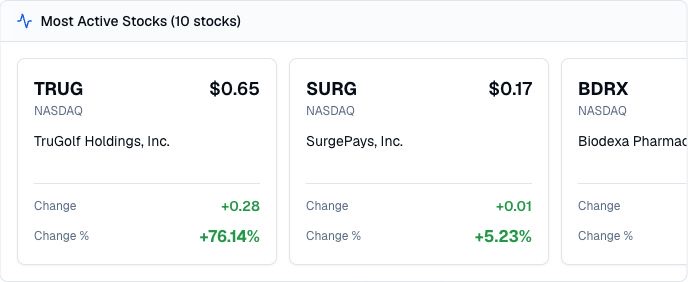
Find the most actively traded market names, see how each is moving, and decide which activity spikes deserve deeper research.
Example: “Show today's 10 most actively traded stocks. I want to see where market activity is concentrated before choosing names for follow-up research.”
Explore this capability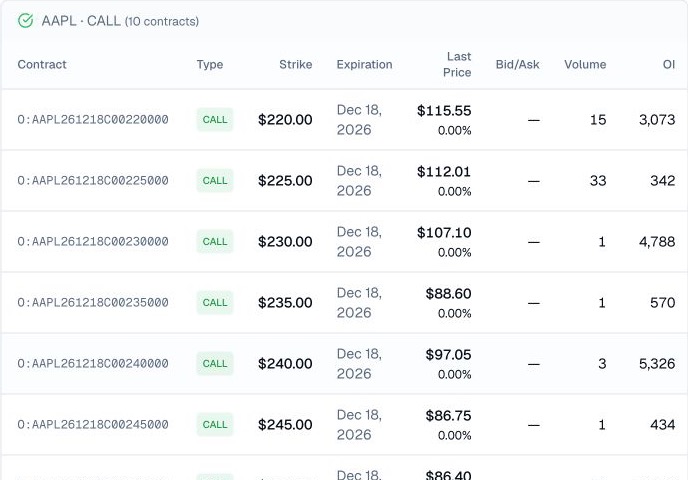
Compare options contracts across strikes and expirations, inspect pricing and activity, and narrow the chain for deeper research.
Example: “Show me a snapshot of 10 AAPL options contracts so I can compare strikes, expirations, bid/ask, volume, open interest, implied volatility, and delta before deciding what to research further.”
Explore this capability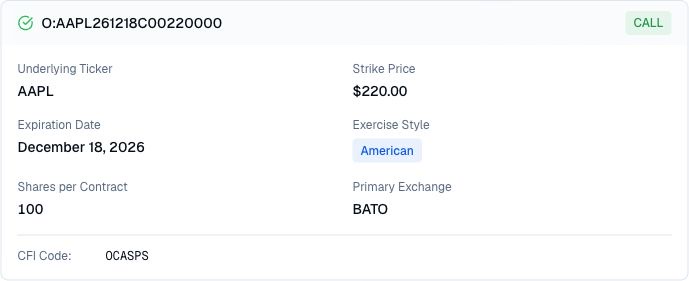
Look up a specific options contract, confirm its underlying and terms, and avoid carrying the wrong contract into deeper analysis.
Example: “Look up the contract specifications for O:AAPL261218C00220000. Show the underlying, contract type, strike, expiration, exercise style, shares per contract, and primary exchange so I can confirm I am researching the intended option.”
Explore this capability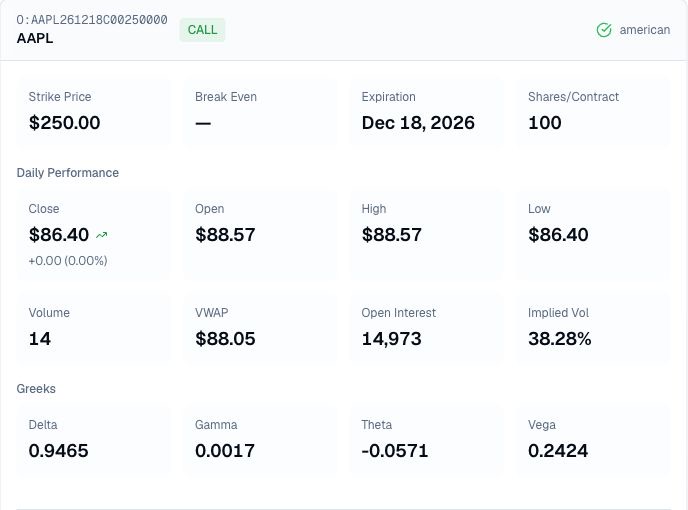
Review one options contract's price movement, market activity, implied volatility, and Greeks before deeper strategy and risk research.
Example: “Use only the options contract market snapshot for O:AAPL261218C00250000. Show the available price movement, volume, open interest, implied volatility, Greeks, and underlying or break-even context.”
Explore this capability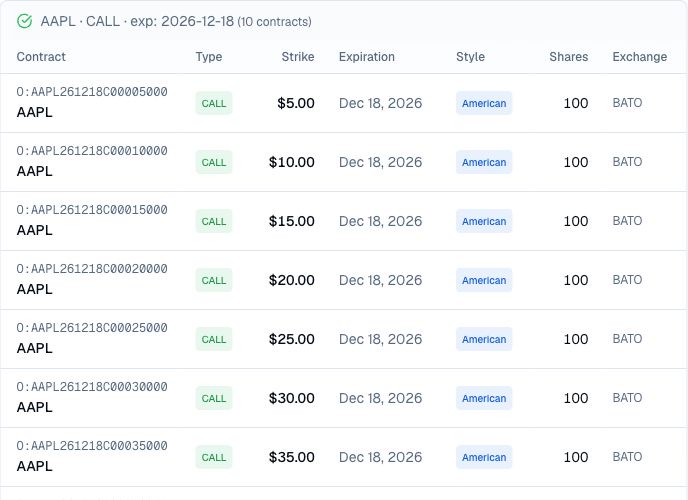
Find options contracts by underlying, direction, expiration, or strike, then carry the correct contract ticker into deeper market and risk research.
Example: “Use only the options contracts search to find 10 active AAPL call contracts expiring on December 18, 2026, ordered by strike price. Show the contract tickers and reference terms. Do not fetch an options chain snapshot, individual contract lookup, or market quote.”
Explore this capability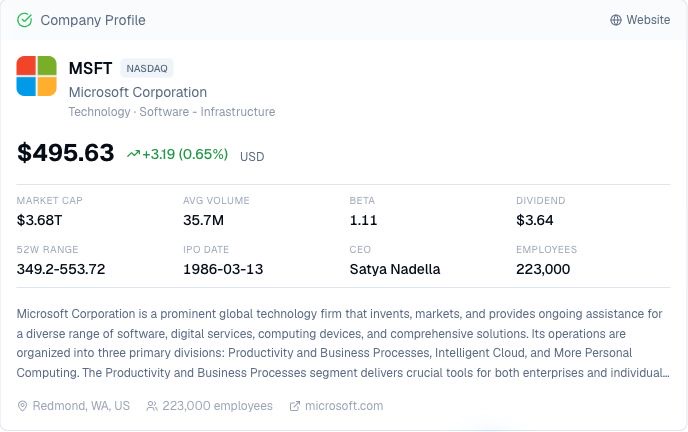
Build a structured view of a public company’s identity, business, leadership, scale, and available market profile before deeper research.
Example: “Show Microsoft’s MSFT company profile, including business, sector, CEO, headquarters, employee count, IPO date, website, and available market statistics. Separate company facts from price-sensitive values and identify fields whose observation date or methodology needs confirmation.”
Explore this capability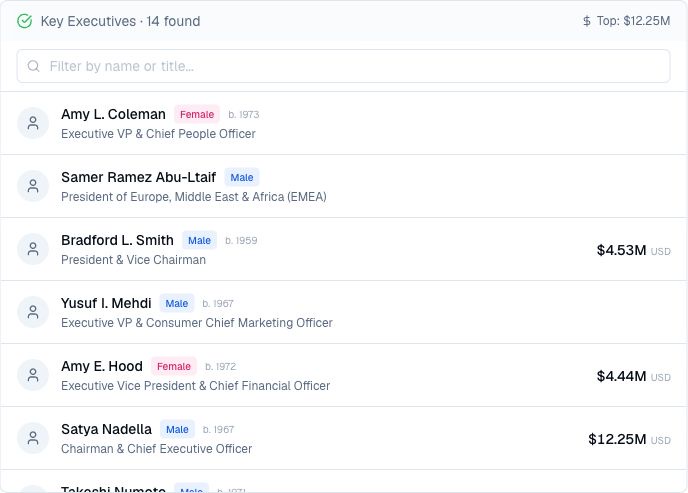
Map the people leading a public company, understand their responsibilities, and identify management questions for deeper research.
Example: “Show the available Microsoft leadership roster for MSFT with names, titles, birth years, and reported pay. Identify missing fields and any active-status information in the returned data, and list appointments or pay definitions that need confirmation.”
Explore this capability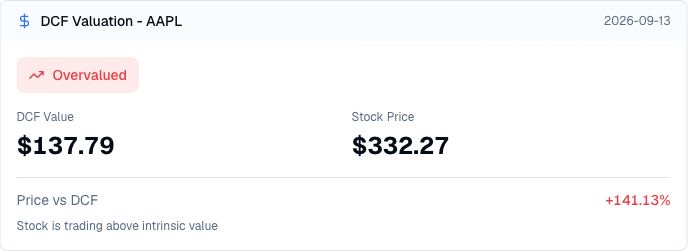
Compare a dated discounted cash flow estimate with a stock price, measure the valuation gap, and decide which assumptions need deeper investigation.
Example: “Show the available AAPL DCF estimate and its date. Explain the reference-price gap and which model assumptions I would need to verify.”
Explore this capabilityCompare a dated debt-aware cash flow estimate with a stock price, measure the valuation gap, and focus follow-up research on leverage and model assumptions.
Example: “Fetch AAPL’s levered DCF snapshot. Show the provider date, estimate, reference price and gap formula. Separate the returned facts from assumptions missing from the result; do not present the price gap as expected investment return.”
Explore this capability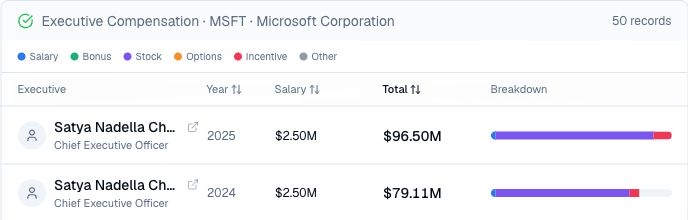
Break down disclosed executive pay, compare compensation structures across leaders and years, and frame sharper governance and incentive questions.
Example: “Show MSFT executive compensation by leader and reporting year. Explain the available pay components, identify missing fields, and retain the filing links for verification.”
Explore this capability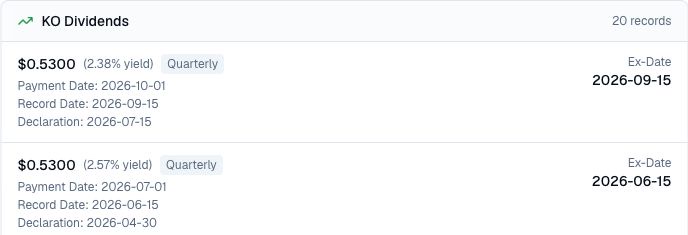
Review a stock’s dividend history and payment schedule, compare cash distributions over time, and identify income questions for deeper research.
Example: “Show Coca-Cola’s recent dividend records for KO, keeping each amount, yield, frequency, and declaration, ex-dividend, record, and payment date together. Separate historical from scheduled records and flag missing fields.”
Explore this capability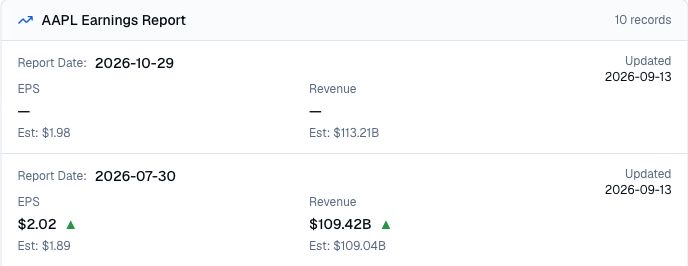
Compare reported EPS and revenue with market estimates across earnings dates, distinguish scheduled reports from completed quarters, and identify follow-up research questions.
Example: “Show Apple’s recent AAPL earnings records with report dates, actual and estimated EPS, actual and estimated revenue, and record update dates. Separate scheduled records from reported results and flag comparisons that need an accounting-basis check.”
Explore this capability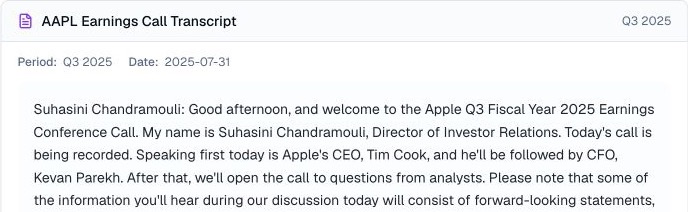
Read a company’s quarterly earnings-call transcript, inspect management commentary and analyst questions, and investigate changes in guidance, priorities, and risk.
Example: “Show Apple’s Q3 2025 earnings call transcript. Help me identify management’s comments on AI investment, tariffs, Services growth, and September-quarter guidance, preserving the speaker and date for each passage.”
Explore this capability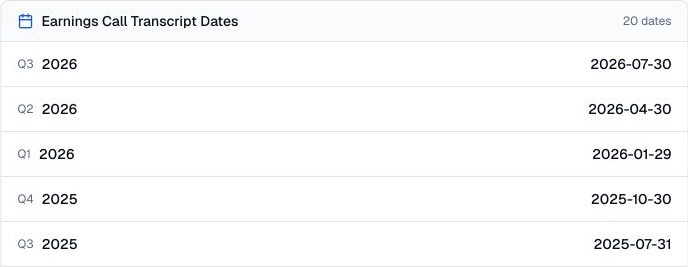
Find available earnings-call transcript dates by fiscal quarter and year, choose the right call, and plan a reliable cross-quarter research sequence.
Example: “Show Apple’s available earnings call transcript dates. Organize them by fiscal year and quarter so I can choose which calls to compare.”
Explore this capability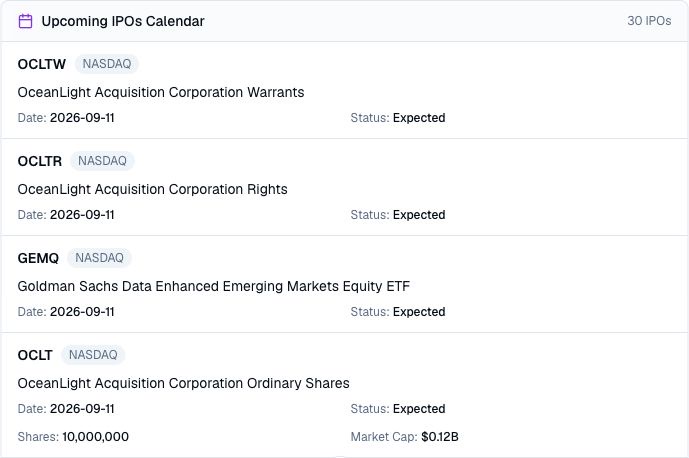
Review available IPO calendar entries, compare scheduled listing details, and identify new issues that deserve deeper company and offering research.
Example: “Query the IPO calendar for the next seven days using explicit from/to dates. Group returned rows by date and exchange, report the 30-row limit, and flag provider statuses that need confirmation.”
Explore this capability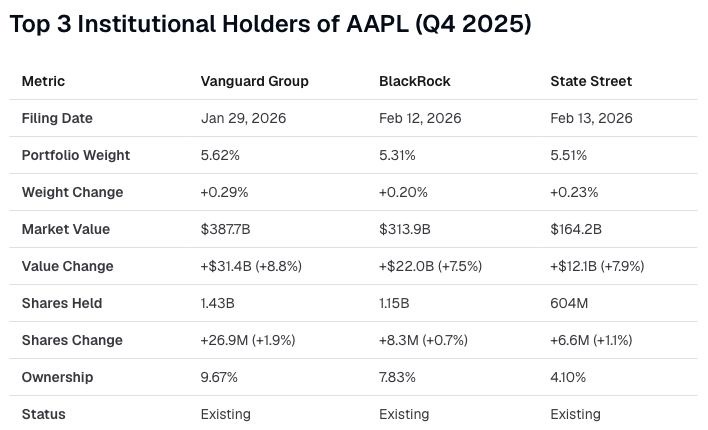
Compare reported institutional positions for a stock, see which holders added or reduced shares, and prepare questions for deeper filing research.
Example: “Fetch AAPL holder analytics for year 2025, quarter 4, page 0 and limit 10. Compare reported shares, market value, weight and filing date; state page coverage and identify the next page needed before a complete ranking.”
Explore this capability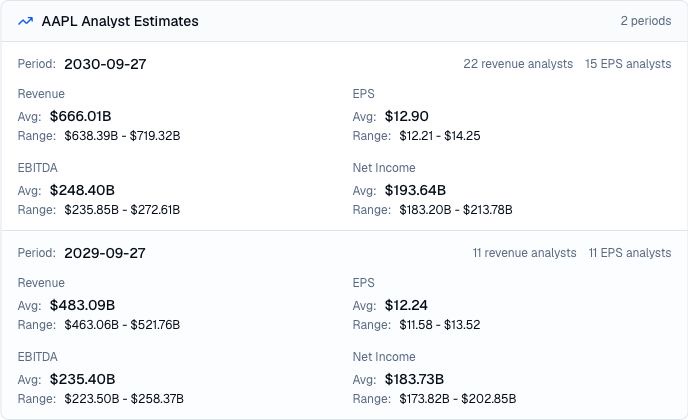
Compare analyst consensus estimates across future periods, review forecast ranges and contributor counts, and identify the expectations that deserve deeper research.
Example: “Show Apple’s available annual analyst estimates and state each reporting-period date. Compare revenue, EPS, EBITDA, and net income ranges, and identify which dates are nearest to today.”
Explore this capability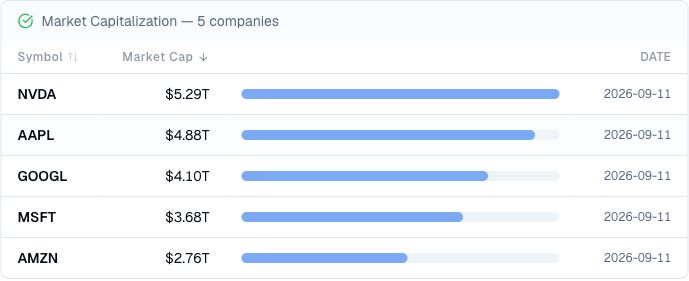
Compare the market capitalizations of several public companies, rank their equity size, and see the scale difference between stocks in one view.
Example: “Compare the latest available market capitalizations for Apple, Microsoft, NVIDIA, Amazon, and Alphabet. Rank them from largest to smallest and keep the date beside each figure.”
Explore this capability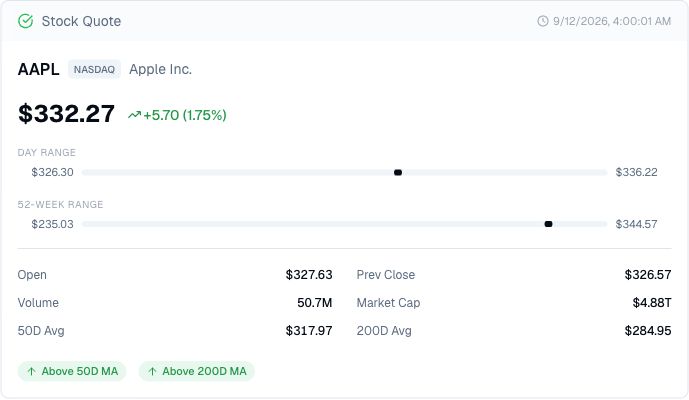
Check the latest available quote for a public stock, including its price move, trading ranges, volume, market capitalization, and moving-average context.
Example: “Show me the latest available stock quote for AAPL. Include the timestamp, exchange, price and session change, open, previous close, volume, day range, 52-week range, market cap, and 50-day and 200-day averages.”
Explore this capability
Review a stock’s latest available after-hours trades with the displayed time, price, and trade size, then decide what deserves follow-up research.
Example: “Show me the latest available after-hours trades for AAPL. Keep the displayed time, price, and trade size visible, and make clear when size is unavailable.”
Explore this capability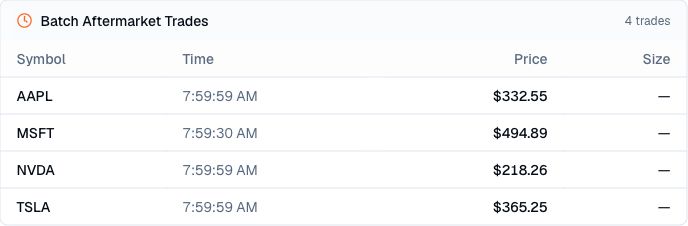
Compare the latest available after-hours trades across several stocks, see when and where each one traded, and decide which names deserve follow-up research.
Example: “Compare the latest available after-hours trades for Apple, Microsoft, NVIDIA, and Tesla. Keep each stock’s displayed time, price, and trade size together, and mark unavailable sizes clearly.”
Explore this capability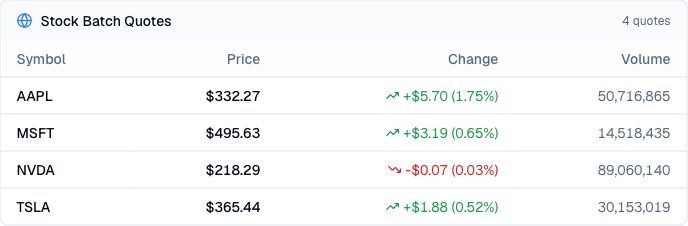
Compare the latest available quotes for several stocks, scan their price moves and trading volume, and decide which names deserve closer research.
Example: “Compare the latest available stock quotes for Apple, Microsoft, NVIDIA, and Tesla. Keep each price, absolute and percentage move, and trading volume together in one view.”
Explore this capability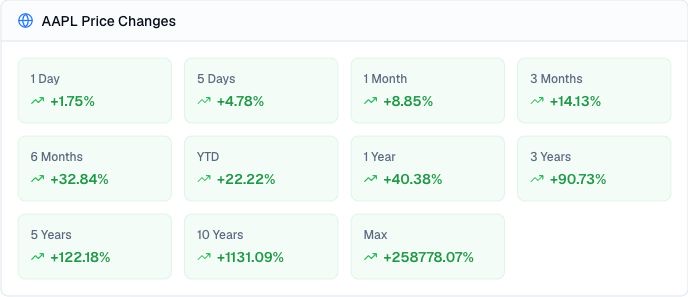
Review a stock’s percentage price changes from one day through its longest available history and see how short- and long-term performance differ.
Example: “Show Apple’s available percentage price changes across 1 day, 5 days, 1 month, 3 months, 6 months, year to date, 1 year, 3 years, 5 years, 10 years, and the longest available history. Keep every timeframe in one view.”
Explore this capability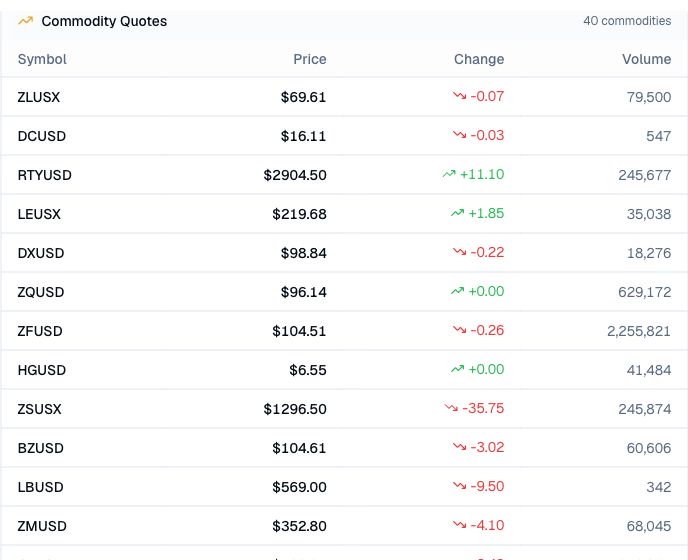
Scan the latest available prices, moves, and trading volume across tracked commodity and futures markets, then choose which contracts deserve closer research.
Example: “Show the latest available commodity and futures quote snapshot in one view. Help me identify which energy, metals, agricultural, and related markets deserve follow-up research, but do not treat absolute price changes as directly comparable across contracts.”
Explore this capability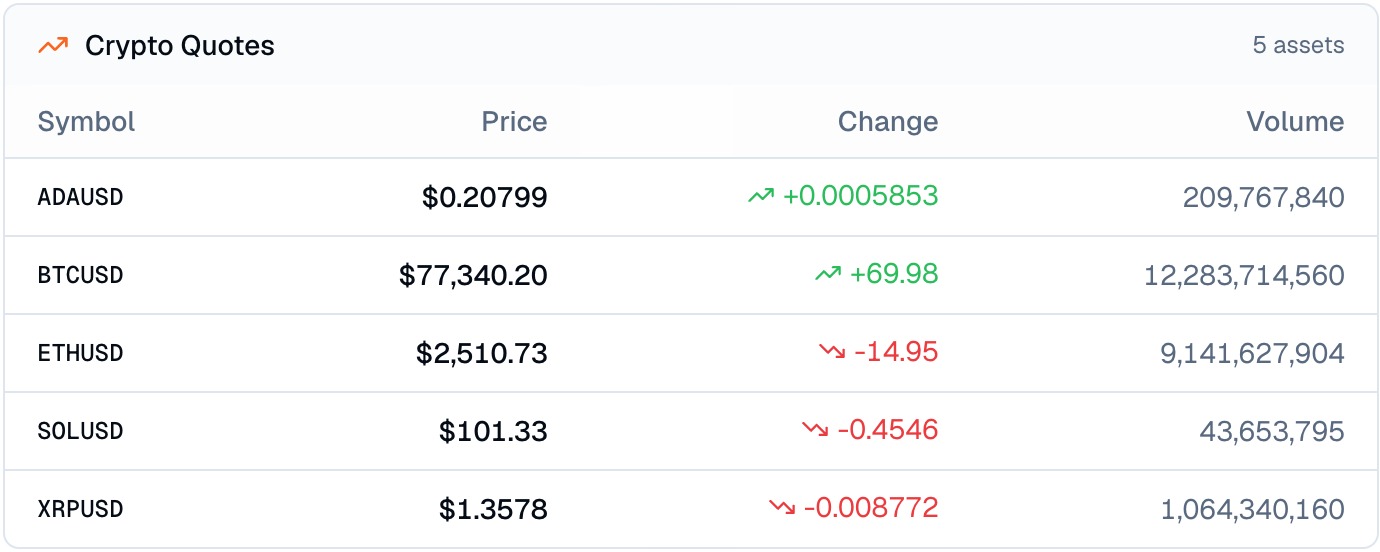
Compare the latest available prices, moves, and displayed volume across selected crypto assets, then choose which markets deserve deeper research.
Example: “Compare the latest available quotes for Bitcoin, Ethereum, Solana, XRP, and Cardano. Help me identify which assets deserve follow-up research, but verify a common change interval and reference price before calculating percentage moves or ranking them.”
Explore this capability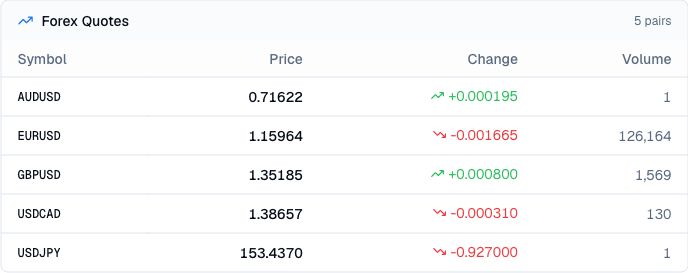
Compare the latest available rates, moves, and displayed volume across selected currency pairs, then choose which markets deserve deeper macro research.
Example: “Compare the latest available quotes for EURUSD, GBPUSD, USDJPY, AUDUSD, and USDCAD. Help me identify which pairs deserve follow-up research, but verify a common change interval and reference price before calculating percentage moves or ranking them.”
Explore this capability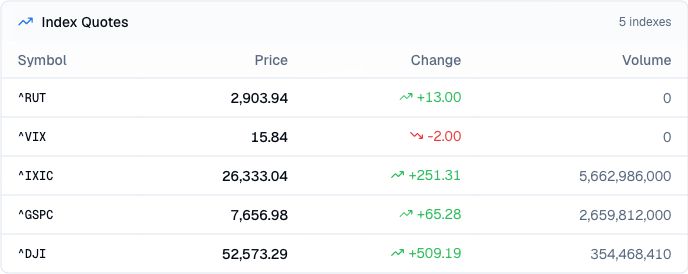
Compare the latest available levels, moves, and displayed volume across major market indexes, then investigate market breadth, risk appetite, and divergence.
Example: “Compare the latest available levels for the S&P 500, Nasdaq Composite, Dow Jones, Russell 2000, and VIX. Calculate percentage moves over the same interval before comparing the equity indexes, and interpret VIX separately.”
Explore this capability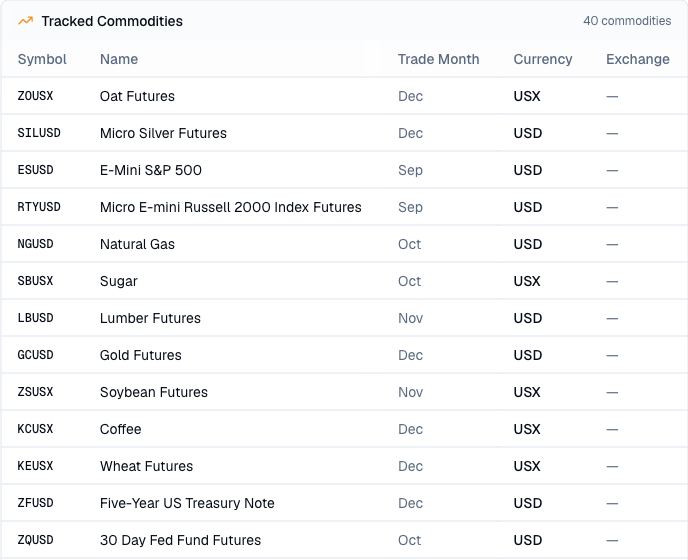
Discover tracked commodity and futures markets, match instrument names to symbols, and check the available contract context before researching prices or market drivers.
Example: “Show the available commodity and futures markets. Group them into energy, metals, agriculture, livestock, rates, currencies, and equity-index futures, while preserving each symbol, trade month, currency label, and exchange when available.”
Explore this capability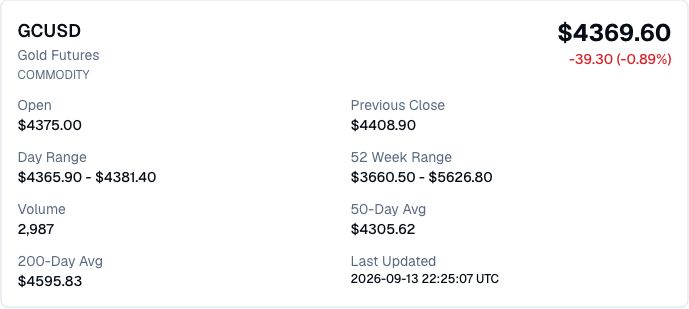
Inspect one commodity or futures quote with its price move, trading ranges, volume, moving averages, and timestamp before researching the market in depth.
Example: “Show the latest available quote for GCUSD Gold Futures. Keep the price, absolute and percentage move, open, previous close, day range, 52-week range, volume, 50-day average, 200-day average, exchange label, and timestamp together.”
Explore this capability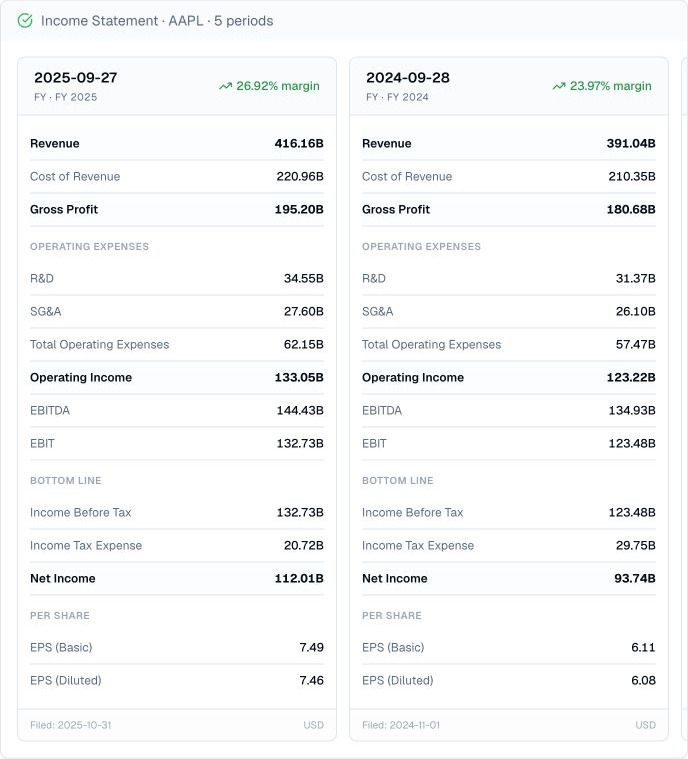
Review how a public company moves from revenue to gross profit, operating income, net income, and earnings per share across reported periods.
Example: “Show Apple’s latest available annual income statements. Keep revenue, cost of revenue, gross profit, R&D, SG&A, operating income, EBITDA, EBIT, taxes, net income, basic and diluted EPS, filing date, and reported currency together for each period.”
Explore this capabilityReview selected income metrics from provider-supplied filing tags, inspect returned fields, and compare them with the original disclosure.
Example: “Show Apple’s two latest available annual income statements as reported. Keep the fiscal period, statement date, reported currency, revenue, gross profit, operating income, net income, diluted EPS, and reported line-item count together for each statement.”
Explore this capability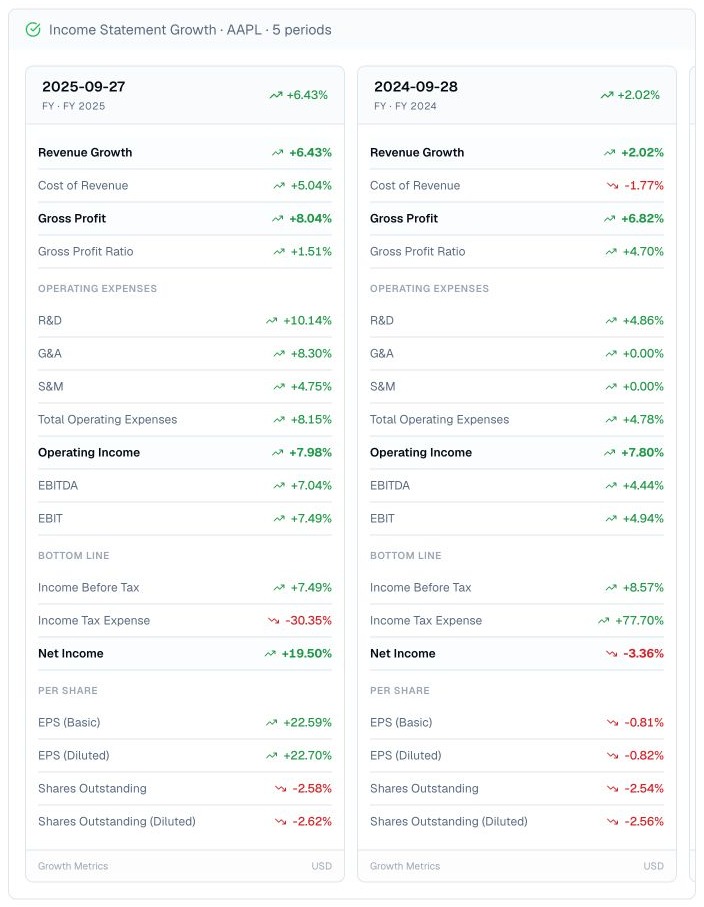
Compare how revenue, costs, operating profit, net income, earnings per share, and share counts changed across reported annual or quarterly periods.
Example: “Show Apple’s latest available annual income-statement growth. Keep revenue, cost of revenue, gross profit, operating expenses, operating income, net income, basic and diluted EPS, and share-count growth together for each period.”
Explore this capability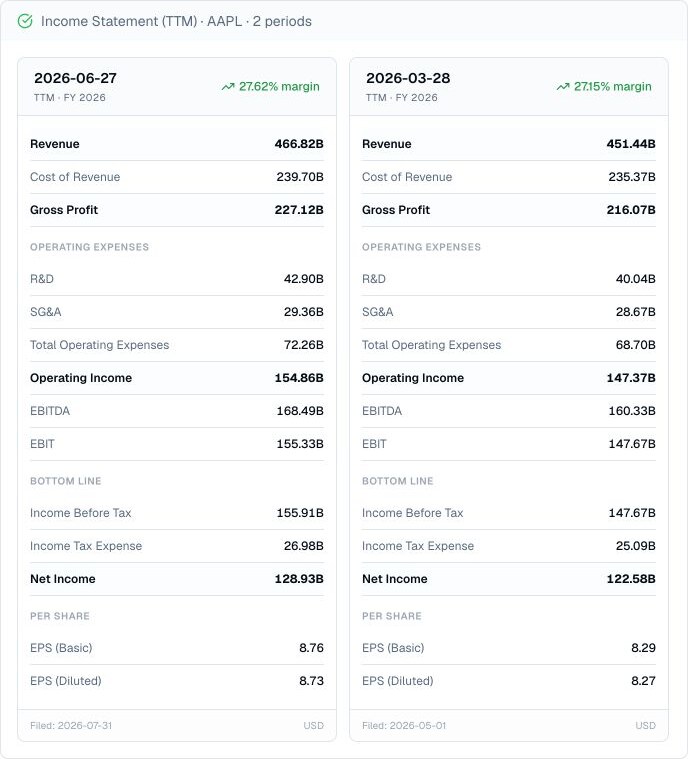
Review a company’s latest trailing-twelve-month revenue, costs, operating profit, net income, margins, and earnings per share without waiting for fiscal year-end.
Example: “Show Apple’s latest two available trailing-twelve-month income statements. Keep the period end date, fiscal year label, revenue, cost of revenue, gross profit, R&D, SG&A, operating expenses, operating income, EBITDA, EBIT, taxes, net income, basic and diluted EPS, net margin, filing date, and currency together for each TTM snapshot.”
Explore this capability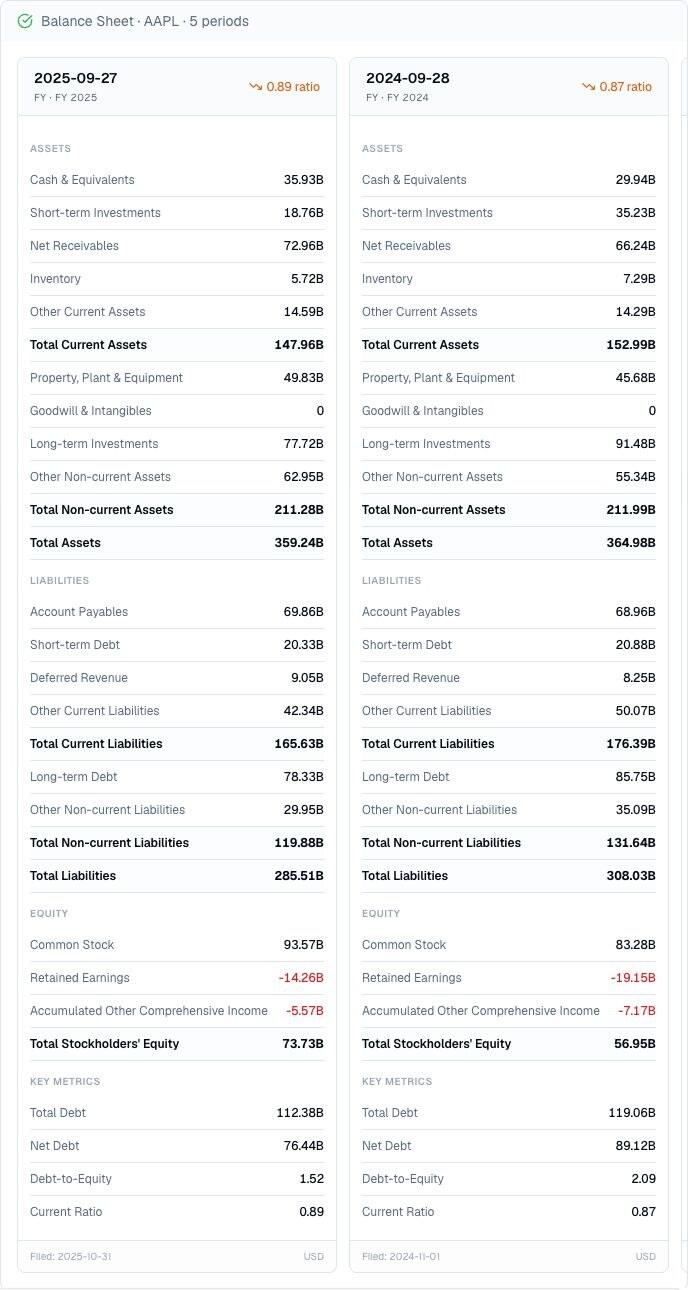
Review what a public company owns, owes, and finances, then compare liquidity, debt, and shareholder equity across reported balance-sheet dates.
Example: “Show Apple’s latest available annual balance sheets. Keep cash, short-term investments, receivables, inventory, current assets, total assets, current liabilities, short- and long-term debt, total liabilities, shareholder equity, net debt, current ratio, filing date, and reported currency together for each date.”
Explore this capabilityInspect a company’s balance sheet closer to its reported filing structure, retain issuer-specific line items, and trace assets, liabilities, and equity back to the disclosure.
Example: “Show Apple’s two latest available annual balance sheets as reported. Keep the fiscal period, statement date, reported currency, total assets, current assets, cash, total liabilities, current liabilities, shareholder equity, and reported line-item count together for each statement.”
Explore this capability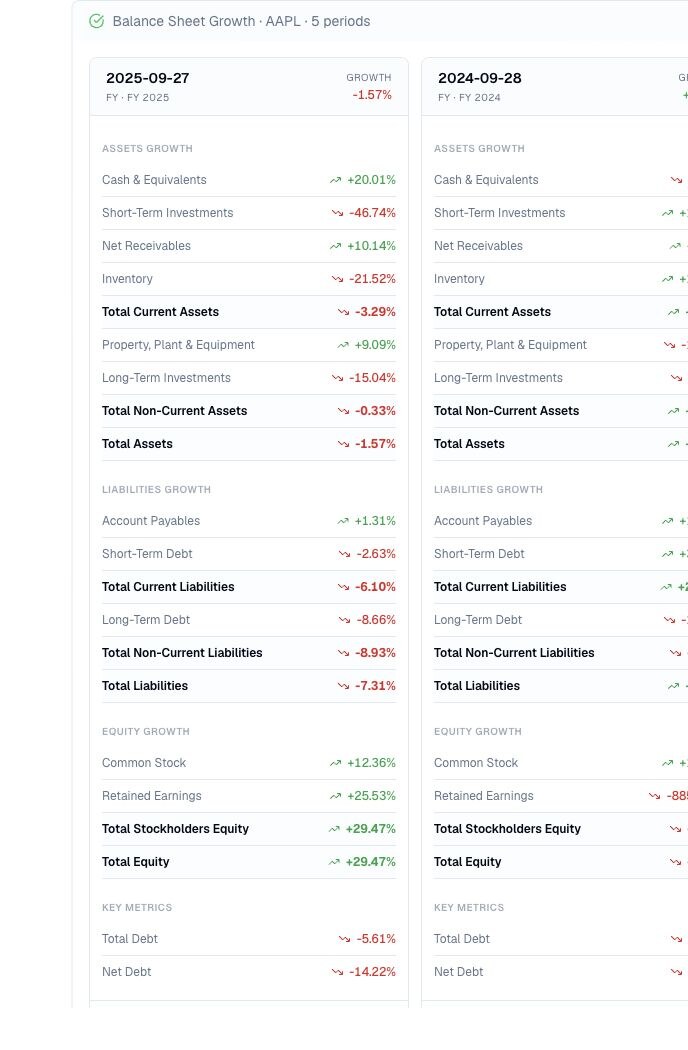
Compare how cash, assets, liabilities, debt, retained earnings, and shareholder equity changed across reported annual or quarterly balance sheets.
Example: “Show Apple’s latest available annual balance-sheet growth. Keep cash, short-term investments, receivables, inventory, current assets, total assets, current and total liabilities, shareholder equity, total debt, and net debt together for each period.”
Explore this capability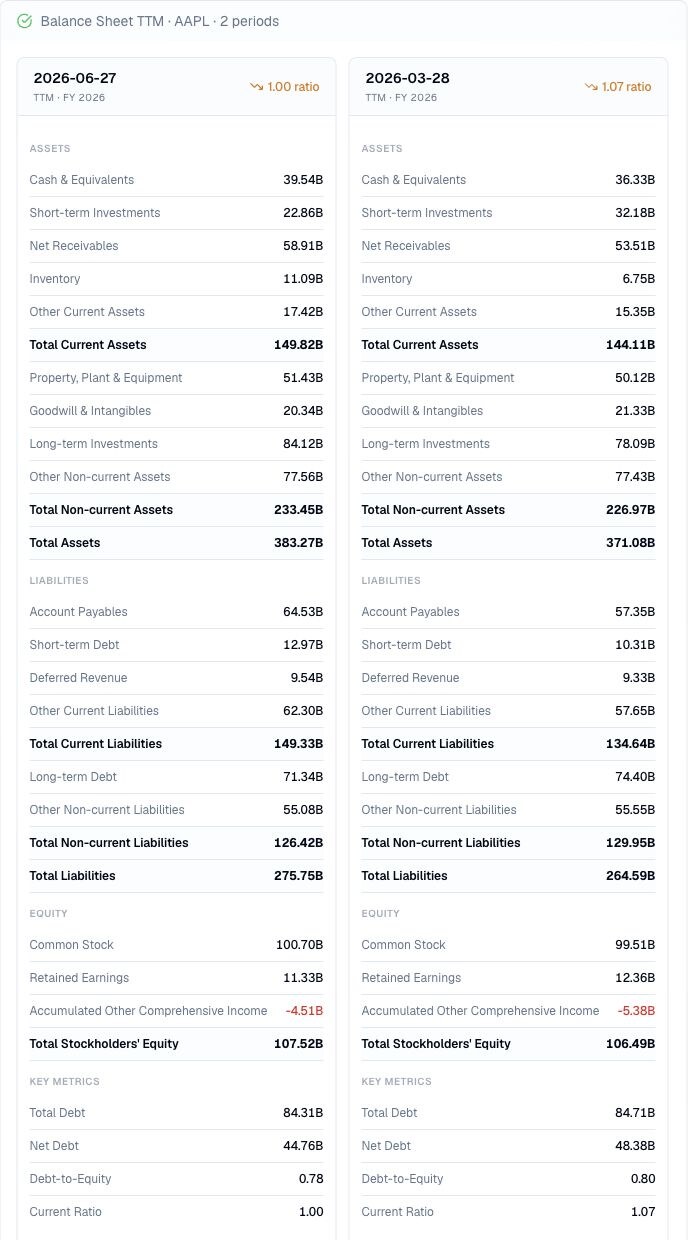
Review a company’s latest TTM-labeled balance-sheet snapshots and compare liquidity, assets, obligations, debt, and shareholder equity between reporting dates.
Example: “Show Apple’s latest two available TTM balance-sheet snapshots. Keep the reporting date, fiscal-year label, cash, short-term investments, receivables, inventory, current assets, total assets, current and total liabilities, shareholder equity, total debt, net debt, current ratio, debt-to-equity, filing date, and currency together for each snapshot.”
Explore this capability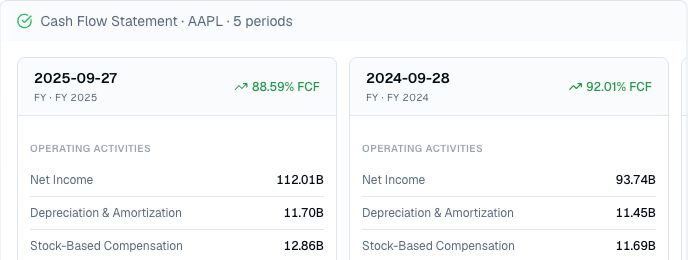
Trace how a public company generates cash from operations, invests it, funds the business, and changes its cash balance across reported periods.
Example: “Show Apple’s latest available annual cash flow statements. Compare operating, investing, and financing cash flows, working-capital changes, capital expenditure, free cash flow, and ending cash across the reported periods.”
Explore this capabilityRetrieve filing-tagged cash flow data and compare selected operating, investing, and financing totals by reported period.
Example: “Show Apple’s two latest available annual cash flow statements as reported. Keep the fiscal period, statement date, reported currency, net income, operating cash flow, investing cash flow, financing cash flow, free cash flow, and reported line-item context together for each statement.”
Explore this capability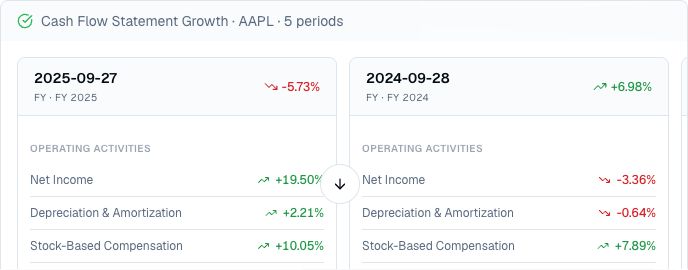
Compare how operating, investing, and financing cash flows, free cash flow, capital spending, and cash balances changed across reported periods.
Example: “Show Apple’s latest available annual cash-flow growth. Compare operating, investing, and financing cash-flow growth with net income, capital expenditure, free cash flow, and the change in cash, and call out the periods that deserve a closer look.”
Explore this capability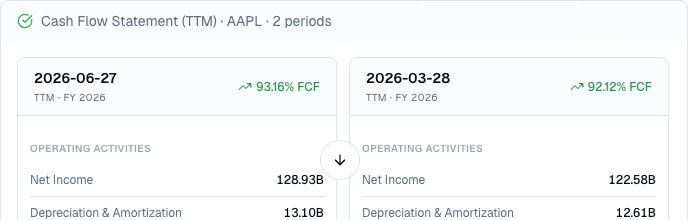
Review a company’s latest trailing-twelve-month operating, investing, and financing cash flows, free cash flow, capital spending, and cash balances across rolling periods.
Example: “Show Apple’s latest two available trailing-twelve-month cash-flow periods. Keep the period end, filing date, net income, operating, investing, and financing cash flow, capital expenditure, free cash flow, and cash at end together so I can compare the recent cash picture.”
Explore this capabilityReview selected income-statement, balance-sheet, and cash-flow figures from as-reported data, then inspect the original filing tags and context.
Example: “Show Apple’s two latest available annual financial statements as reported. Keep the reported period, statement date, currency, revenue, gross profit, operating income, net income, diluted EPS, total assets, total liabilities, shareholder equity, operating cash flow, investing cash flow, financing cash flow, and reported line-item context together for each year.”
Explore this capability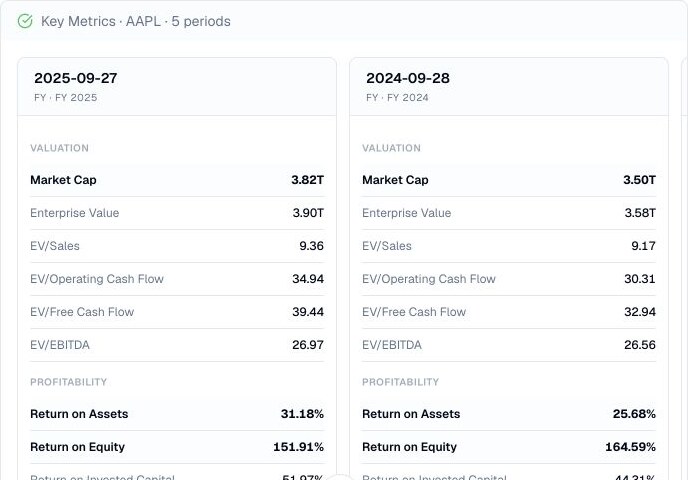
Review a company’s valuation, profitability, efficiency, capital, and financial-quality indicators together across reported periods.
Example: “Fetch AAPL key metrics with period annual. Report the actual returned count, dates and currency, then compare ROA, ROE, liquidity and cash-flow yield. Flag missing values and separate changes in percentage points from relative percentage changes.”
Explore this capability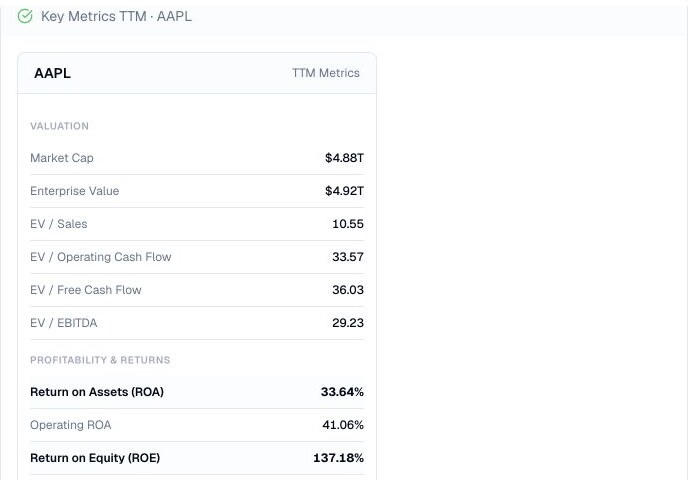
Review a company’s latest rolling twelve-month valuation, returns, liquidity, efficiency, leverage, and capital indicators in one view.
Example: “Fetch AAPL TTM key metrics. Group the returned valuation, returns, liquidity, cash-cycle and leverage fields; preserve missing values and explicitly say that this result does not supply its measurement date or currency.”
Explore this capability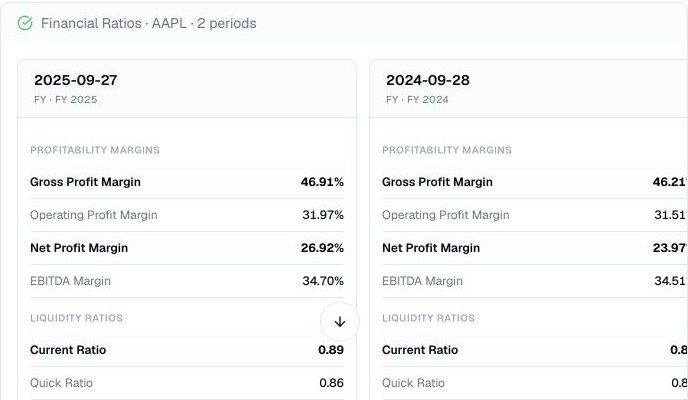
Review profitability, liquidity, efficiency, valuation, leverage, per-share, and dividend ratios together across reported periods.
Example: “Show Apple’s latest available annual financial ratios across the reported periods. Keep profitability margins, current and quick ratios, turnover, P/E, P/B, P/S, EV multiple, debt to equity, per-share measures, dividend yield, payout, dates, and currency together so I can compare the pattern.”
Explore this capability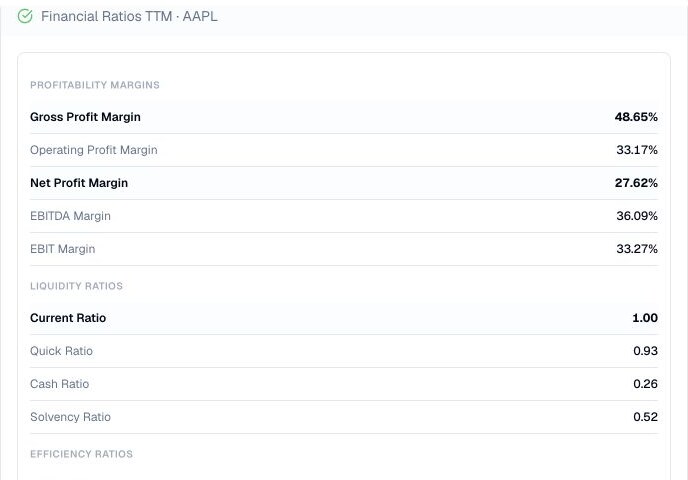
Review a company’s latest trailing-twelve-month margins, liquidity, efficiency, valuation, leverage, coverage, and per-share ratios.
Example: “Show Apple’s latest trailing-twelve-month financial ratios. Keep profitability margins, liquidity, turnover, P/E, P/B, P/S, price to free cash flow, EV multiple, debt ratios, cash-flow coverage, per-share measures, dividend yield, and the current measurement context together.”
Explore this capability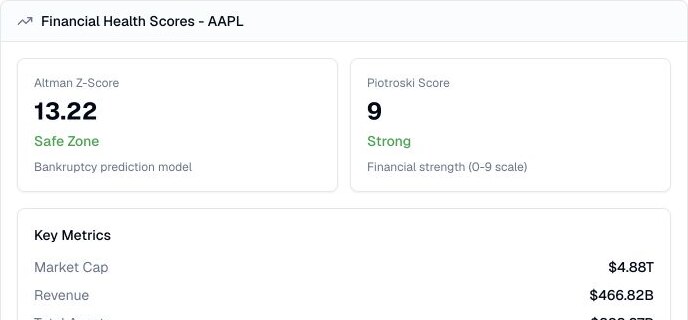
Use established financial-strength signals with the company figures that help put profitability, liquidity, and balance-sheet capacity in context.
Example: “Review Apple’s financial health scores and show the Altman Z-Score and Piotroski Score with the supporting revenue, EBIT, assets, liabilities, working capital, retained earnings, market value, and currency. Identify missing measurement dates and the figures I should verify in filings.”
Explore this capability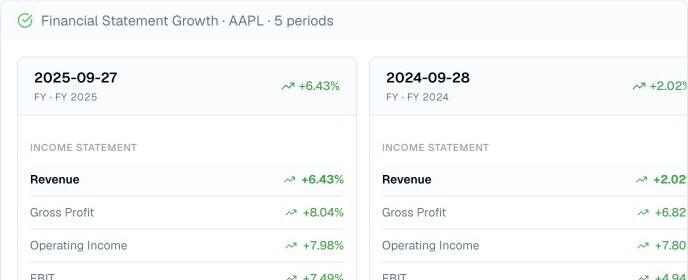
Trace how income, balance-sheet, cash-flow, and long-term per-share growth measures change across reported periods.
Example: “Show Apple’s latest financial statement growth across the available periods. Group revenue, profit, EPS, assets, debt, operating cash flow, free cash flow, capital spending, shares, dividends, and three-, five-, and ten-year per-share growth, then point out what I should verify in the filings.”
Explore this capability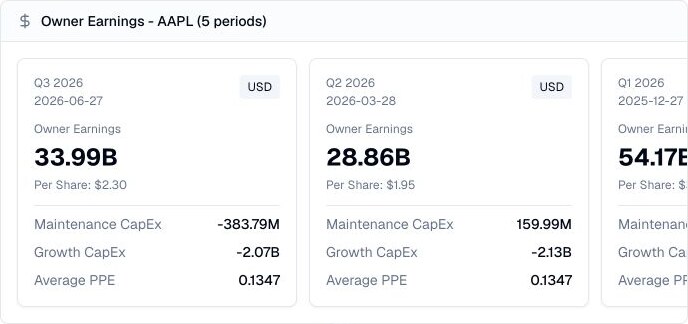
Estimate the cash a business may generate for owners after separating maintenance investment from expansion spending.
Example: “Review Apple’s owner earnings across the latest available periods. Show the owner-earnings estimate, per-share value, maintenance CapEx, growth CapEx, the PPE-to-sales input, dates, and currency, then identify the assumptions and filing notes I should verify.”
Explore this capability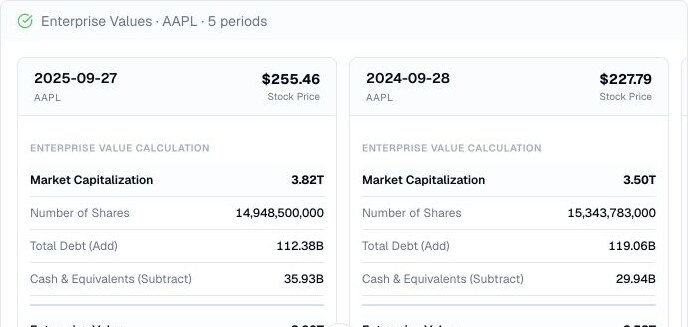
Compare market capitalization, cash, debt, shares, stock price, and enterprise value across reported dates.
Example: “Show Apple’s enterprise value across the latest available periods. Keep stock price, market capitalization, shares, cash and equivalents, total debt, enterprise value, and dates together; flag any missing currency information, then identify the capital-structure changes I should verify.”
Explore this capability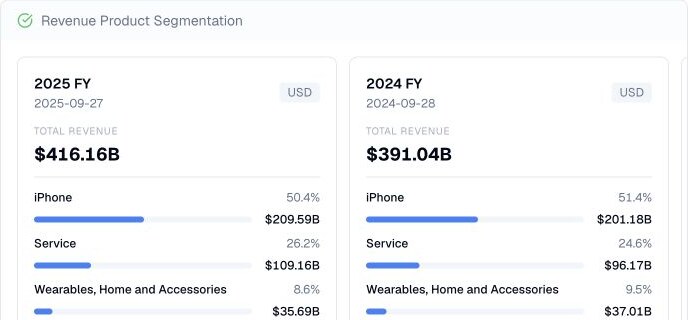
See which product lines contribute to revenue and how the mix shifts across reported periods.
Example: “Show Apple’s product revenue segmentation across the latest available annual periods. Rank iPhone, Services, Mac, iPad, and Wearables by contribution, include total revenue and dates, and point out the mix changes I should verify in the 10-K.”
Explore this capability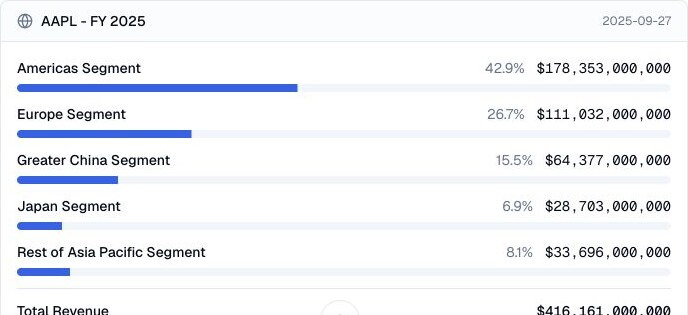
See how reported revenue is distributed across regions and how geographic exposure changes over time.
Example: “Show Apple’s geographic revenue segmentation across the latest available annual periods. Rank the Americas, Europe, Greater China, Japan, and Rest of Asia Pacific by contribution, include total revenue and dates, and point out the regional changes I should verify in the 10-K.”
Explore this capability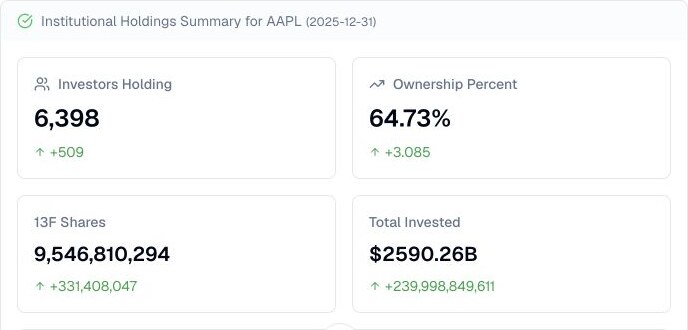
Review institutional holder counts, ownership, invested value, position changes, and options activity for a stock and reporting quarter.
Example: “Review Apple’s institutional position summary for Q4 2025. Show holder count, ownership percentage, 13F shares, reported value, position-change counts, and the reporting date. Keep unavailable fields separate from zero.”
Explore this capability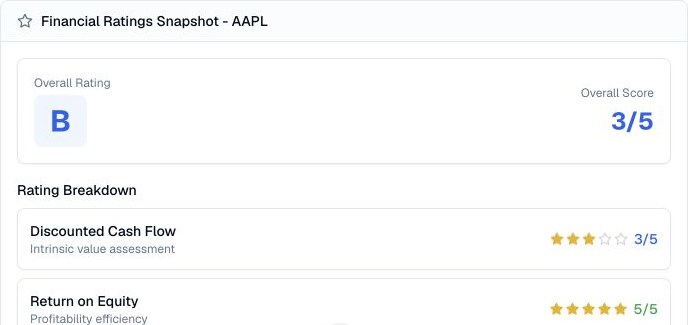
Review an overall financial grade with valuation, returns, leverage, and asset-efficiency rating signals in one snapshot.
Example: “Review Apple’s financial ratings snapshot. Show the overall grade and score with the discounted-cash-flow, ROE, ROA, debt-to-equity, P/E, and P/B ratings, then explain which inputs, dates, definitions, and peer context I should verify.”
Explore this capability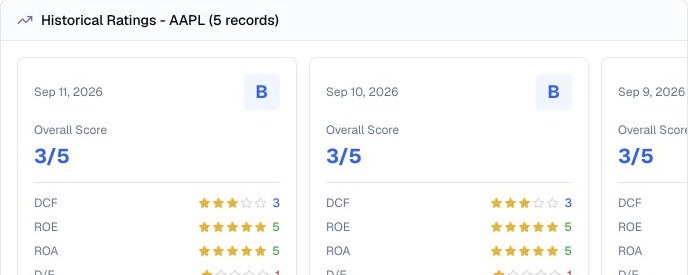
Track how a company’s overall grade and valuation, return, leverage, and asset-efficiency signals change over time.
Example: “Show Apple’s latest historical financial ratings. Keep each date, overall grade and score, DCF, ROE, ROA, debt-to-equity, P/E, and P/B ratings together, then identify the changes and methodology details I should verify.”
Explore this capability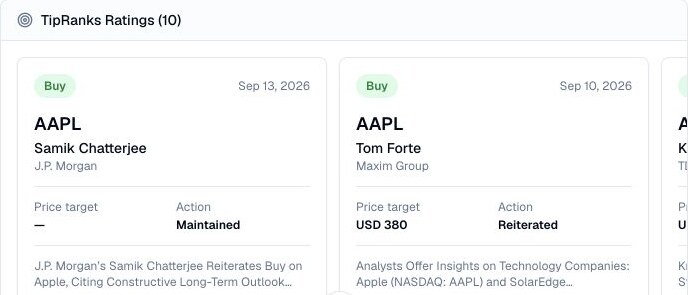
Find individual analyst recommendations, actions, price targets, and source articles for a stock in one recent view.
Example: “Show me the latest individual analyst ratings for Apple. Group the recent Buy, Hold, and Sell calls by date, analyst, firm, action, price target, and source link.”
Explore this capabilitySee a stock’s analyst recommendations, price targets, and track-record context as of a chosen research date.
Example: “Show Apple’s point-in-time analyst ratings as of the latest available date. Keep each recommendation, analyst, firm, action, price target, success rate, return context, and source link together.”
Explore this capability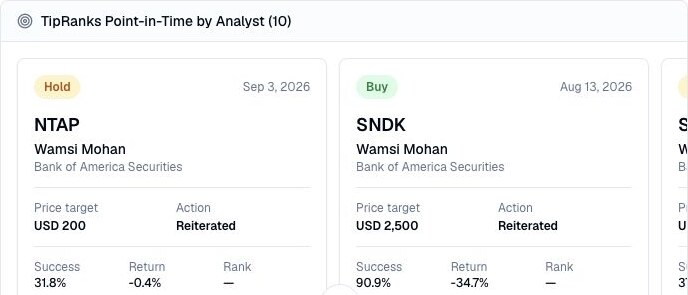
See an analyst’s latest views across covered stocks, with recommendation changes, targets, track-record context, and source coverage.
Example: “Show Wamsi Mohan’s latest available analyst coverage across stocks. Group each record by ticker, recommendation, date, firm, action, price target, success rate, return context, and source link.”
Explore this capability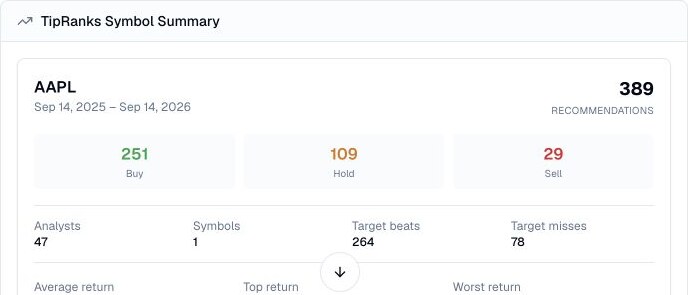
Summarize a stock’s analyst recommendations, action mix, target outcomes, and closing-price gaps to targets over a defined window.
Example: “Summarize the latest available analyst ratings for Apple over the default trailing-twelve-month window. Show the Buy, Hold, and Sell mix, analyst count, actions, target beats and misses, and price-to-target gaps, then tell me what to verify.”
Explore this capability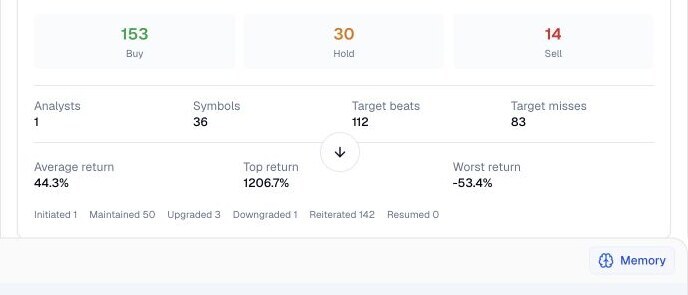
Review one analyst’s recommendation mix, coverage breadth, actions, target outcomes, and provider return fields in one view.
Example: “Using the verified TipRanks profile identifier for Wamsi Mohan, summarize the default trailing-twelve-month window. Show recommendation mix, covered-stock count, actions, and target-comparison fields; do not describe them as trading profits.”
Explore this capability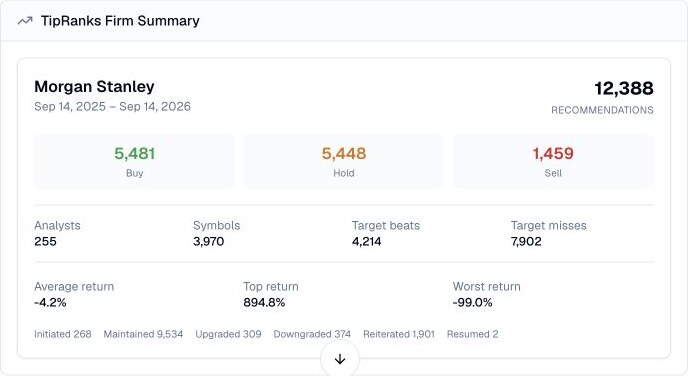
Review an investment firm’s recommendation mix, analyst coverage, rating actions, target outcomes, and provider return fields.
Example: “Summarize Morgan Stanley’s available stock recommendations for the default trailing-twelve-month window. Show the Buy, Hold, and Sell mix, analyst and stock coverage, actions, target beats and misses, return context, and what needs verification.”
Explore this capability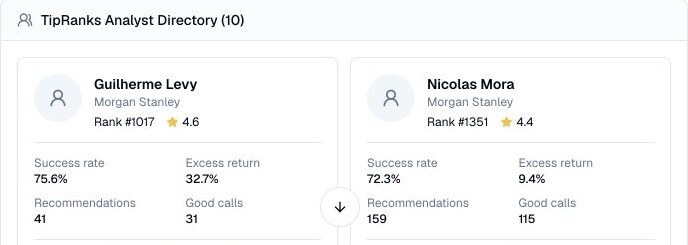
Browse analyst profiles with rank, stars, success rate, excess return, recommendation counts, and links for follow-up research.
Example: “Browse the available Morgan Stanley analyst profiles and show each person’s rank, stars, success rate, excess return, recommendation count, and good-call count. Highlight which profiles deserve a closer source review.”
Explore this capability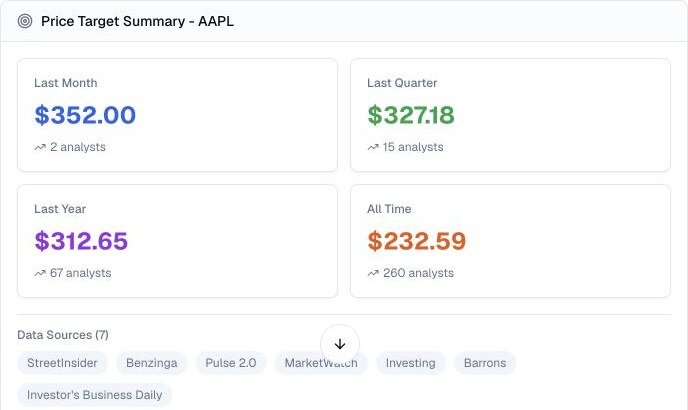
Compare a stock’s average analyst price targets across recent and longer-term windows, with estimate counts and publisher coverage.
Example: “Summarize Apple’s average analyst price targets for the last month, quarter, year, and all-time windows. Show the estimate count for each and explain what could make the averages move.”
Explore this capability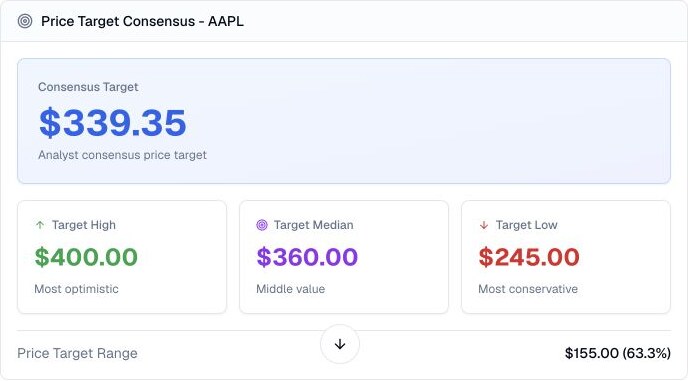
See the consensus, median, high, and low analyst price targets for a stock, plus the spread between optimistic and conservative views.
Example: “Show Apple’s analyst price-target consensus, median, high, and low. Calculate the range and explain what a wide spread could mean without turning it into a buy or sell recommendation.”
Explore this capability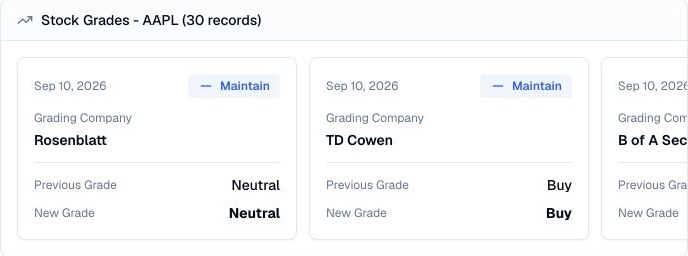
Track recent analyst and institution grade changes for a stock, including upgrades, downgrades, maintained views, and the before-and-after labels.
Example: “Show the latest stock grade changes for Apple. Group upgrades, downgrades, and maintained views by date and grading company, and include previous and new grades.”
Explore this capability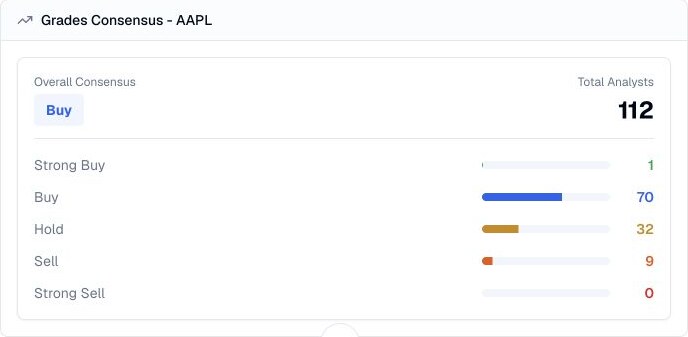
See how available analyst grades for a stock split across Strong Buy, Buy, Hold, Sell, and Strong Sell, with the overall consensus.
Example: “Show Apple’s analyst ratings consensus with Strong Buy, Buy, Hold, Sell, and Strong Sell counts. Explain what the distribution says about agreement and what I should verify next.”
Explore this capabilityReview how a stock’s analyst grade mix has changed over time, with dated Buy, Hold, Sell, and conviction counts.
Example: “Show Apple’s historical analyst-grade snapshots and explain how the Strong Buy, Buy, Hold, Sell, and Strong Sell mix changed across the returned dates. Flag what I should verify next.”
Explore this capability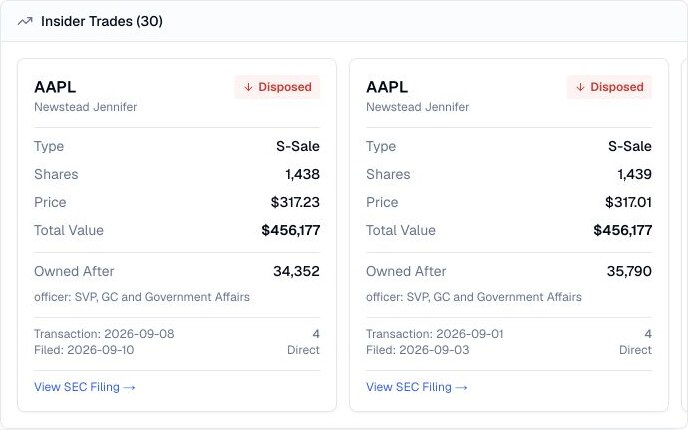
Find recent insider purchases, sales, awards, and ownership changes for a public company, with the person, role, size, price, and filing trail together.
Example: “Show Apple’s recent insider trades and group them by person and role. Separate acquisitions, dispositions, awards, gifts, and tax-related transactions, then flag what I should verify in the filings.”
Explore this capability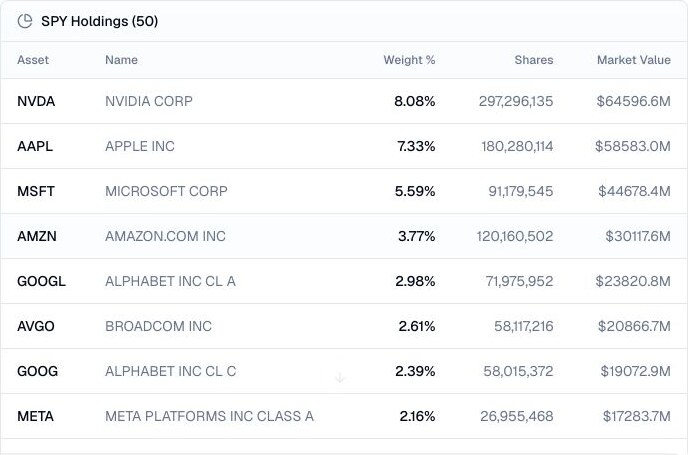
Inspect available ETF or mutual-fund positions, portfolio weights, share counts, market values, and supplied update context.
Example: “Show SPY’s largest holdings with portfolio weights, share counts, market values, and the update time. Explain how concentrated the top positions are and what to verify next.”
Explore this capability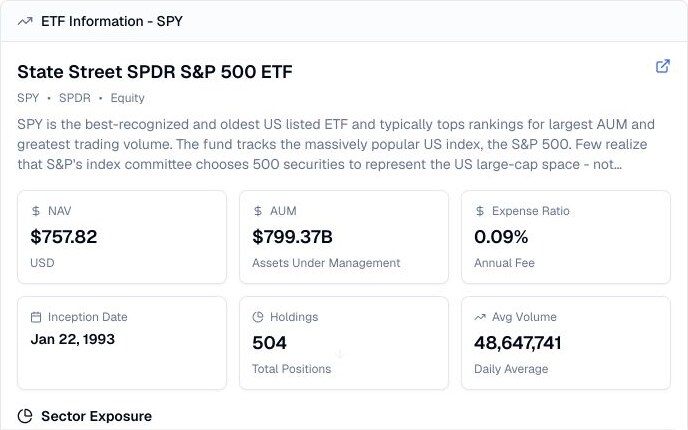
Get a plain-language overview of an ETF or mutual fund, including NAV, assets, fees, inception, holdings count, volume, and sector exposure.
Example: “Give me a concise profile of SPY with NAV, AUM, expense ratio, inception date, holdings count, average volume, and sector exposure. Explain what I should verify next.”
Explore this capability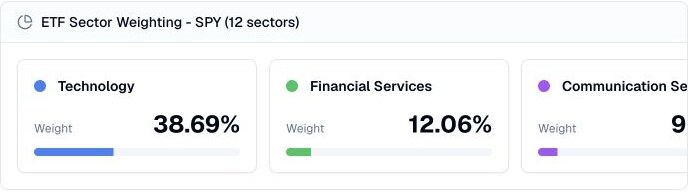
See how an ETF’s assets are distributed across technology, financials, healthcare, and other sectors, with each weight shown side by side.
Example: “Show SPY’s sector weighting from largest to smallest and explain what its reported technology exposure means for concentration. Keep the interpretation separate from investment advice.”
Explore this capabilityBrowse recent U.S. Senate financial disclosures with the official, transaction date, asset, purchase or sale, value range, and filing link.
Example: “Show the latest Senate financial disclosures and group them by senator and owner. Include asset, purchase or sale, value range, transaction date, disclosure date, and source links.”
Explore this capabilityTrack disclosed Senate purchases and sales for one stock, with the senator, owner, value range, transaction date, disclosure date, and filing link.
Example: “Show recent Senate trades for AAPL and group them by senator and owner. Include purchase or sale, value range, transaction date, disclosure date, and filing links.”
Explore this capability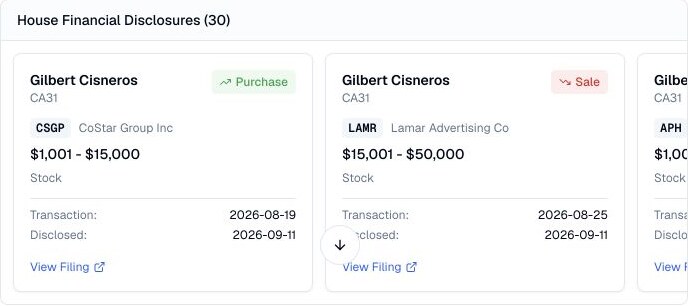
Browse recent U.S. House financial disclosures with the representative, owner, asset, purchase or sale, value range, dates, and filing source.
Example: “Show the latest House financial disclosures and group them by representative and owner. Include asset, purchase or sale, value range, transaction date, disclosure date, and source links.”
Explore this capability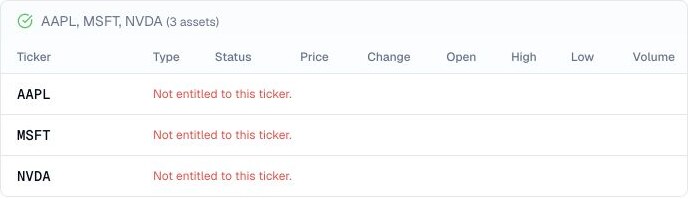
Bring stocks, options, currencies, crypto, and indexes into one market snapshot so price, session range, status, and volume are easy to compare.
Example: “Compare AAPL, MSFT, and NVDA in one market snapshot with price, session change, open, high, low, volume, status, and asset type. Flag unavailable symbols and explain what I should verify next.”
Explore this capability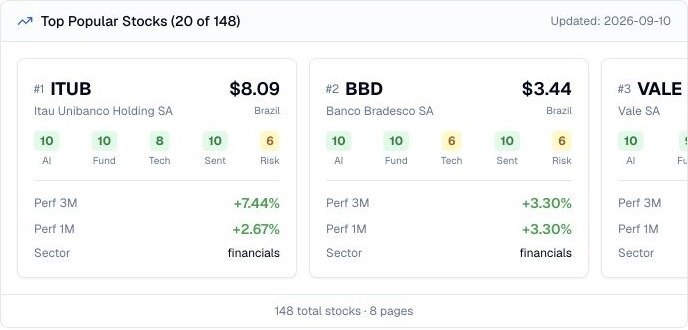
Browse a dated provider category of active US-listed stocks, ordered by AI Score, with component scores and recent price performance.
Example: “Show me the current popular-stock ranking and explain which names are worth researching next based on the displayed AI, fundamental, technical, sentiment, risk, and recent-performance context. Do not treat the list as a recommendation.”
Explore this capability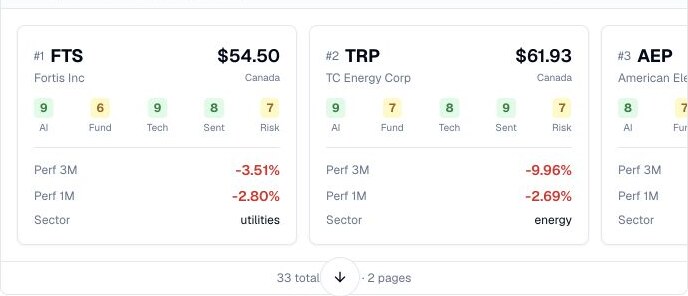
Browse the provider’s low-risk stock category, ordered by AI Score, with component scores and recent price performance.
Example: “Show the current low-risk stock ranking and explain which five names deserve defensive research. Separate the displayed risk signal from volatility, leverage, valuation, and business risks I still need to verify.”
Explore this capability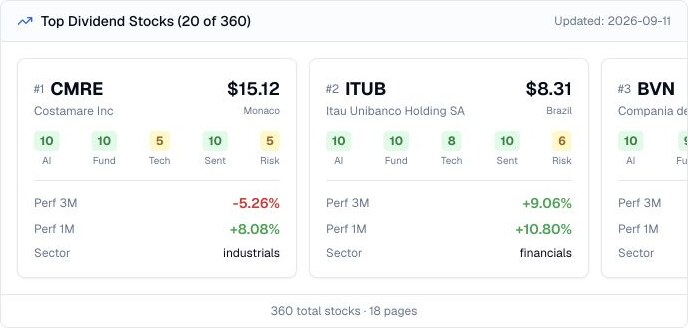
Explore dividend-paying stocks ranked with AI and compare their supporting signals, sectors, prices, and recent performance.
Example: “Show the current dividend-stock ranking and select five different income profiles for follow-up research. For each, explain what payout coverage, cash flow, debt, and valuation evidence I should verify.”
Explore this capability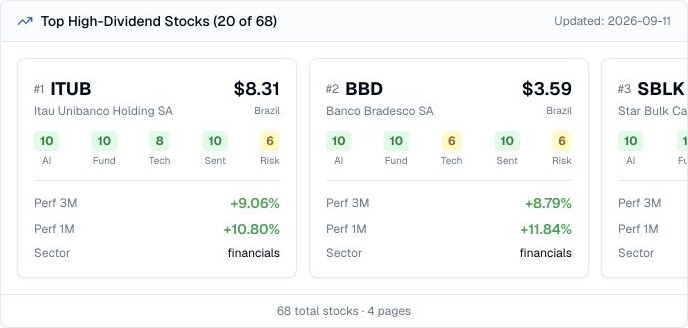
Explore higher-yield dividend stocks ranked with AI, then compare risk, business signals, sectors, and recent performance.
Example: “Show the high-dividend ranking and choose five names for payout-sustainability research. For each, list the cash-flow, debt, coverage, and valuation checks I should perform.”
Explore this capability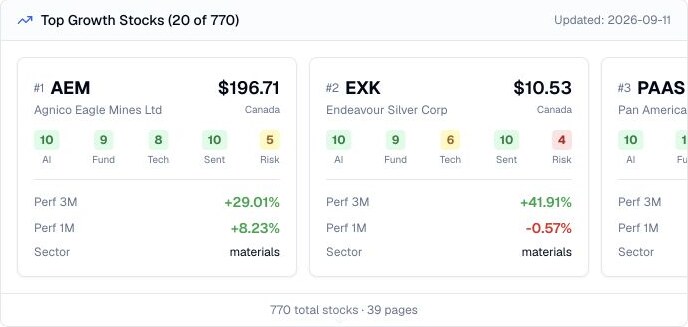
Explore growth-oriented stocks ranked with AI and compare their signals, sectors, geographies, prices, and recent performance.
Example: “Show the current growth-stock ranking and select five different growth profiles for research. For each, identify the revenue, margin, cash-flow, competition, and valuation evidence I should verify.”
Explore this capability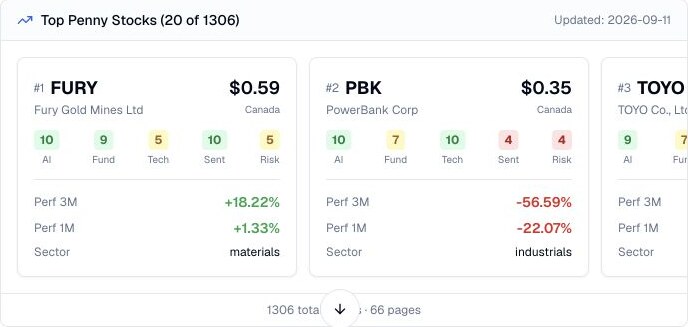
Explore lower-priced stocks ranked with AI and compare their signals, sectors, geographies, and sharp recent moves.
Example: “Show the current penny-stock ranking and choose five very different research candidates. For each, identify liquidity, dilution, cash runway, filing, and business risks to verify.”
Explore this capability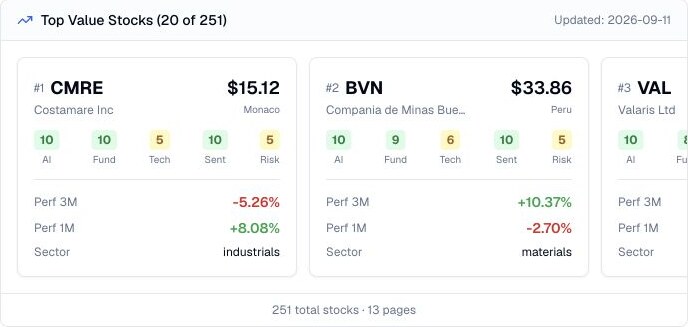
Explore value-oriented stocks ranked with AI and compare price, signals, sectors, geographies, and recent performance before deeper valuation work.
Example: “Show the current value-stock ranking and choose five different valuation situations for research. For each, identify the earnings, cash-flow, debt, quality, and catalyst evidence I should verify.”
Explore this capability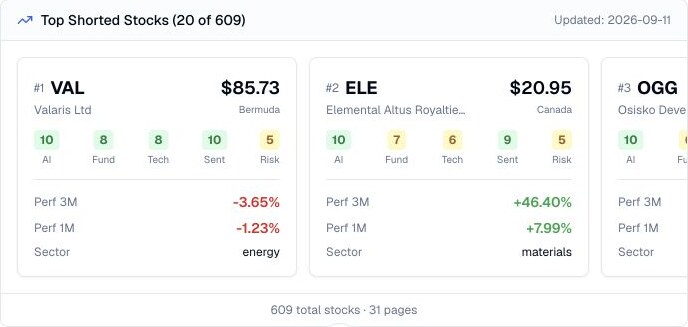
Browse the imported Danelfin shorted-stock category in AI Score order, then verify short-float percentages and reporting dates separately.
Example: “Show page 1 of the shorted-stock category with its dataset date. For five names, separate fields returned by this tool from short-float, borrow-cost, and liquidity information still needed.”
Explore this capability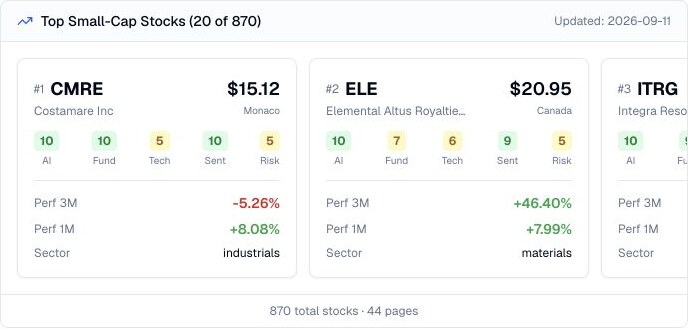
Explore small-cap stocks ranked with AI and compare company, sector, country, risk, score, and recent-performance context.
Example: “Show the current small-cap ranking and select five different company profiles for research. For each, identify liquidity, dilution, cash runway, governance, and valuation checks.”
Explore this capability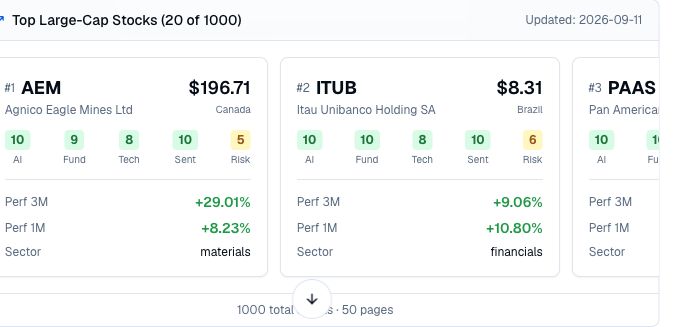
Explore established companies ranked with AI and compare company, sector, country, risk, score, and recent-performance context.
Example: “Show the current large-cap ranking and select five companies with different signal profiles for research. For each, identify valuation, balance-sheet, earnings-quality, and competitive checks.”
Explore this capability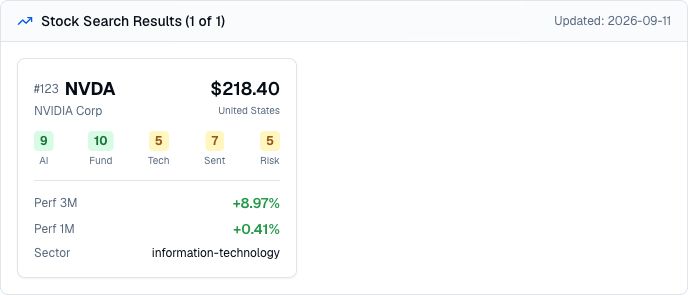
Look up a U.S. stock by ticker or company name and review its AI-rated signals, price, sector, and recent-performance context.
Example: “Search for NVDA and summarize what the displayed AI, fundamental, technical, sentiment, risk, sector, and recent-performance context says I should verify next. Do not treat it as a recommendation.”
Explore this capability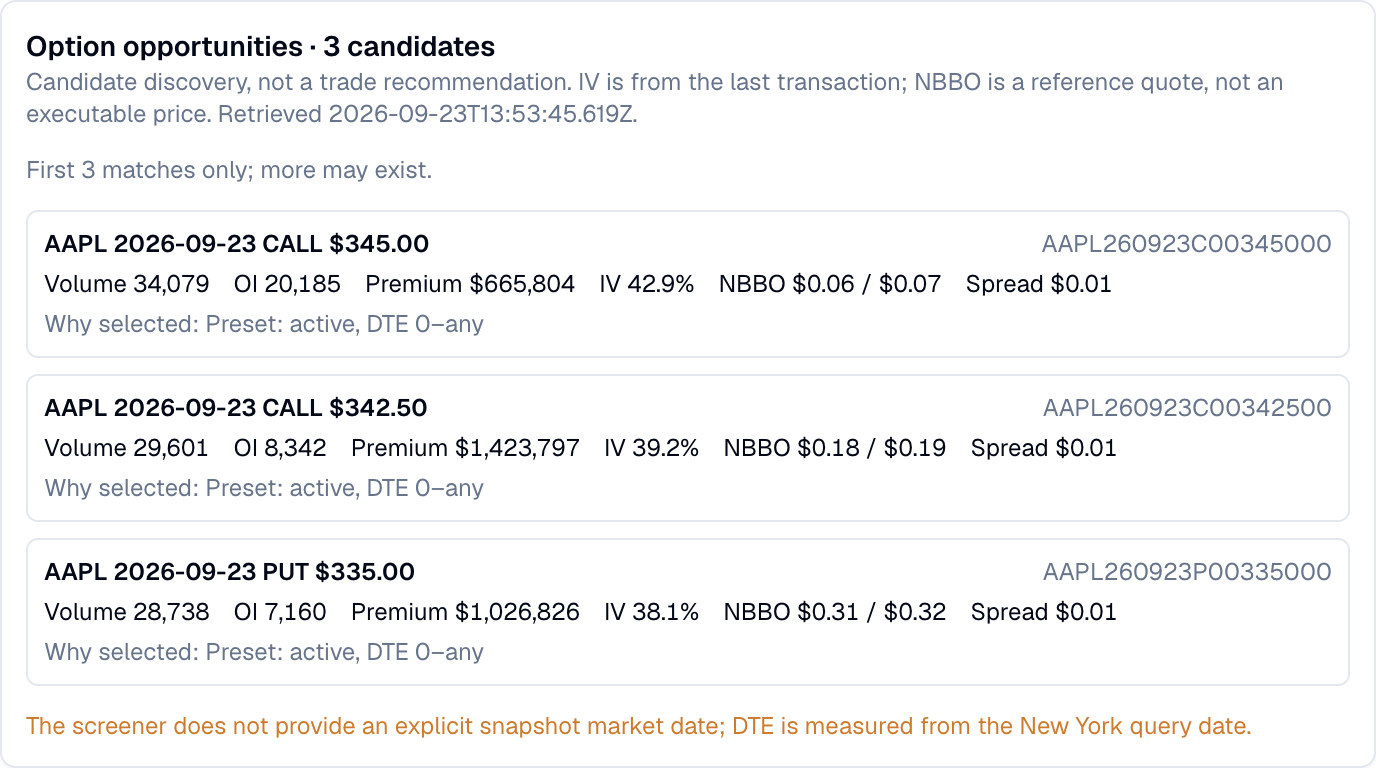
Find US option-contract candidates by trading activity, unusual volume, or an earnings window, then inspect why each contract matched.
Example: “Which active AAPL option contracts have the most activity in the latest available screen? Show why each call or put matched and what quote context is available.”
Explore this capabilitySearch the web for a finance question and use an AI-summarized answer with source links as a starting point for current research.
Example: “Search the web for the latest NVIDIA investor concerns and catalysts. Give me the source trail and separate reported facts from interpretation.”
Explore this capabilitySearch a public professional profile and gather available identity, role, biography, and social-link context for people research.
Example: “Find the public profile for a company executive and summarize the identity, current role, career context, and links I should verify in first-party sources.”
Explore this capabilitySearch public X/Twitter conversations for a finance topic and use the returned summary, links, and posts as sentiment and context leads.
Example: “Search X for the current NVIDIA stock conversation. Group recurring claims, identify the posts worth opening, and list the evidence needed to verify them.”
Explore this capabilitySearch public Reddit discussions for a finance topic and use the summary, thread titles, excerpts, and links as community-research leads.
Example: “Search Reddit for NVIDIA stock discussions. Summarize recurring investor questions, link the strongest threads, and list the claims I should verify independently.”
Explore this capability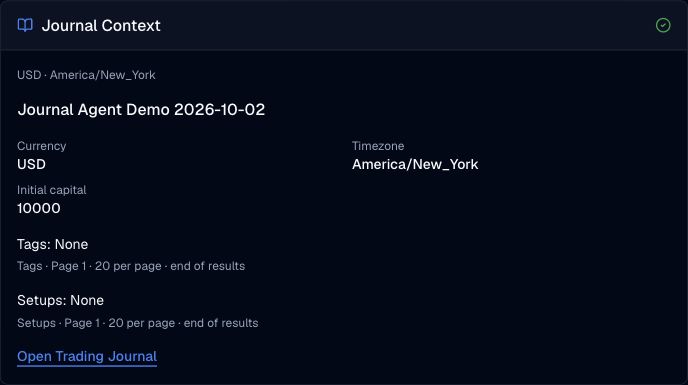
Find your existing journals and check the selected ledger’s currency, timezone, tags and setups before reading or recording activity.
Example: “Show my existing trading journals so I can choose the one to review.”
Explore this capability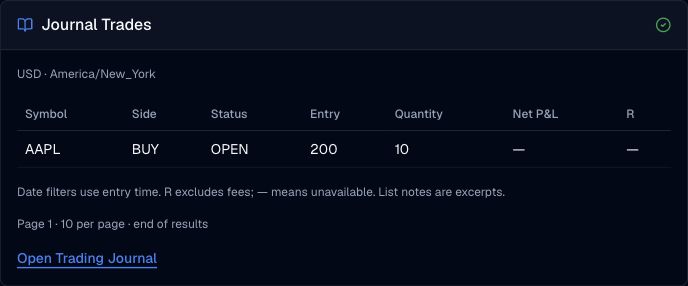
Read a filtered trade history or open a single trade for its notes and closing records, with the ledger’s currency and timezone.
Example: “Review my AAPL trades opened last month and show their recorded outcomes.”
Explore this capability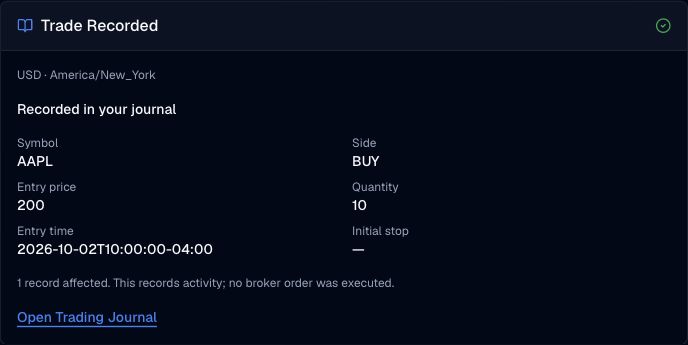
Ask Finance Agent to record a trade that already happened, including its symbol, side, entry price, quantity and event time, then review the saved receipt.
Example: “Record an executed AAPL buy in my selected journal: 10 shares at 200 USD on October 2, 2026 at 10:00 New York time.”
Explore this capability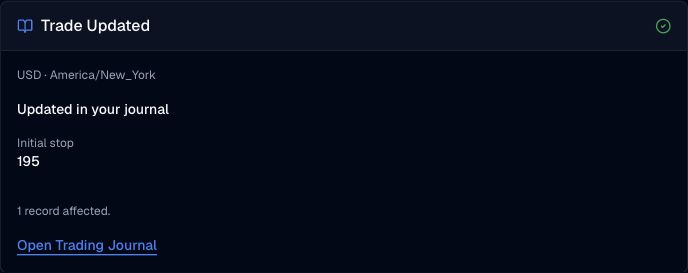
Ask Finance Agent to read a recorded trade and correct the entry details, initial stop, notes, or classifications you specify. Existing close entries remain part of the record; dependent calculations may change.
Example: “Read my selected trade and correct its review notes to the text I provide; preserve the other fields.”
Explore this capability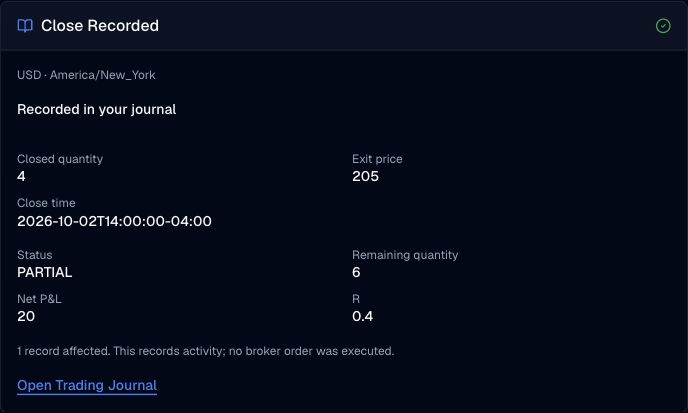
Record a closing event that already happened and review the journal’s remaining quantity, trade status, net profit or loss and available R result.
Example: “Read my selected trade, then record an executed partial close of 4 shares at 205 USD on October 2, 2026 at 14:00 New York time.”
Explore this capability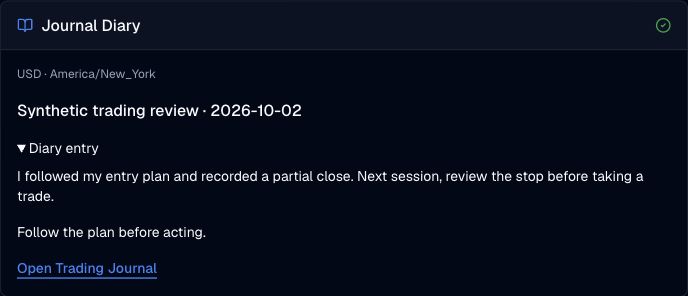
Browse diary entries by date or read a selected entry in full, then discuss your trading process within your own conversation.
Example: “Show my diary entries for last week in the selected journal.”
Explore this capability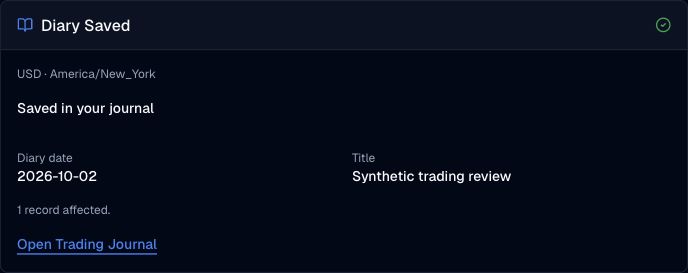
Create a dated trading diary entry or update selected fields through Finance Agent, with current journal context and your explicit instructions.
Example: “Create a diary entry for October 2, 2026 in my selected journal using the review text I provide.”
Explore this capability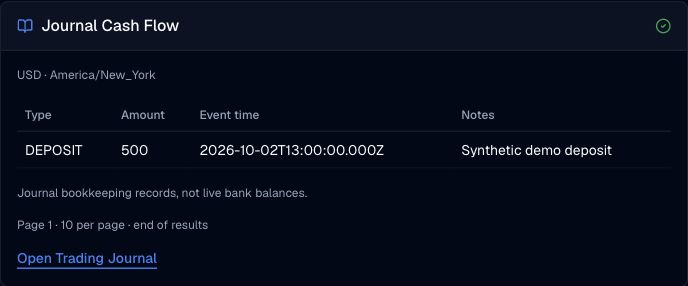
Read the deposits and withdrawals saved in your trading journal, including exact recorded amounts, event times and notes in the ledger’s account currency.
Example: “Show the deposits and withdrawals recorded in my selected journal.”
Explore this capability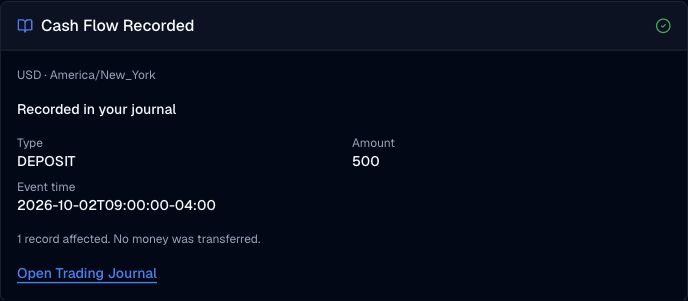
Explicitly ask Finance Agent to record a deposit or withdrawal that already happened, with a positive amount and clear event time, then review its saved receipt.
Example: “Record a completed deposit of 500 USD in my selected journal on October 2, 2026 at 09:00 New York time.”
Explore this capabilityReview recent trade reports for a member of Congress with the reported asset, buy or sell action, value band, transaction date, filing date, and owner context together.
Example: “Show 25 recent trade reports for Nancy Pelosi on the first page. Keep ticker, transaction type, amount band, household label, transaction date, and filing date together, and list the details I should verify in the original disclosures.”
Explore this capability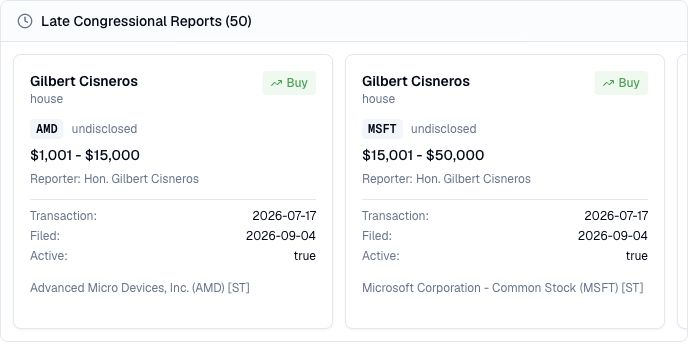
Find congressional trade reports marked as late and review the member, asset, action, reported value band, transaction date, and filing date together.
Example: “Show recent congressional reports marked late. Sort the research view by transaction date and keep member, ticker, buy or sell, value range, and filing date visible.”
Explore this capabilityBrowse public officials with available congressional trade activity and compare party, chamber, active status, trade dates, trade counts, and latest report context.
Example: “List Congress members with available trading activity and group them by chamber and party. Highlight the most recent trade dates and explain which individual filings I should open next.”
Explore this capability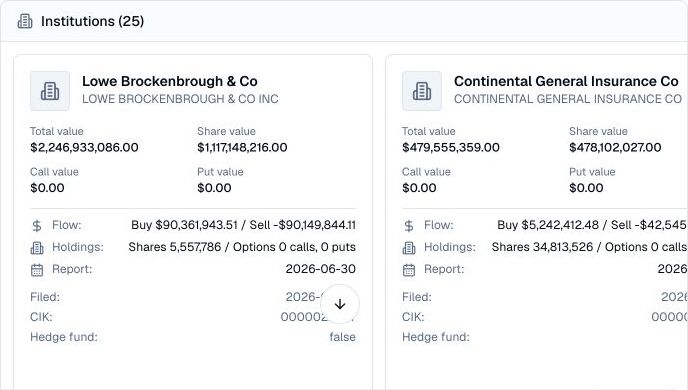
Browse public institution profiles with portfolio value, share and options value fields, recent buying and selling flow, holdings, and filing dates in one research view.
Example: “Browse the institution directory and identify organizations with the largest reported share portfolios. Keep total value, share value, options exposure, report date, and filing date together, then tell me what to verify next.”
Explore this capability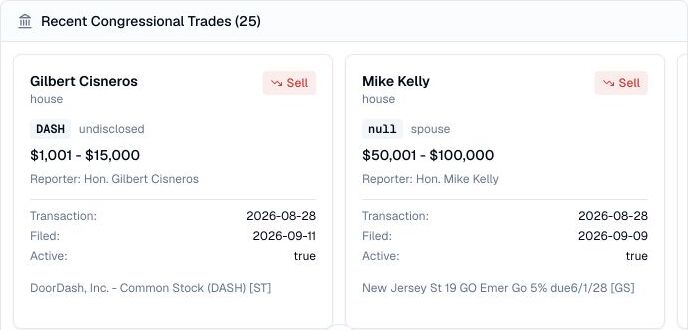
Browse recent congressional purchases and sales with the member, asset, action, reported value range, transaction date, and filing date together.
Example: “Show the latest congressional trades and group them by buy or sell. Keep member, ticker, reported value range, transaction date, filing date, and owner context visible, then suggest which filings to verify first.”
Explore this capability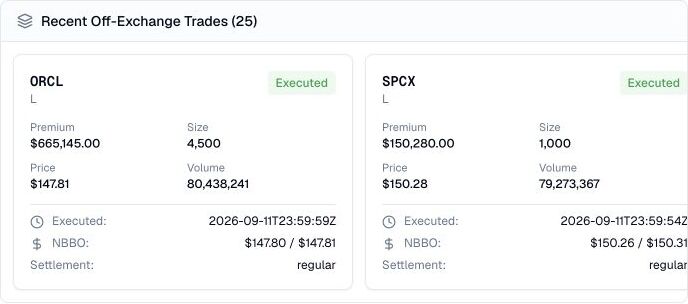
Scan recent off-exchange stock trades with ticker, size, execution price, premium, market volume, quote context, and timestamp together.
Example: “Show up to 25 recent off-exchange trades with reported premium above $100,000 and size above 1,000 shares. Compare notional value and share count separately; premium divided by shares is a price, not an unusual-activity score.”
Explore this capability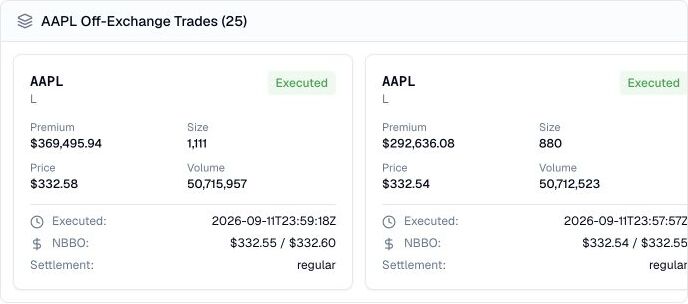
Inspect off-exchange trades for one stock with execution time, size, price, premium, quote range, market volume, and settlement context.
Example: “Show up to 50 AAPL off-exchange records for the latest market date. Identify the largest premiums and sizes within this returned sample, retain UTC execution times and cancellation status, and distinguish consolidated daily volume from print size.”
Explore this capability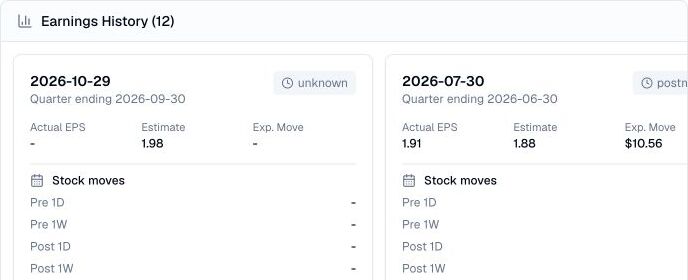
Review a stock’s historical earnings dates, EPS estimates and actuals, expected move, post-report price moves, and options straddle context.
Example: “Review AAPL earnings history and compare EPS estimate versus actual, expected move, and post-report one-day and one-week stock moves. Highlight recurring patterns but do not treat them as a forecast.”
Explore this capability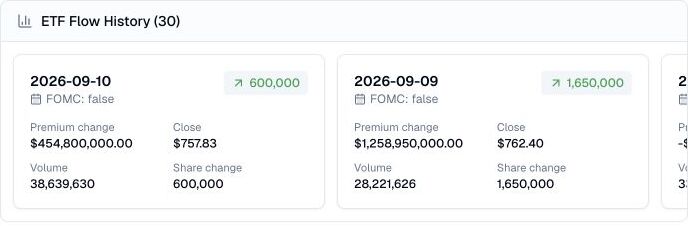
Review an ETF’s reported share creation and redemption flow with premium change, close price, volume, event tags, and market dates together.
Example: “Review SPY ETF inflow and outflow history and highlight the largest share changes. Compare premium change, close, volume, and market events without treating flow as a direct buy or sell signal.”
Explore this capability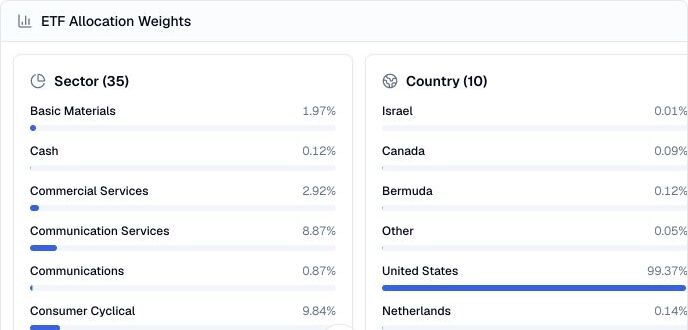
Review an ETF’s country and sector mix together to see where its exposure is concentrated and how the fund is diversified.
Example: “Show SPY’s country and sector allocation from largest to smallest. Highlight concentration, explain what the snapshot establishes, and keep interpretation separate from investment advice.”
Explore this capability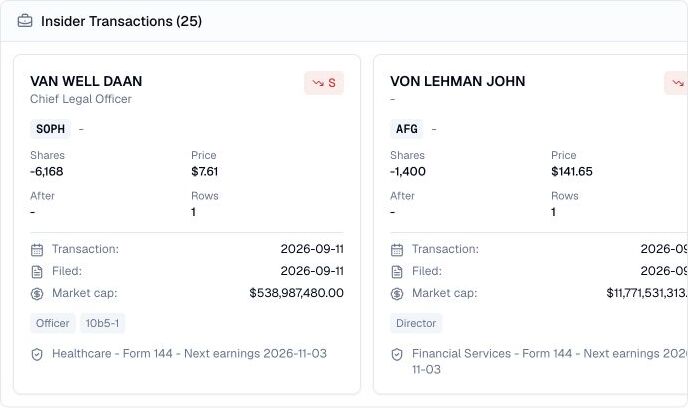
Browse recent company insider transactions with the ticker, reporting person, role, transaction type, shares, price, sector, and filing context together.
Example: “Show the latest company insider transactions and group them by ticker, person, role, and buy or sell action. Distinguish proposed-sale notices, awards, and gifts from completed open-market transactions, and separately flag disclosed trading plans.”
Explore this capability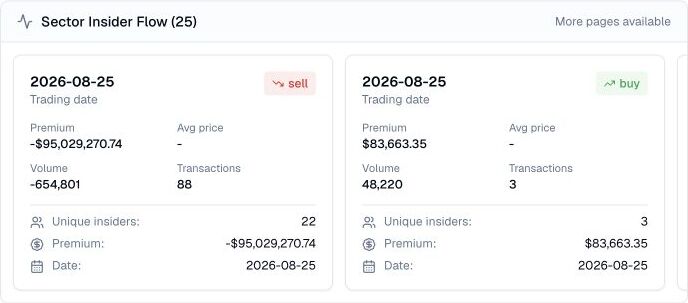
Review aggregated insider buying and selling by sector, with daily premium, volume, transaction counts, and unique-insider context.
Example: “Review Technology-sector insider buying and selling over the recent period. Compare daily premium, volume, transaction count, and unique insiders, then explain what I should verify at the company and filing level.”
Explore this capability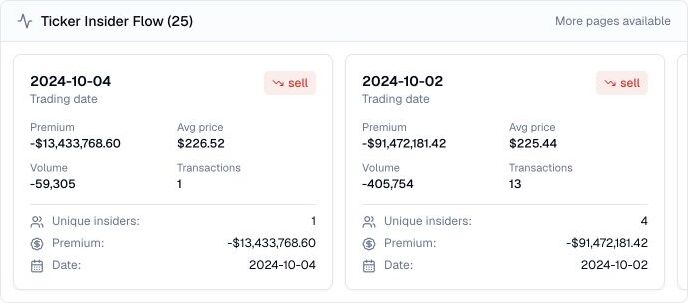
Track aggregated insider buying and selling for one stock with dated premium, average price, volume, transaction count, and unique-insider context.
Example: “Review AAPL ticker insider flow over the available history. Highlight the largest buy and sell dates, compare premium, volume, average price, and unique insiders, and keep the evidence separate from interpretation.”
Explore this capability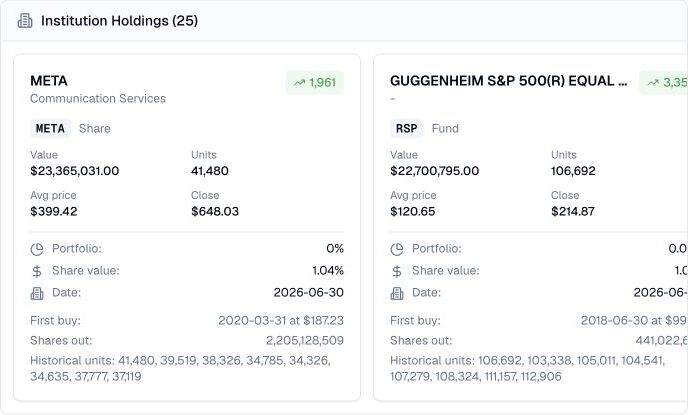
Explore a reported institution portfolio with holdings, units, value, price context, ownership share, and position changes together.
Example: “Review the reported holdings of Lowe Brockenbrough & Co. Rank positions by value and portfolio share, highlight unit changes, and separate the snapshot evidence from conclusions about conviction.”
Explore this capability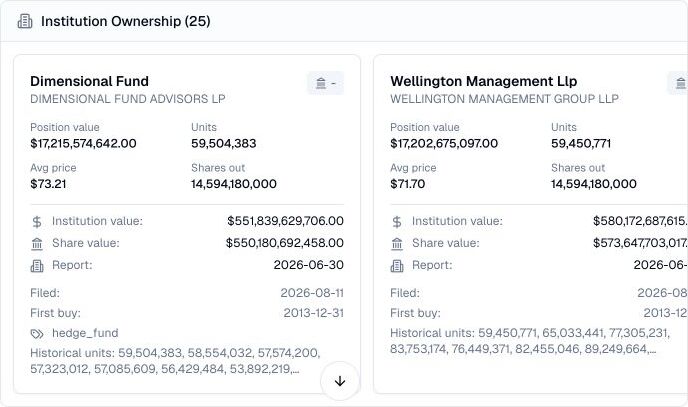
See which institutions report owning a stock, with position value, units, average price, report and filing dates, and ownership context.
Example: “Fetch AAPL ownership with value descending, page 1 and 25 rows. Show units, provider average price, report date and filing date. State that this is one page, then offer to fetch the next page before calling the list complete.”
Explore this capability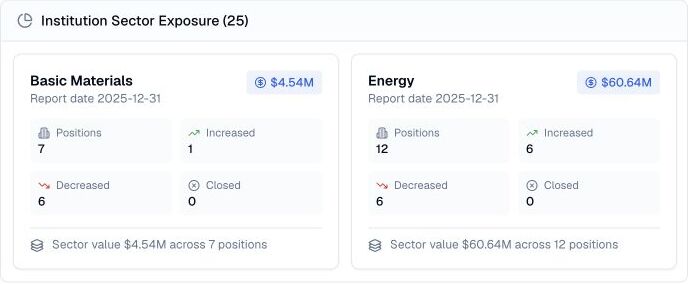
See how a reported institution portfolio is distributed across sectors, with position counts, value, and movement context.
Example: “Fetch Lowe Brockenbrough & Co sector exposure for 2025-12-31, starting at page 1 with 25 rows. Keep dates visible, fetch further pages if needed, then rank only the collected same-date rows by value.”
Explore this capability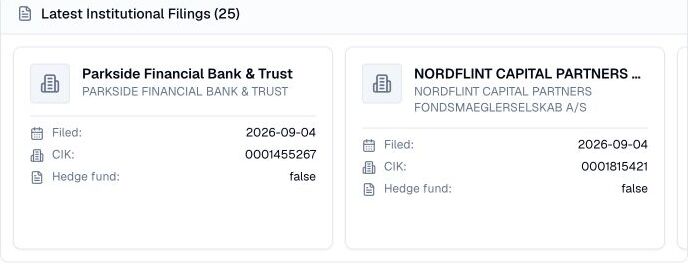
Keep up with newly reported institution filings, including filing dates, entity names, identifiers, and profile context.
Example: “Fetch the latest institution-filing metadata, page 1 with 25 rows. Group this page by filing date, show CIK and available tags, then identify the next page and the EDGAR search needed to verify each document.”
Explore this capability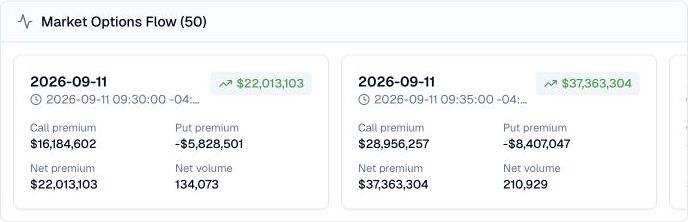
Follow market-wide intraday options premium and volume by time interval to frame broad participation and sentiment.
Example: “Fetch market options flow for a specified trading date at five-minute resolution and limit 50. State returned timestamp coverage and OTM setting, explain signed net fields, and do not call the result a complete session or a live stream.”
Explore this capability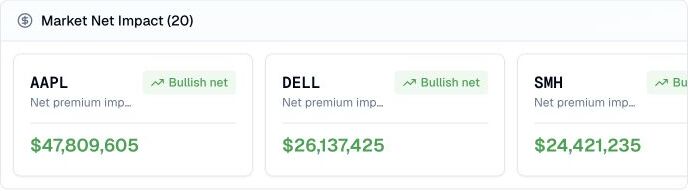
Find the tickers with the largest positive and negative options premium impact in the market’s latest available session.
Example: “Scan the latest market top net impact. Rank the positive and negative contributors, show the premium values, and list the option-chain and catalyst evidence I should verify for the top five.”
Explore this capabilityDiscover drug and biotech catalyst records with target dates, development stage, indication, market context, and source links.
Example: “Find FDA-related catalysts for biotech tickers I specify. Group them by target date and phase, explain the event type, and link the source announcement without predicting the outcome.”
Explore this capability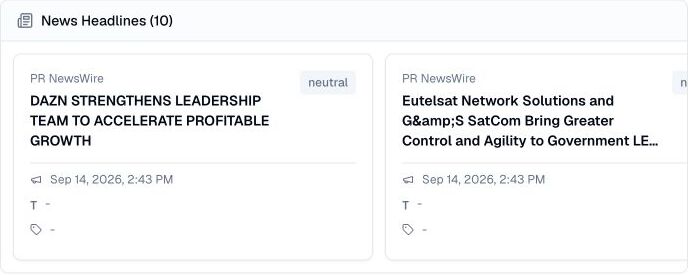
Scan recent market headlines with source, time, related tickers, tags, sentiment, and major-news context in one feed.
Example: “Scan recent headlines for AAPL and summarize only developments that could change the business or valuation. Include source, time, related tickers, and the primary evidence I should verify.”
Explore this capabilityStart with a company, market event, or research question. Finance Agent can select supported tools. Check source dates, missing fields, plan access, and AI credits before relying on a result.
Open Finance Agent