

Find the products driving reported revenue
Review product lines ordered by reported amount, with their shares of the sum of displayed entries. Check whether the entries overlap or include subtotals before using those shares to measure concentration.
Pineify Finance Agent retrieves FMP’s annual or quarterly product revenue entries for one company. Cards show reported amounts, dates, currency when supplied, and each entry’s share of the displayed sum. Compare the entries with company filings before treating that sum as consolidated revenue or interpreting a mix change.
Opens Finance Agent with an Apple product-revenue mix question ready to send.
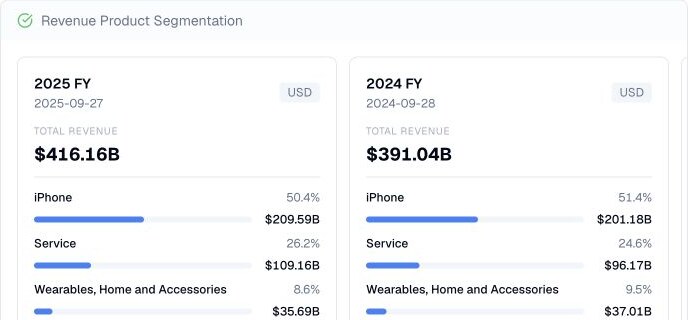
A product-mix view
Choose a ticker and annual or quarterly reporting; annual is the default. The result retains up to 50 observations, without a custom date range or page selector. Within a card, product amounts are sorted from largest to smallest. Compare equivalent fiscal periods before calculating growth.
Product labels and boundaries follow company disclosures and available data, which may change after reorganizations or reclassification. Treat the view as a map to the filing and earnings narrative rather than a universal segment taxonomy.
Use cases
Review product lines ordered by reported amount, with their shares of the sum of displayed entries. Check whether the entries overlap or include subtotals before using those shares to measure concentration.
Compare product amounts in the reported currency and their calculated shares across like-for-like periods. The figures can identify changes to investigate; they do not isolate pricing, sales volume, currency translation, or product launches.
Use the largest changes to guide questions about pricing, volumes, adoption, cannibalization, competition, backlog, and the company’s segment commentary.
Prompt examples
FAQ
Start with the contribution pattern, then confirm segment definitions, reported dates, eliminations, currency, and company disclosures before relying on a mix comparison.
Open Finance AgentFor informational and research use only. No output is investment advice or a guarantee of future performance.