

Rank sector leaders and laggards
Compare available sectors on the same date and quickly see which groups recorded the strongest and weakest average changes.
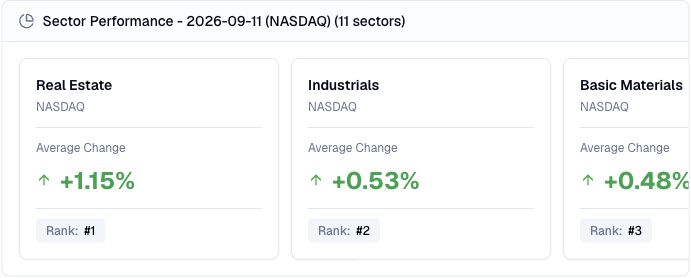
Pineify Finance Agent retrieves FMP sector-performance observations for a chosen date, optionally narrowed to an exchange or sector. Cards rank the returned observations by the provider’s average percentage change. Use one exchange and date for a clearer comparison before researching individual companies.
Opens Finance Agent with a dated U.S. sector-performance question ready to send.
Market leadership context
A broad index move can hide large differences between parts of the market. Comparing sectors on the same date gives you a clearer view of which groups participated in the move and which moved in the opposite direction.
Choose a date and, preferably, an exchange. Up to 50 observations are retained before the cards sort them by average change. Without an exchange filter, the same sector can appear for several exchanges; a row is a sector-exchange observation, not a consolidated U.S. sector return.
Use cases
Compare available sectors on the same date and quickly see which groups recorded the strongest and weakest average changes.
Ask about a specific exchange or narrow the question to one sector when you need a more focused market snapshot.
Use the ranking to decide which industries, companies, filings, or news themes deserve a closer look in Finance Agent.
Prompt examples
FAQ
Start with the sector ranking, then investigate the industries and companies behind the strongest or weakest groups.
Open Finance AgentFor informational and research use only. No output is investment advice or a guarantee of future performance.