

Find the regions carrying reported revenue
Compare each reported region’s amount and share of the displayed sum. The card preserves the provider’s entry order; a ranking requires comparing those values rather than assuming the first row is largest.
Pineify Finance Agent retrieves FMP’s annual or quarterly geographic revenue entries for a company. The card shows region amounts, reporting period and date, reported currency when supplied, and each entry’s share of the sum of displayed entries. Reconcile that sum with the issuer’s filing before treating it as consolidated revenue.
Opens Finance Agent with an Apple regional-revenue question ready to send.
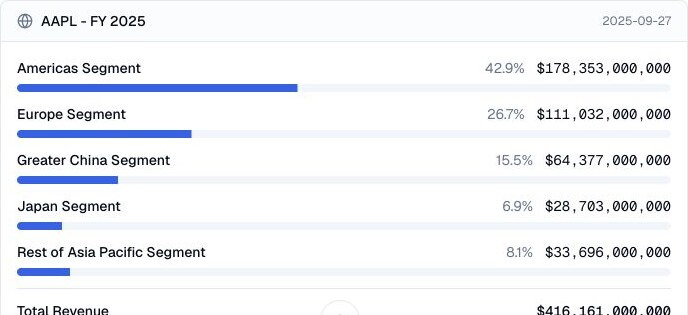
A regional exposure view
Choose one ticker and annual or quarterly reporting; annual is the default. Up to 50 observations are retained. This tool has no date range, page selector, or custom region filter. Compare the returned period labels and amounts, then check whether region definitions changed between filings.
Geographic attribution follows company disclosures and may reflect customer location, billing address, legal entity, or another convention. Treat the view as a map to the filing and regional commentary rather than a perfect measure of end-market demand.
Use cases
Compare each reported region’s amount and share of the displayed sum. The card preserves the provider’s entry order; a ranking requires comparing those values rather than assuming the first row is largest.
Compare like-for-like regional amounts and mix across reporting periods. A change can raise questions about demand or currency, but these revenue entries alone do not separate volume, pricing, translation effects, or reorganizations.
Use the largest regional changes to guide questions about demand, regulation, tariffs, competition, foreign exchange, and the company’s market commentary.
Prompt examples
FAQ
Start with the regional contribution pattern, then confirm segment definitions, reporting scope, currency effects, eliminations, and local-market disclosures before relying on a comparison.
Open Finance AgentFor informational and research use only. No output is investment advice or a guarantee of future performance.