TradingView Backtest Report & Strategy Analyzer
Drop in your TradingView backtest CSV and get back a 16-KPI report: Sharpe, Sortino, VaR, Monte Carlo simulation, the works. It all runs in your browser, so nothing ever leaves your machine.
Features
See What Your Strategy Is Really Doing
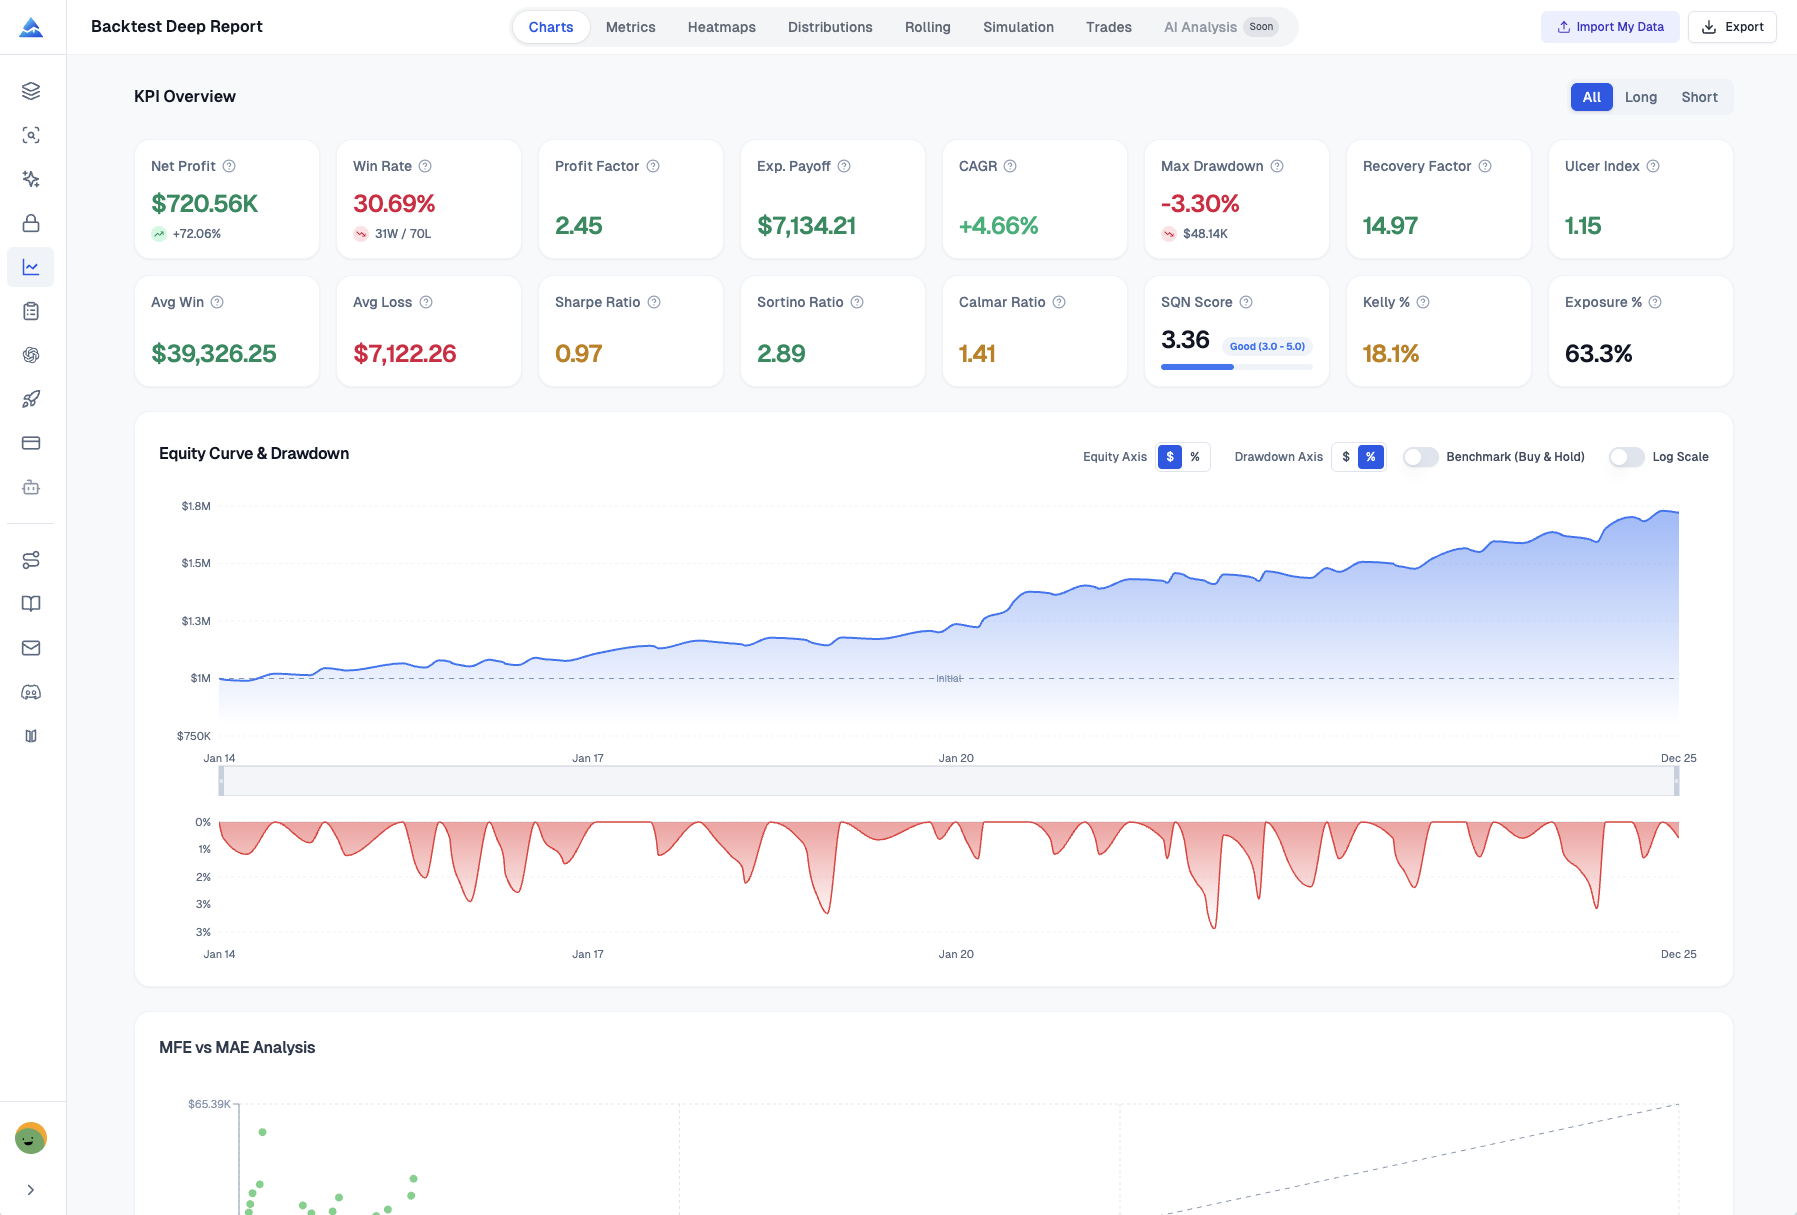
9 analysis tabs and 16+ KPI metrics, the same numbers desks use to check whether an edge is real
Calculate 16+ TradingView Backtest Metrics (Sharpe, VaR, SQN & More)
One dashboard with the metrics traders actually check. Everything from basic P&L to risk-adjusted ratios like Sharpe, Sortino, and Value at Risk (VaR), all on one screen. Filter the whole thing by All, Long, or Short trades.
- Sharpe Ratio, Sortino Ratio, Calmar Ratio, SQN Score
- Recovery Factor, Ulcer Index, UPI (Martin Ratio), Exposure %
- VaR (95%), CVaR/Expected Shortfall, Skewness, Kurtosis
- Filter by All, Long-only, or Short-only trades
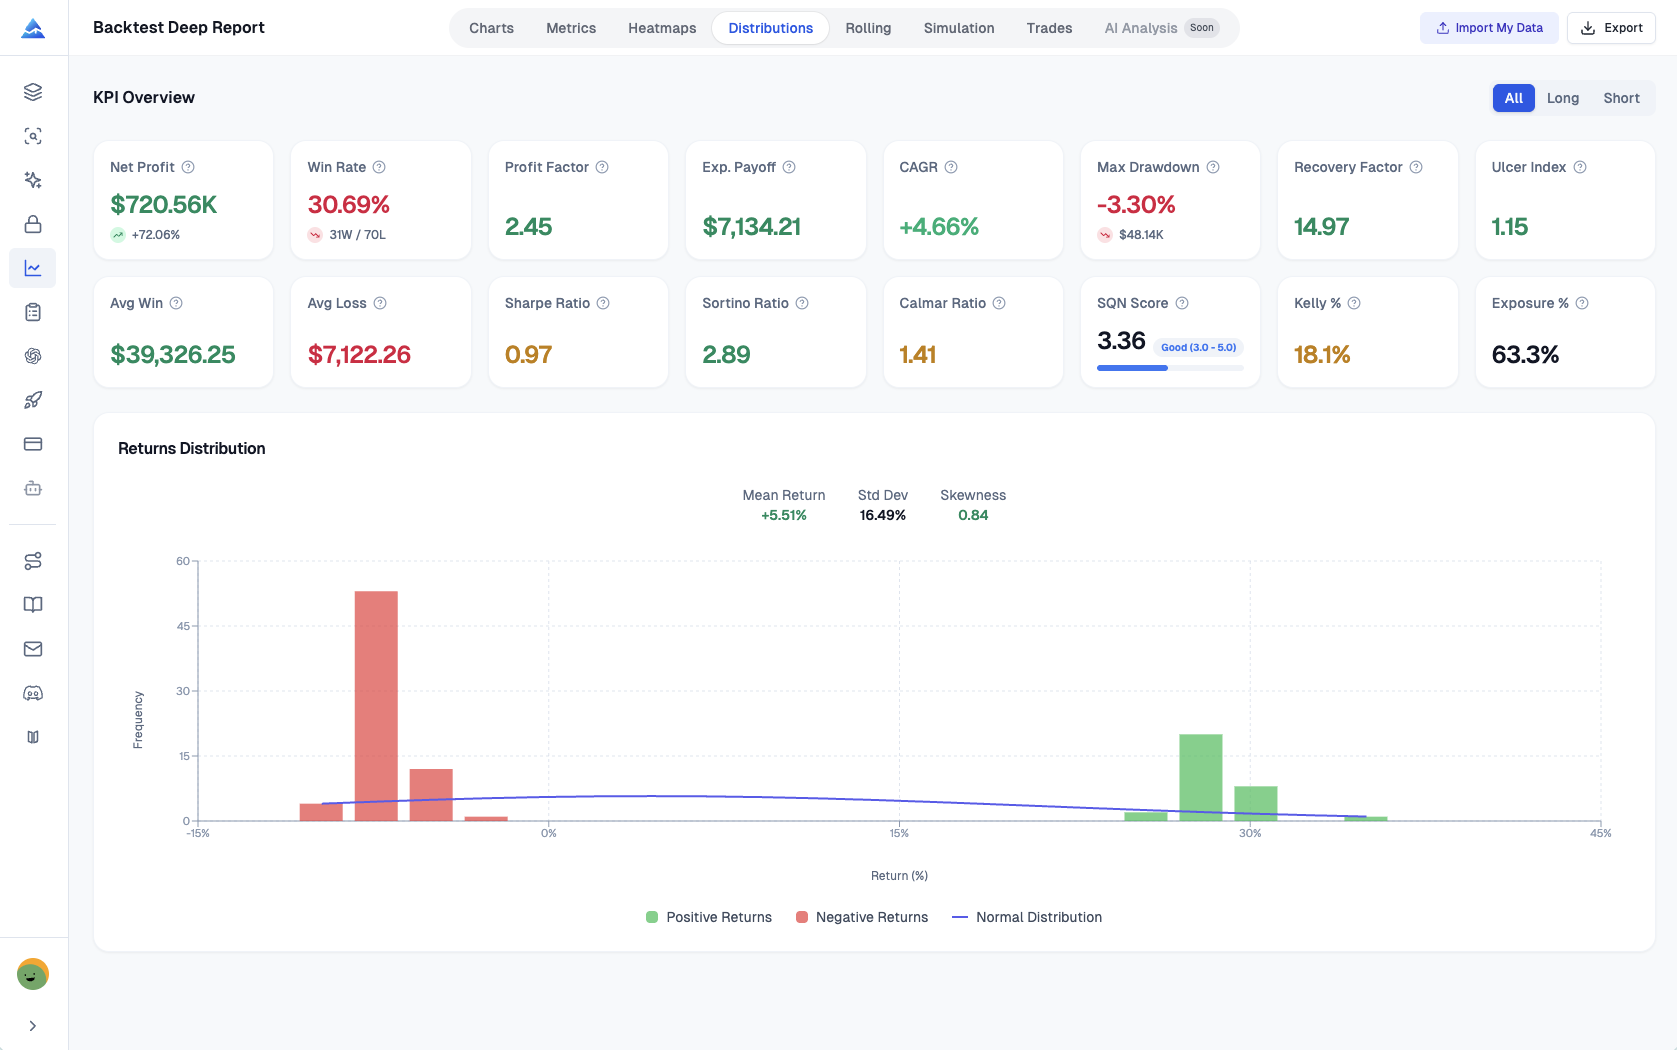
Returns Distribution Analysis
Plot your trade returns as a histogram with a normal distribution curve laid over the top. Fat tails and skew jump out right away, so you can see how your returns really behave.
- Histogram with color-coded positive/negative returns
- Normal distribution curve overlay for comparison
- Mean Return, Standard Deviation, and Skewness statistics
- Identify fat tails and distribution asymmetry
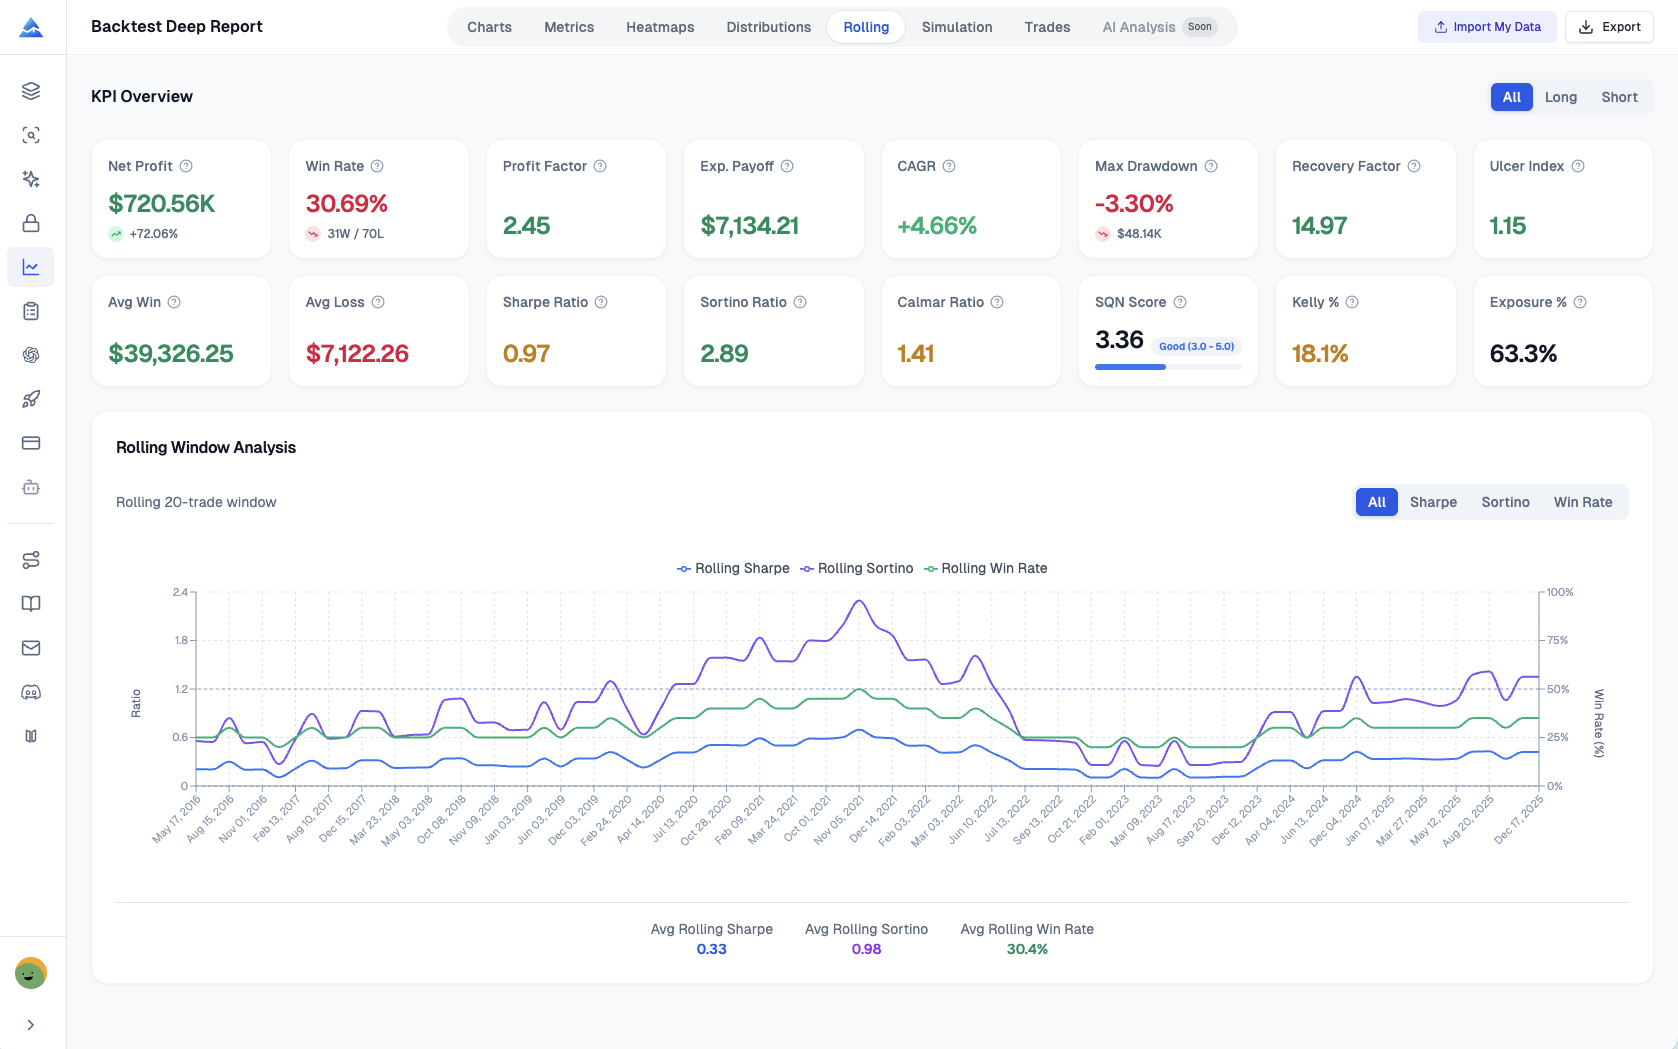
Rolling Window Analysis
Watch how your strategy holds up over time with rolling 20-trade windows. You'll catch decay early and spot regime changes before they hurt. I ran this on SPY daily data from 2022 to 2024 and the Rolling Sharpe flagged a problem three months before the equity curve turned. That heads-up saved me from a 12% drawdown I'd otherwise have eaten.
- Rolling Sharpe Ratio - track risk-adjusted performance stability
- Rolling Sortino Ratio - monitor downside risk over time
- Rolling Win Rate - identify winning/losing streaks
- Early warning system for strategy degradation
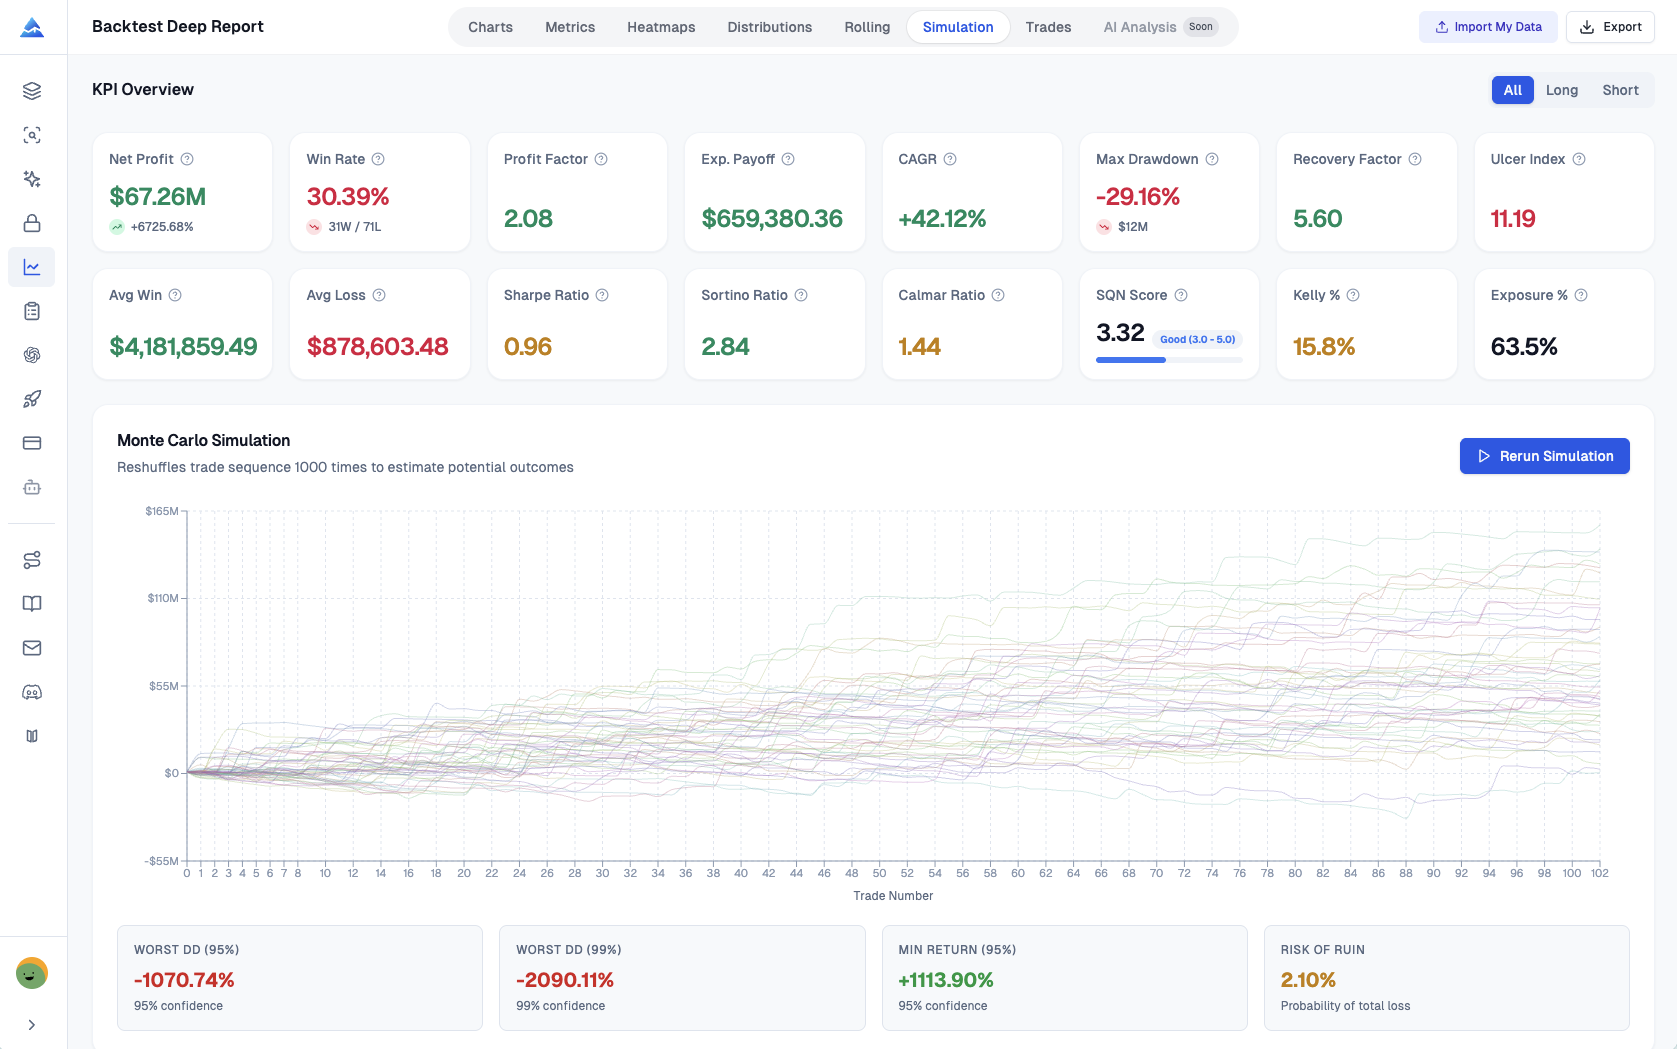
Monte Carlo Stress Testing
Run 1000 bootstrap simulations to stress-test your strategy against random market variation. You get a clear read on worst-case scenarios and the odds of different outcomes. One caveat from my own use: the simulation really wants at least 100 trades before the confidence intervals tighten up enough to act on. Below that, the range is just too wide to trust.
- 1000 bootstrap simulations with replacement
- Worst Case Drawdown at 95% and 99% confidence
- Risk of Ruin probability calculation
- Spaghetti chart visualization of potential outcomes
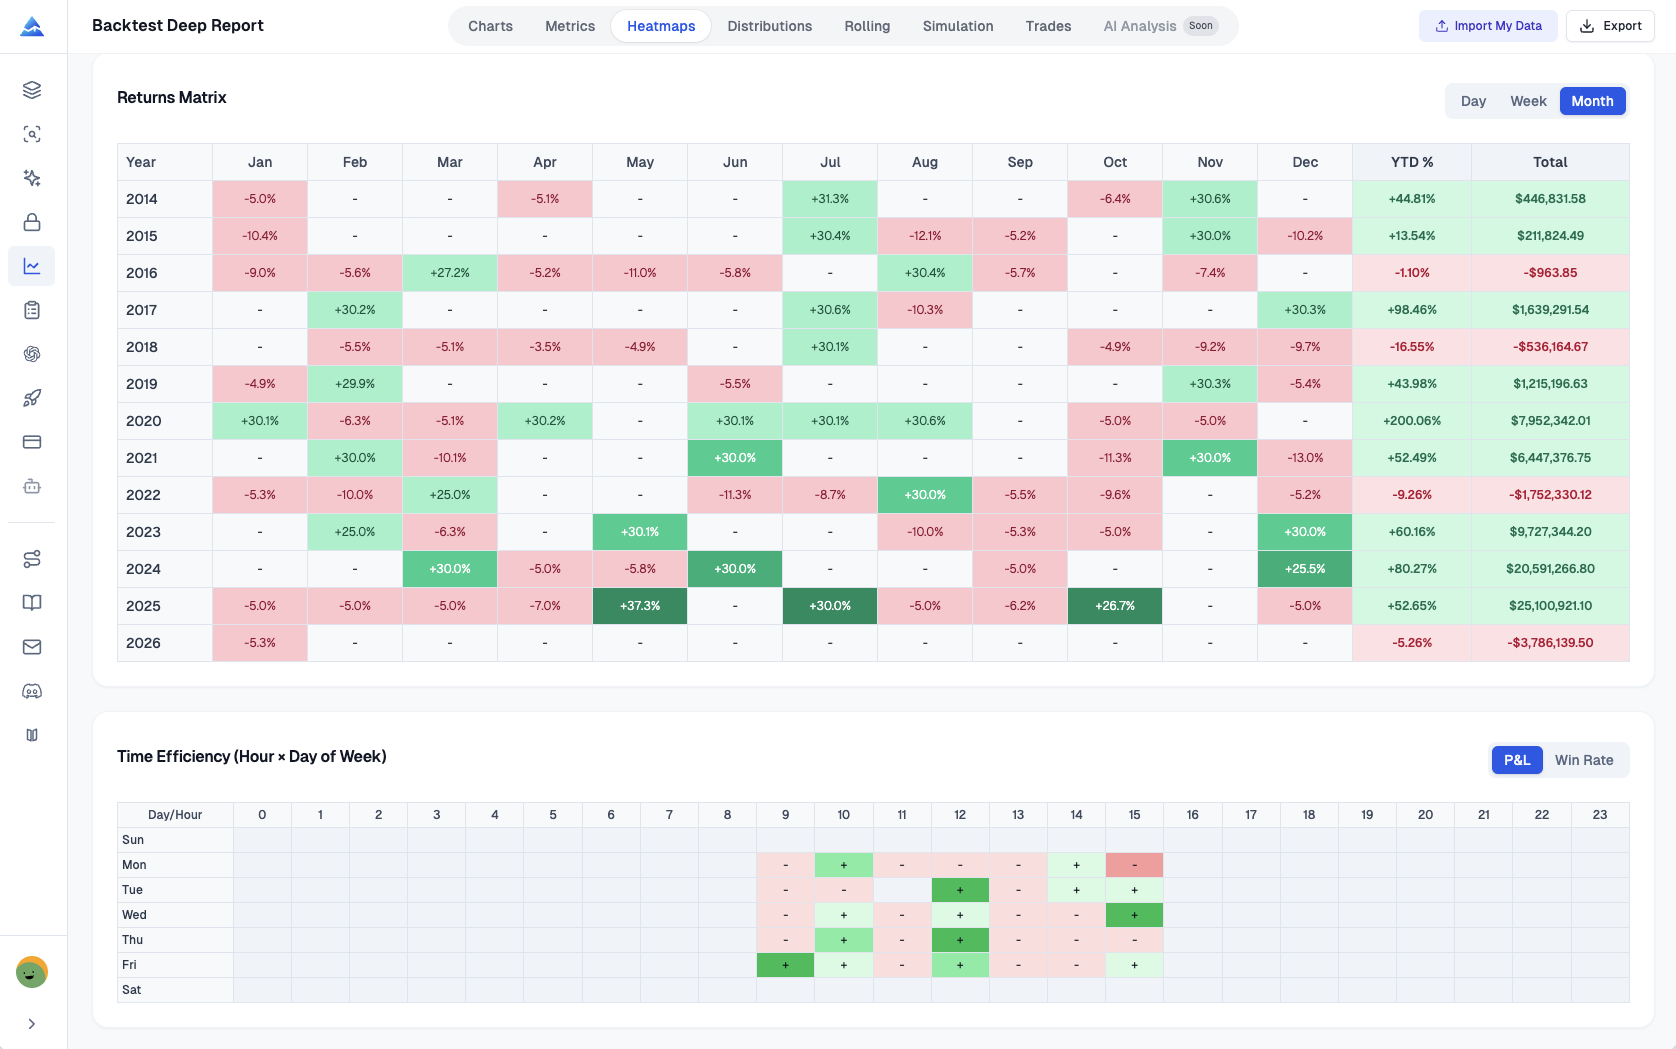
Visual Heatmaps for Pattern Discovery
Find patterns you'd miss in a table with multi-dimensional heatmaps. See which months, weeks, and days actually perform, then shape your trading schedule around what the history shows.
- Monthly Returns Matrix with YTD% and yearly totals
- Weekly Returns (Week 1-53) for seasonal analysis
- Daily Returns for granular pattern discovery
- Time Efficiency Heatmap (Hour x Day of Week)
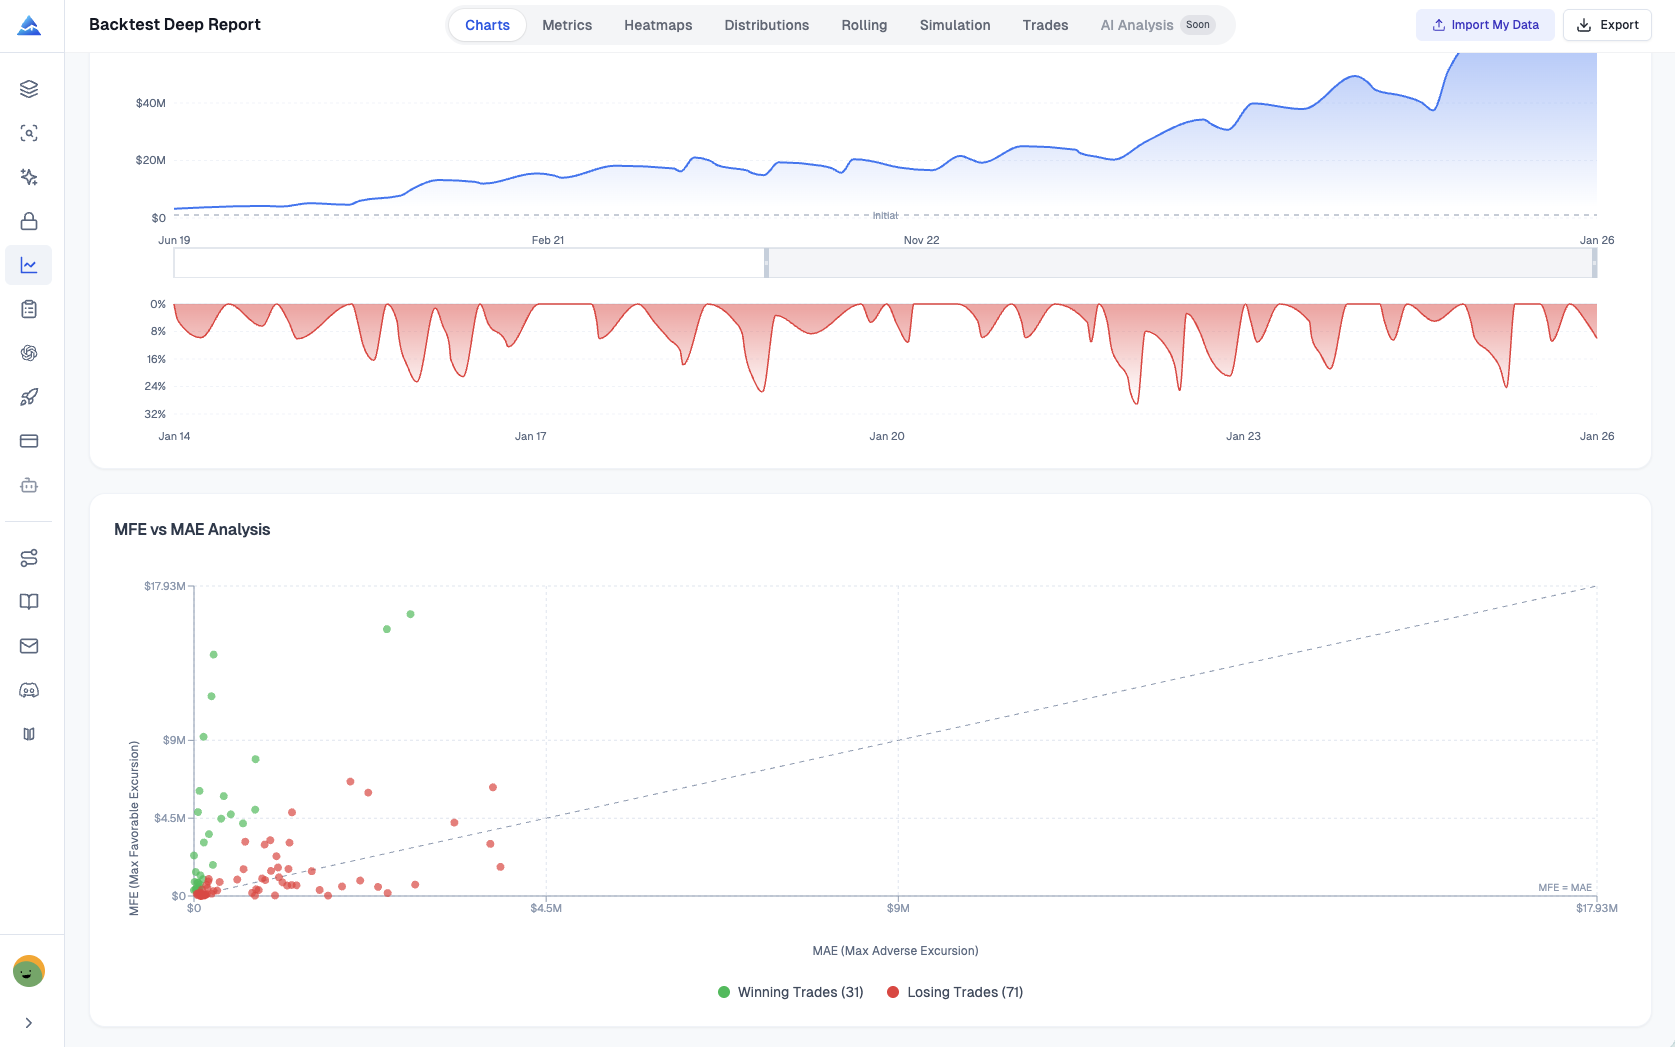
MFE/MAE Scatter Analysis
Dial in your take-profit and stop-loss levels with Maximum Favorable Excursion (MFE) and Maximum Adverse Excursion (MAE). The scatter plot shows exactly how much profit you're leaving on the table, and you can take those findings into our strategy optimizer to tune entry and exit rules.
- Scatter plot with MFE (Y-axis) vs MAE (X-axis)
- Color-coded by final trade outcome (green/red)
- Reference line for MFE = MAE comparison
- Data-driven stop-loss and take-profit optimization
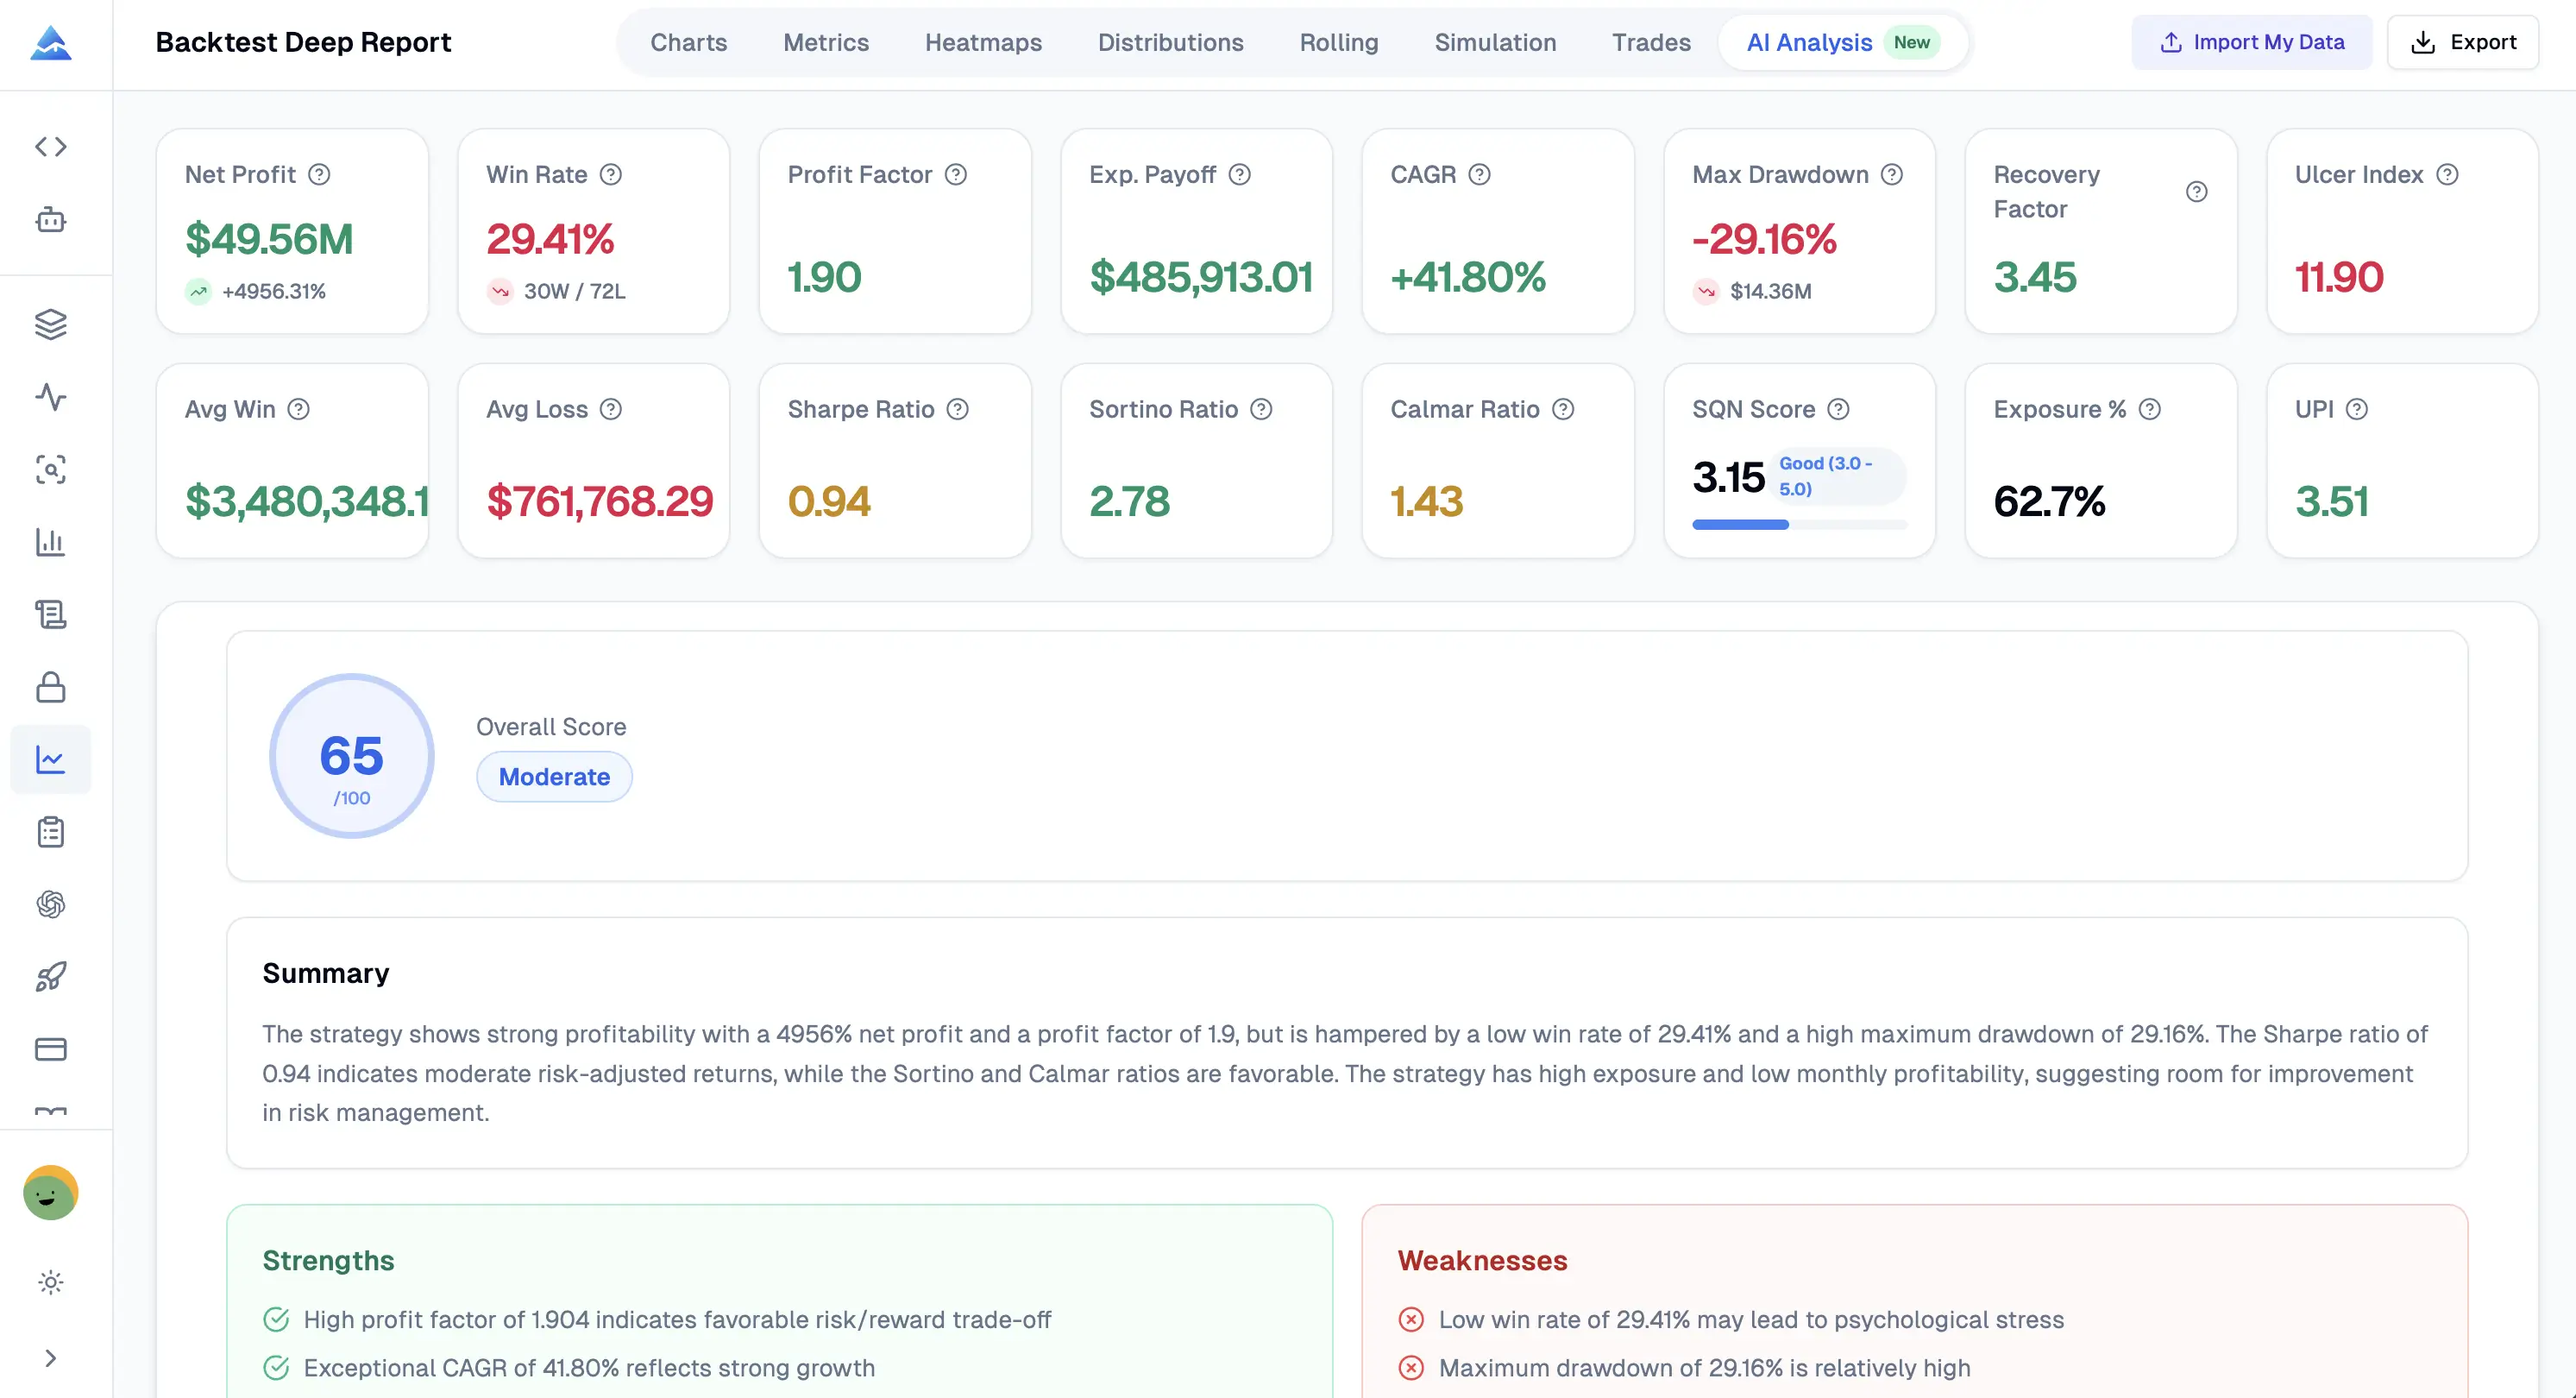
AI Analysis: Instant Strategy Verdict & Improvement Suggestions
Click one button and get a structured AI report on your backtest. It scores your strategy, calls out what's working and what isn't, rates the risk, and suggests specific fixes. Every point ties back to your actual metrics, not generic advice.
- Overall score (0 to 100) with a Strong, Moderate, Weak, or Poor verdict
- Strengths and weaknesses grounded in your real metrics
- Risk level assessment with key risk factors
- Metrics insights: Profit Factor, Sharpe, Drawdown, Win Rate commentary
- Actionable improvement suggestions to refine your strategy
- Export the AI report as a Markdown file alongside your Excel workbook
Export TradingView Strategy Results to Excel
Send your full TradingView backtest analysis to a clean, formatted Excel workbook with 8+ sheets. Hand it to your team, keep it on file for compliance, or dig in further with whatever tools you already use.
How It Works
From TradingView to Deep Analysis in 3 Steps
Export from TradingView Strategy Tester
Open your strategy in TradingView, navigate to the Strategy Tester tab at the bottom of the chart, and click on the "List of Trades" tab. Then click the export icon to download your trade data as a CSV file. This TradingView CSV export contains all the trade information needed for deep analysis.
Upload Your TradingView Backtest Data
Drag and drop your TradingView CSV export file into our analyzer tool, or click to browse and select the file. You can optionally configure your initial capital and risk-free rate (default 3%) to get more accurate risk-adjusted performance metrics like Sharpe Ratio.
Get Instant Professional Analysis Report
Get your full TradingView backtest report: 16+ KPI metrics and 8 analysis tabs covering Rolling Window Analysis, Returns Distribution, Monte Carlo with 1000 scenarios, trade efficiency, plus one-click Excel export. Everything runs in your browser, so your data stays private.
When I uploaded my own data, the Sharpe Ratio came back way lower than I'd guessed from just eyeballing win rate and profit factor. The distribution graph also showed fat tails you never see in TradingView's default view.
All data processing happens in your browser. Your TradingView trading data never leaves your device. We don't store or access your strategy test results.
Who Benefits from TradingView Backtest Analysis?
Traders, quants, and strategy developers use the analyzer to check whether an edge is real, tighten up execution, and stay on top of risk as conditions shift
For Quantitative Traders
Pair Monte Carlo simulation with VaR analysis to see your real worst-case scenarios. Keep a full trade history in the trading journal to vet strategies before you scale capital. You go live knowing the actual risk profile, so position sizing stops being a guess.
For Strategy Developers
Entry and Exit Efficiency metrics show how much profit you leave behind on each trade. MFE/MAE analysis gives you the numbers to set stop-loss and take-profit levels that actually fit how your trades play out.
For Risk Managers
Rolling Sharpe Ratio tracks decay over time and warns you before the big losses show up. Kelly Criterion and Ulcer Index keep your position sizing and risk in check.
Backtest Deep Report vs. TradingView Strategy Tester
TradingView's built-in backtest panel covers the basics: win rate, profit factor, max drawdown. Our tool fills in everything it leaves out.
| Feature | TradingView Strategy Tester | Pineify Backtest Deep Report |
|---|---|---|
| Sharpe / Sortino Ratio | Not available (manual calculation) | Auto-calculated from CSV upload |
| Monte Carlo Simulation | Not available | 1,000 bootstrap simulations with confidence intervals |
| Rolling Window Analysis | Not available | 20-trade sliding window (Sharpe, Sortino, Win Rate) |
| MFE / MAE Analysis | Not available | Interactive scatter plot with color-coded trades |
| Returns Distribution with Normal Curve | Not available | Histogram overlay with skewness and kurtosis |
| Visual Heatmaps | Not available | Monthly, Weekly, Daily, Time-of-Day |
| Excel Export Format | Raw CSV only | Professional 8-sheet workbook |
| Data Processing | TradingView servers | 100% client-side in your browser |
In my testing, the Entry/Exit Efficiency metrics caught that I was leaving about 18% of potential profit on the table across 200+ trades, something a basic win rate could never tell me.
Combine with our strategy optimizer to refine entry and exit rules, track your trades with a trading journal for ongoing validation, and pair metrics with chart analysis to confirm patterns before committing capital.
Related Trading Analysis Tools
Explore more free tools to complement your backtest analysis
Strategy Optimizer
Fine-tune entry and exit parameters using your backtest data to maximize risk-adjusted returns.
Trading Journal
Track your trade history and performance metrics to validate strategies before scaling capital.
Chart Analysis
Analyze chart patterns and market structure to confirm entry signals before committing capital.
Calmar Ratio Calculator
Measure your strategy CAGR against max drawdown with the Calmar Ratio metric calculator.
Backtesting Calculator
Evaluate trading strategy performance using win rate and risk-reward ratio inputs.
How to Analyze Backtest Results
Complete guide to interpreting TradingView backtest results beyond win rate.
Buy Once. All Tools. Forever.100,000+ Traders Already Upgraded
One-time payment · No subscriptions · Lifetime updates included
We're moving to annual subscriptions soon. This is your last chance to lock in a one-time payment and keep every future update at no extra cost.
💡 Once we switch, lifetime access will no longer be available
Plus
- Visual Pine Script Editor
- Pine Script & MQL5 Coding AI Agent (Knowledge Base, Auto Fix Error & Memory)
- 500 AI credits monthly
- Advanced Model (100 msgs / 5h, no credits required)
- AI Chart Analysis (2 times/day)
- Exclusive PineifyGPT access
- 18 premium scripts
- 🎁 Get 1 month Wundertrading Pro Plan (Reg. $49)
Advanced✨
- Everything in Plus plan
- AI Finance Agent
- Pineify® - Signals & Overlays™ (Invite-only indicator)
- 1000 AI credits monthly
- Advanced Model (200 msgs / 5h, no credits required)
- AI Chart Analysis (5 times/day)
- Trading Journal
- Strategy Optimizer Extension
- Backtest Report Deep Report
- Lifetime feature updates
Expert✨
- Everything in Advanced plan
- Custom ScreenerNew
- AI Stocks & Options PickerNew
- Market Insights (Options Flow, Dark Pool, Market Tide & More)New
- AI Trading AgentSoon
- AI Daily Portfolio ReportSoon
- 2500 AI credits monthly
- Advanced Model (500 msgs / 5h, no credits required)
- AI Chart Analysis (20 times/day)
- Priority access to new features
- Request custom indicators
- more coming soon...

Frequently Asked Questions
Everything you need to know about Backtest Deep Report
Run Your Backtest Through a Deeper Analysis
16+ KPI metrics, Rolling Analysis, Returns Distribution, Monte Carlo Simulation, and Trade Efficiency. Upload a CSV and get the full picture. There's no guesswork and no signup wall.