

Build a ticker timeline
Review dated buy and sell observations for one stock and see how activity changes across the available history.
Pineify Finance Agent retrieves Unusual Whales insider-flow aggregates for one ticker, grouped by trading date and buy or sell side. Each row can show premium, average price, volume, transaction count, and unique-insider count. Use the date and ticker to guide a separate filing search; this aggregate contains no individual names, transaction codes, or filing links.
Opens Finance Agent with an AAPL insider-flow research question ready to send.
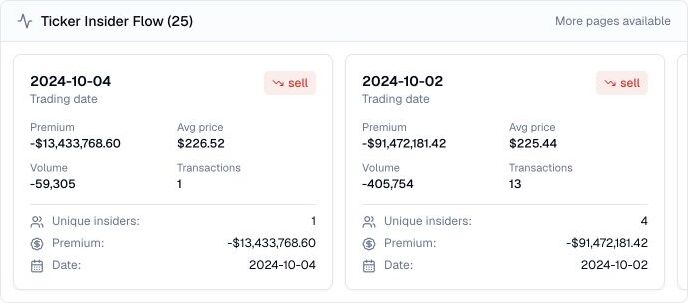
A single-ticker view of reported insider activity
Ask for a ticker and review the returned dates and sides. A request returns 25 rows by default and at most 50; a date with both buying and selling has two rows. When “More pages available” appears, ask for the next page. Responses can be cached for up to one hour, and this tool has no date-range or owner filter.
The timeline is a discovery layer. It can include different transaction types and may cover an older or incomplete period, so investigate the underlying people, forms, ownership, and filing notes before drawing a conclusion.
Use cases
Review dated buy and sell observations for one stock and see how activity changes across the available history.
Read transaction count alongside unique-insider count within each date-and-side row. One person can have several transactions or appear on several dates, so summing these counts does not produce the number of distinct people across the whole timeline.
Use notable dates to find the individual insiders, transaction codes, ownership details, and source documents worth reading next.
Prompt examples
FAQ
Use an unusual date as a lead, then inspect the individual insiders, transaction types, ownership context, and current company evidence.
Open Finance AgentFor informational and research use only. No output is investment advice or a guarantee of future performance.