

Compare valuation and returns
Review market cap, enterprise value, EV-based multiples, earnings yield, free-cash-flow yield, ROA, ROE, ROIC, and related returns side by side across reported periods.
Pineify Finance Agent brings a broad set of company metrics into one period-by-period view, from market and enterprise value to returns, cash conversion, capital efficiency, leverage, yields, and asset value. Use it to spot the indicators that changed, compare a company with its own history, and decide which statements, definitions, or business drivers deserve deeper research.
Opens Finance Agent with an Apple annual key-metrics question ready to send.
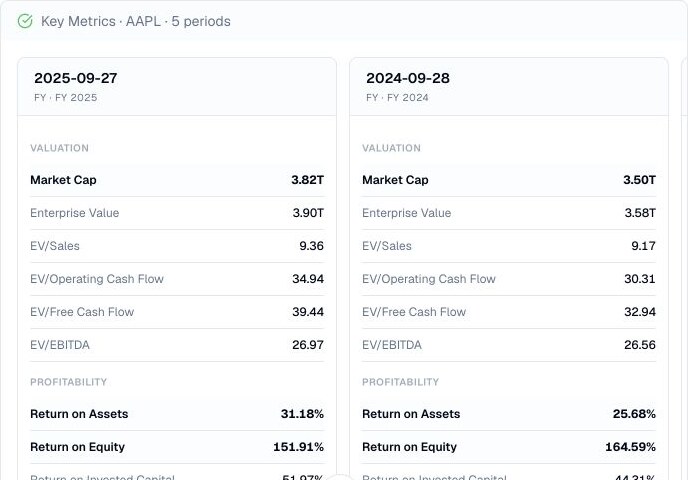
A cross-functional metric view
A single ratio rarely explains a business. Finance Agent requests FMP metrics for a ticker with an optional annual, quarter or specific fiscal-period filter. It returns up to 50 provider rows with date, fiscal year, period and reported currency. The current requested period-count setting does not change the returned count; there is no date-range or next-page parameter.
These indicators are a research map, not a universal scorecard. Some values are derived from reported financial data, market context, or metric definitions that can differ by issuer and period. Start with the pattern, then inspect the underlying statements and notes before treating a movement as meaningful.
Use cases
Review market cap, enterprise value, EV-based multiples, earnings yield, free-cash-flow yield, ROA, ROE, ROIC, and related returns side by side across reported periods.
Use current ratio, days sales outstanding, days payables, days inventory, operating cycle, cash conversion cycle, and expense-to-revenue measures to focus working-capital questions.
Compare capital and cash-flow measures with their underlying statements. For example, FMP defines Income Quality as operating cash flow divided by net income; inspect both amounts when net income is small or negative instead of reading the ratio as a quality rating.
Prompt examples
FAQ
Use the grouped indicators to prioritize follow-up, then confirm dates, definitions, units, market context, source statements, and unusual items before relying on a comparison.
Open Finance AgentFor informational and research use only. No output is investment advice or a guarantee of future performance.