

Find the largest positions
Compare weights among the returned holdings. The tool keeps the first 50 source rows without sorting them, so confirm that the list includes the largest positions before describing them as the fund’s top holdings.
Pineify Finance Agent shows up to 50 available holdings for an ETF or mutual fund, with security names, weights, shares, and market values. Use the returned positions to investigate concentration and overlapping exposure, then check the issuer’s complete holdings file before drawing portfolio-wide conclusions.
Opens Finance Agent with an SPY holdings question ready to send.
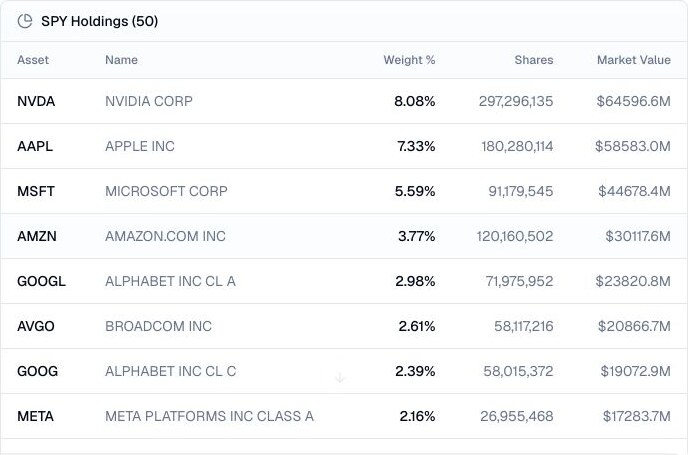
A position-level view of a fund
An ETF ticker can hide a concentrated portfolio. Finance Agent puts the security names, symbols, weights, shares, and displayed market values together so you can see whether a fund really matches the exposure you expect.
Holdings are a point-in-time snapshot and can change with markets, rebalances, corporate actions, and reporting schedules. Use the table to form a research hypothesis, then check the fund’s official documents and current methodology.
Use cases
Compare weights among the returned holdings. The tool keeps the first 50 source rows without sorting them, so confirm that the list includes the largest positions before describing them as the fund’s top holdings.
Compare weights and displayed market values to understand whether an ETF is broadly diversified or dominated by a few names.
Use position-level evidence to investigate overlap, theme exposure, and differences between ETFs before comparing fees or performance.
Prompt examples
FAQ
Use holdings to see what a fund owns, then verify the fund’s methodology, rebalance schedule, fees, liquidity, and current company evidence.
Open Finance AgentFor informational and research use only. No output is investment advice or a guarantee of future performance.