

Compare central estimates
Read the consensus and median together to see how the midpoint behaves when a few high or low targets pull the average.
Pineify Finance Agent shows a stock’s consensus analyst price target alongside the median, highest, and lowest available targets. The range and its spread make disagreement visible instead of hiding it inside one average. Use the view to frame market expectations and decide which estimates and assumptions to investigate—not to treat a target as a guaranteed price or a trading signal.
Opens Finance Agent with an Apple price-target consensus question ready to send.
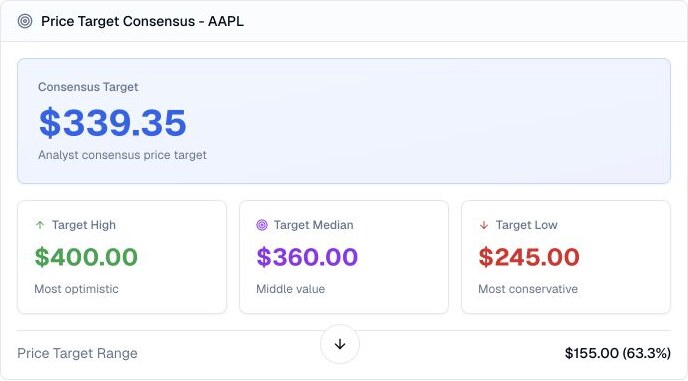
A range-aware expectations view
Enter one stock ticker to retrieve FMP’s four summary values. FMP describes consensus as the average analyst target. These values show central tendency and extremes; they do not reveal the full distribution, number of analysts, individual revisions, or probability of reaching a price.
The range is a summary of published estimates, not a valuation model or a promise. Target dates, horizons, currency, outliers, and sample composition all affect the result, so use it to guide source review rather than to replace it.
Use cases
Read the consensus and median together to see how the midpoint behaves when a few high or low targets pull the average.
Review the highest and lowest targets and the total range to understand how widely analyst expectations are spread.
Use an unusually wide range or a surprising midpoint to decide which dated notes, assumptions, and company facts deserve deeper research.
Prompt examples
FAQ
Use the consensus and spread to choose follow-up research, then verify target dates, currency, time horizon, assumptions, and current company evidence.
Open Finance AgentFor informational and research use only. No output is investment advice or a guarantee of future performance.