

Compare expectations across periods
Place available annual or quarterly forecasts side by side to understand how expectations for revenue, earnings, and profitability change over time.
Pineify Finance Agent can organize analyst consensus estimates for a company across annual or quarterly periods, showing averages and low-to-high ranges for revenue, EPS, EBITDA, and net income alongside available contributor counts for revenue and EPS. Use it to understand market expectations, see where forecasts diverge, and frame better questions before earnings.
Opens Finance Agent with an annual Apple analyst-estimates question ready to send.
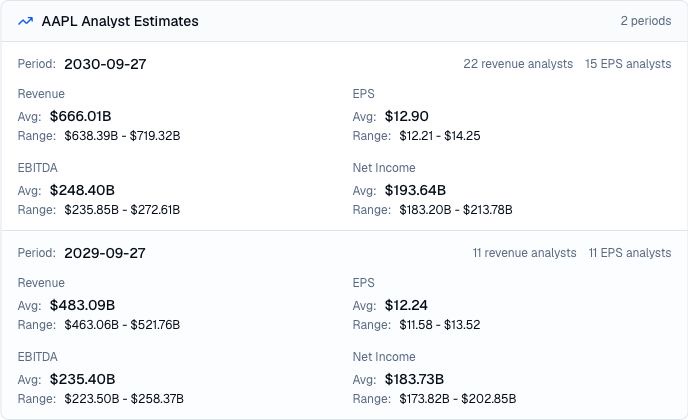
Consensus expectations at a glance
A consensus average can hide meaningful disagreement. Finance Agent keeps the average beside the low and high estimates for the same period, making it easier to see both the central expectation and the spread around it.
Analyst estimates are forecasts, not reported results or company promises. Coverage can differ by metric and period, estimates can be revised, and a wider range may reflect uncertainty or different assumptions rather than a likely outcome.
Use cases
Place available annual or quarterly forecasts side by side to understand how expectations for revenue, earnings, and profitability change over time.
Review average, low, and high estimates together so a single headline number does not hide the spread of analyst expectations.
Use the contributor counts and forecast spread to decide which estimates need closer comparison with company guidance, filings, and later revisions.
Prompt examples
FAQ
Compare the range of expectations, identify where uncertainty is widest, and verify the assumptions against company guidance, filings, and later estimate revisions.
Open Finance AgentFor informational and research use only. No output is investment advice or a guarantee of future performance.