

Spot portfolio concentration
Compare sector value and position counts for one report date. Fetch additional pages before calculating each sector’s share of the returned total; that denominator still covers only the available disclosed positions.
Pineify Finance Agent retrieves provider-grouped sector rows for a reported institution portfolio and shows sector value, position count, increases, decreases, closed positions, and report dates. Use the view to spot concentration and activity across industries, while treating every figure as a dated disclosure snapshot rather than a live allocation or investment thesis.
Opens Finance Agent with an institution sector-exposure question ready to send.
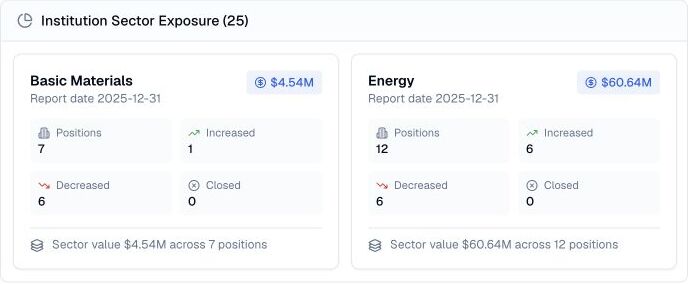
A sector map of reported institutional holdings
Sector exposure helps you move from a long holdings list to a portfolio-level view. Finance Agent retrieves Unusual Whales sector rows using a precise institution name or identifier, an optional report date, and a page. It defaults to page 1 with 25 rows, caps each request at 50, and may reuse a cached response for up to an hour. It does not calculate the sector grouping from raw filings.
The grouping reflects available classifications and filing snapshots. It can miss assets outside the report, and a sector total does not explain the institution’s mandate, hedges, or current intent. Use it to prioritize deeper research, not to recreate a live portfolio.
Use cases
Compare sector value and position counts for one report date. Fetch additional pages before calculating each sector’s share of the returned total; that denominator still covers only the available disclosed positions.
Review increases, decreases, and closed positions to identify where reported holdings changed during the period.
Use sector totals to choose a separate institution-holdings query and an EDGAR search. These cards do not contain company constituents, filing dates, or filing URLs.
Prompt examples
FAQ
Use the sector view to choose what to investigate next, then verify the reporting period, underlying holdings, and original disclosures.
Open Finance AgentFor informational and research use only. No output is investment advice or a guarantee of future performance.